What this eTMF screenshot shows
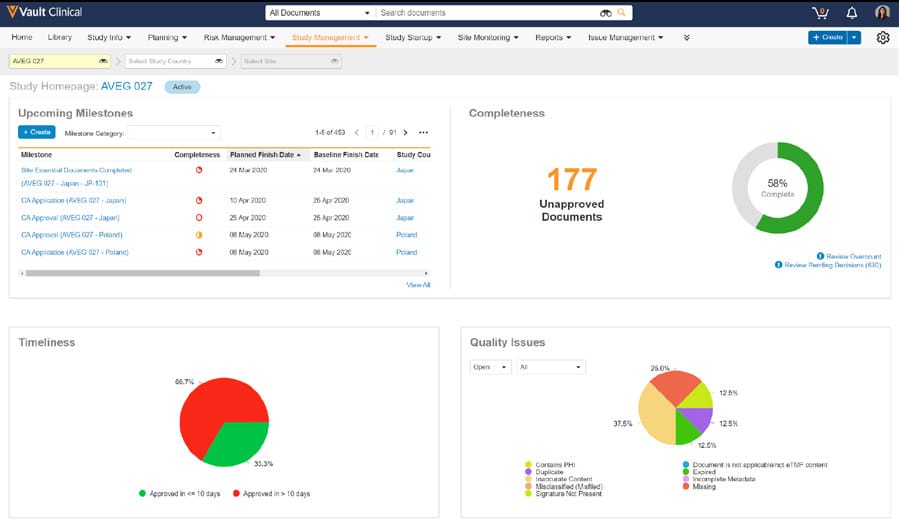
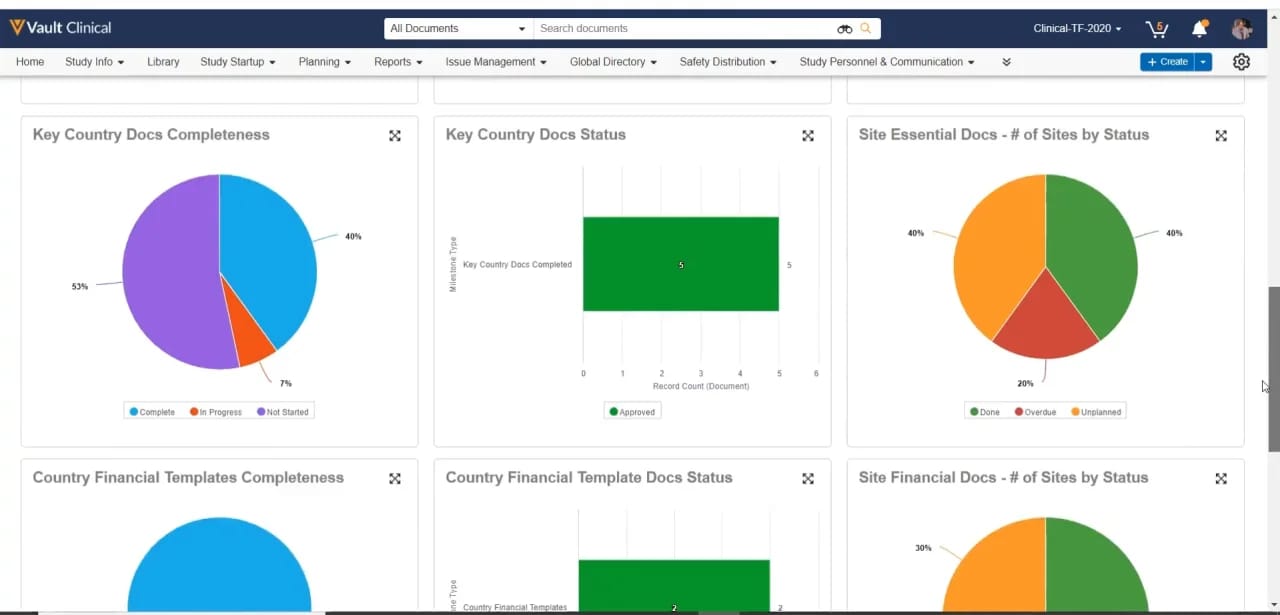
This interface reference displays a dashboard within Veeva Vault Clinical, specifically configured for tracking document completeness and status metrics. The layout features a grid of visual reporting cards, each presenting key performance indicators related to clinical trial documentation. The visible charts focus on country-level and site-level document metrics, such as Key Country Docs Completeness, Key Country Docs Status, and Site Essential Docs by status. The top navigation bar provides access to various clinical operations areas, including Study Info, Library, Study Startup, and Reports, alongside global search and user profile controls. This dashboard serves as a centralized visual interface for monitoring the progress of essential clinical trial documentation across different sites and countries, utilizing pie charts and bar graphs to represent document states such as complete, in progress, not started, approved, overdue, and unplanned.
Visible interface elements
- Vault Clinical header with search bar, study selector, and user profile controls.
- Navigation bar containing tabs for Study Info, Library, Study Startup, Planning, and Reports.
- Key Country Docs Completeness pie chart showing percentages for Complete, In Progress, and Not Started documents.
- Key Country Docs Status horizontal bar chart displaying a record count of five approved documents.
- Site Essential Docs pie chart illustrating the percentage of sites categorized as Done, Overdue, or Unplanned.
- Maximize icons located in the top right corner of each dashboard widget.
- Blue "+ Create" button and a configuration gear icon on the right side of the navigation bar.
Interface details
The user interface is structured with a dark blue header containing the Vault Clinical logo, a document search bar, a study selector showing Clinical-TF-2020, and user utility icons. Below this, a white navigation bar lists primary tabs such as Home, Study Info, Library, Study Startup, Planning, Reports, and Issue Management, alongside a blue "+ Create" button. The main workspace displays a grid of reporting widgets. The first widget, "Key Country Docs Completeness," is a pie chart showing 53 percent Not Started (purple), 40 percent Complete (blue), and 7 percent In Progress (orange). Next to it, "Key Country Docs Status" is a horizontal bar chart displaying a record count of five approved documents (green) for the Key Country Docs Completed milestone. The third widget, "Site Essential Docs - # of Sites by Status," is a pie chart illustrating site distribution: 40 percent Done (green), 40 percent Unplanned (orange), and 20 percent Overdue (red). Each widget includes a maximize icon in the upper right corner to expand the chart view. The bottom row displays partially visible widgets for Country Financial Templates Completeness, Country Financial Template Docs Status, and Site Financial Docs.
Workflow context
In a clinical operations workflow, this dashboard can support study managers and trial master file specialists in monitoring the progress of essential documentation. By presenting visual summaries of document completeness, the interface could help teams identify potential bottlenecks, such as sites with overdue essential documents or countries with a high percentage of unstarted templates. For instance, the "Site Essential Docs" pie chart highlights the proportion of overdue sites, which can prompt targeted follow-up actions. Similarly, tracking the status of key country documents can assist in assessing readiness for study milestones. This visual representation of document states can streamline the oversight process, allowing users to quickly gauge overall trial master file health and prioritize document collection and review activities without manually searching through individual folders or document lists.
Source, version, and interpretation limits
The analyzed image is a public screenshot from the IntuitionLabs public Veeva screenshot catalog, representing a configured Veeva Vault Clinical environment. Because this is a static image, it cannot verify real-time data synchronization, automated background calculations, or active integration with live clinical databases. The visible metrics, counts, and study identifiers, such as Clinical-TF-2020, represent synthetic demonstration data rather than active clinical trial records. Actual user interfaces, available tabs, and specific dashboard configurations may vary depending on the organization's specific Vault release, user permissions, and custom system configurations.
Authoritative references
Use these primary sources to confirm current product positioning, terminology, and release-specific behavior.
- IntuitionLabs public Veeva screenshot catalog(Public screenshot catalog)
- Veeva eTMF product overview(Official Veeva product page)
- Veeva guide to eTMF features and inspection readiness(Official Veeva resource)