
Vault Clinical Dashboard
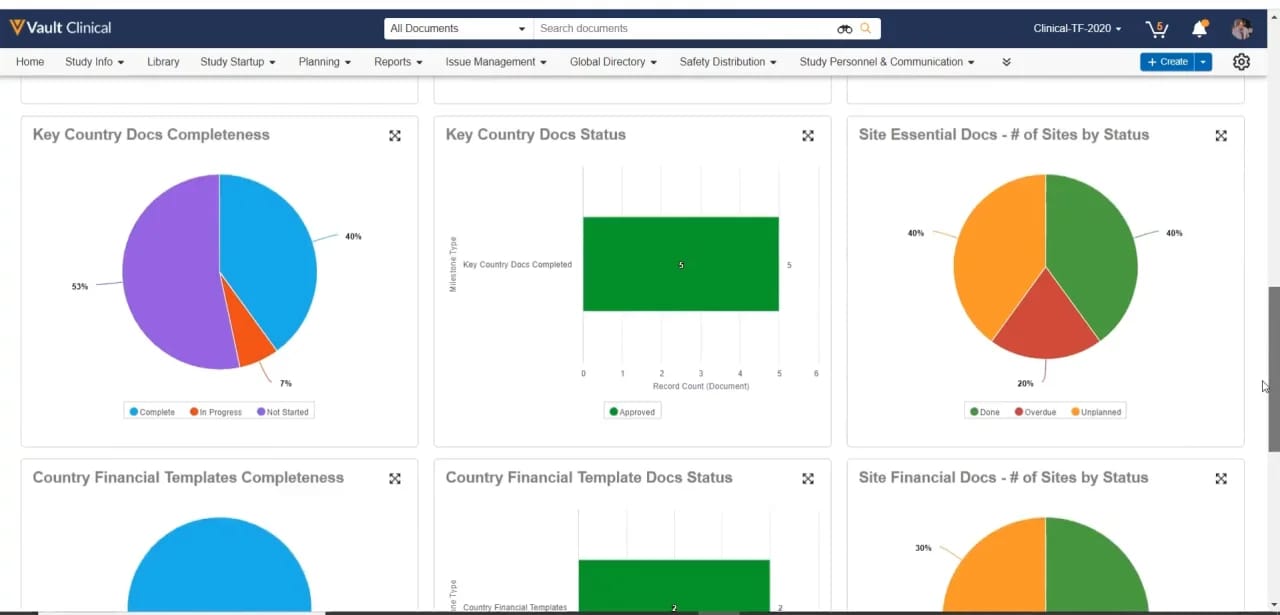
The screenshot depicts a dashboard from Vault Clinical, focusing on document completeness and status metrics. The dashboard is organized as a grid displaying various charts and graphs. The first chart, "Key Country Docs Completeness," is a pie chart showing the distribution of key country documents by status: Complete (40%), In Progress (7%), and Not Started (53%). Adjacent to it is a bar graph labeled "Key Country Docs Status," indicating that 5 key country documents are marked as "Approved." The third chart, "Site Essential Docs - # of Sites by Status," is another pie chart, divided into Done (40%), Overdue (20%), and Unplanned (40%). Below these charts are titles for three more charts, but the chart data is not entirely visible. "Country Financial Templates Completeness," "Country Financial Template Docs Status," and "Site Financial Docs - # of Sites by Status." The rightmost pie chart shows 30% for an unknown category. Overall, the dashboard provides a high-level view of document-related metrics, facilitating tracking and monitoring of clinical trial-related documents.