What this eTMF screenshot shows
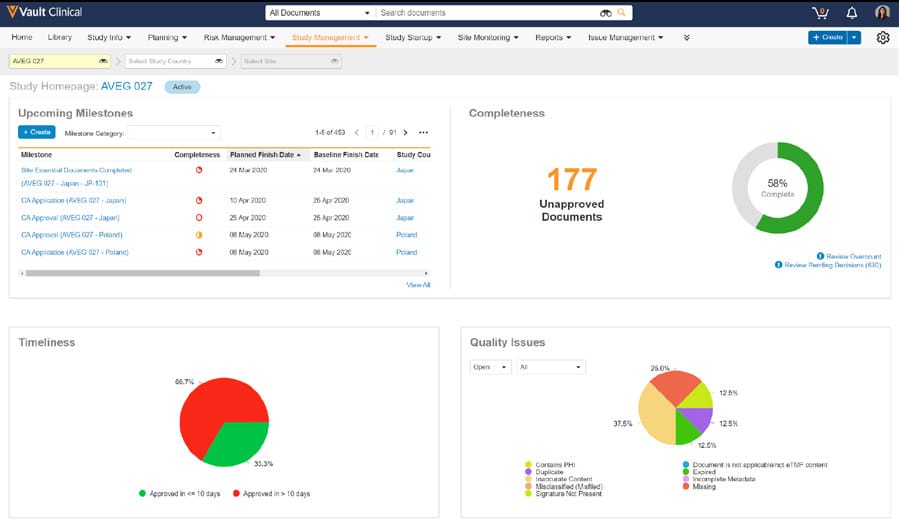
This reference page describes the Study Homepage dashboard interface within Veeva Vault eTMF, configured for the synthetic study "AVEG 027". The interface provides a centralized view of trial master file metrics across four primary visual panels: Upcoming Milestones, Completeness, Timeliness, and Quality Issues. Designed for clinical operations users, this dashboard displays high-level summaries of document status, milestone progress, and potential quality concerns. The top navigation bar allows users to access various clinical modules, while study-specific filters at the top left enable targeted views by country or site. The visual components, including donut and pie charts, summarize synthetic metrics such as unapproved document counts, completion percentages, and document processing timelines. This layout serves as a central hub for monitoring trial master file health and identifying areas that require administrative attention.
Visible interface elements
- Study Homepage: AVEG 027 header with an Active status badge and dropdown filters for country and site selection.
- Upcoming Milestones panel displaying a table with milestone names, completeness icons, and planned versus baseline finish dates.
- Completeness panel featuring a donut chart showing 58% Complete and a text callout for 177 Unapproved Documents.
- Timeliness panel containing a pie chart comparing documents approved in ten days or less against those taking longer.
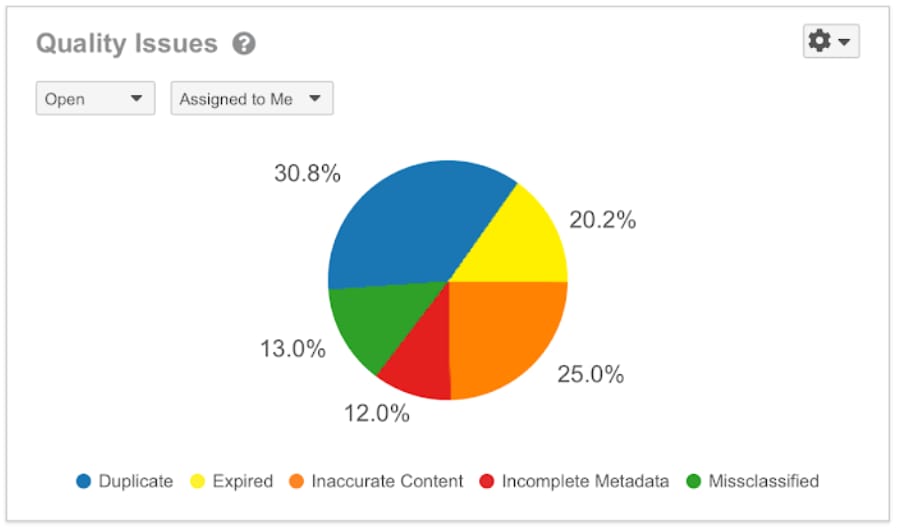
- Quality Issues panel displaying a multi-colored pie chart with categories such as Incomplete Metadata and Missing.
- Primary navigation bar with tabs for Home, Library, Study Info, Planning, Risk Management, and Study Management.
- Global search bar and utility icons located at the top of the Vault Clinical interface.
Interface details
The interface is structured with a standard Veeva Vault Clinical header featuring global search, notifications, and a primary navigation menu. Below this, the active study "AVEG 027" is highlighted alongside dropdown selectors for filtering by country and site. The main workspace is divided into a two-by-two grid of widgets. The top-left panel, "Upcoming Milestones," displays a tabular list of milestones, completeness indicators, planned and baseline finish dates, and associated countries. To its right, the "Completeness" panel highlights a large metric of 177 unapproved documents alongside a donut chart indicating 58 percent completion, with quick links for reviewing overcounts and pending decisions. The bottom-left "Timeliness" panel features a pie chart illustrating the proportion of documents approved within ten days versus those taking longer. Finally, the bottom-right "Quality Issues" panel presents a multi-colored pie chart categorizing open issues, such as missing signatures, expired documents, or incomplete metadata, complete with dropdown filters to refine the displayed dataset.
Workflow context
Within clinical operations, this dashboard can support study managers and trial master file specialists in tracking overall document readiness and compliance. By presenting aggregated metrics on completeness, timeliness, and quality, the interface could help users identify bottlenecks in document collection or review cycles. For instance, the "Upcoming Milestones" panel can assist in tracking critical path activities, while the "Quality Issues" breakdown could guide targeted remediation efforts for specific document errors. The "Completeness" widget provides a direct indicator of outstanding workload, which can help teams allocate resources to process unapproved files. Although the displayed data is illustrative, this structured presentation of metrics is designed to facilitate inspection readiness by highlighting areas where documentation is lagging or contains errors, thereby supporting proactive trial management.
Source, version, and interpretation limits
The screenshot is sourced from the Veeva eTMF features brief, representing an official Veeva PDF containing illustrative embedded user interface elements. The displayed data, including study names, dates, and document counts, is synthetic and intended solely for demonstration purposes. Because this is a static image, it cannot confirm real-time data synchronization, automated validation, or active integration with live clinical systems. Additionally, the specific widgets, fields, and layout shown reflect a particular configuration of Veeva Vault eTMF, which may vary across different software releases, user permissions, or individual customer implementations.
Authoritative references
Use these primary sources to confirm current product positioning, terminology, and release-specific behavior.
- Veeva eTMF features brief(Official Veeva PDF)
- Veeva eTMF product overview(Official Veeva product page)
- Veeva guide to eTMF features and inspection readiness(Official Veeva resource)