What this Study Startup screenshot shows
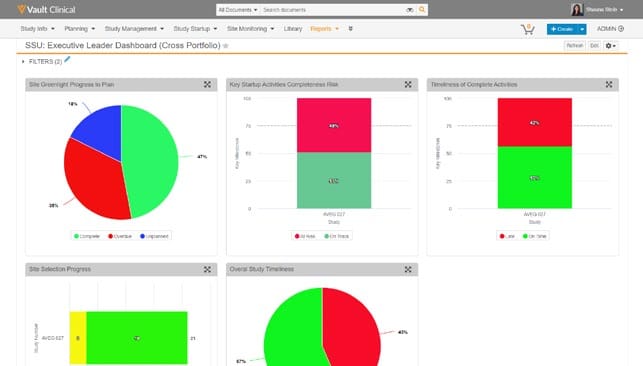
This interface reference displays the "SSU: Executive Leader Dashboard (Cross Portfolio)" within the Veeva Vault Clinical application, specifically focusing on the Site Selection Progress workflow. The dashboard provides a high-level visual summary of study startup metrics across multiple dimensions. It features five distinct graphical widgets that display synthetic demonstration data related to site greenlight progress, key startup activity risks, timeliness of completed activities, site selection progress, and overall study timeliness. The active navigation tab is "Reports," indicating that this view is part of the reporting and analytics capabilities of the platform. By presenting these metrics in a single consolidated view, the dashboard offers clinical operations leaders a structured way to monitor study startup milestones, identify potential bottlenecks, and track progress against planned timelines for specific studies such as the visible "AVEG-027" trial.
Visible interface elements
- SSU: Executive Leader Dashboard (Cross Portfolio) title with star icon and action buttons for Refresh and Edit.
- Active Reports tab highlighted in the primary navigation bar alongside Study Startup and Site Monitoring.
- Site Greenlight Progress to Plan pie chart showing Complete, Overdue, and Unplanned percentages.
- Key Startup Activities Completeness Risk vertical stacked bar chart for study AVEG-027.
- Timeliness of Complete Activities vertical stacked bar chart displaying Late and On Time percentages.
- Site Selection Progress horizontal bar chart showing numeric segments of 8 and 13 for study AVEG-027.
- Overall Study Timeliness pie chart displaying a percentage breakdown of study progress.
Interface details
The user interface utilizes a clean, modular layout typical of the Veeva Vault Clinical platform. At the top, a global navigation bar includes options for Study Info, Planning, Study Management, Study Startup, Site Monitoring, Library, and Reports. Below this, the dashboard header displays the title "SSU: Executive Leader Dashboard (Cross Portfolio)" alongside action buttons for Refresh, Edit, and configuration settings. A collapsible "FILTERS (2)" section allows users to refine the displayed data. The main body consists of five visualization widgets. The "Site Greenlight Progress to Plan" pie chart uses green, red, and blue segments to represent complete, overdue, and unplanned statuses. Two vertical stacked bar charts for study "AVEG-027" display "Key Startup Activities Completeness Risk" (categorized as At Risk or On Track) and "Timeliness of Complete Activities" (categorized as Late or On Time). A horizontal bar chart titled "Site Selection Progress" shows numeric progress counts of 8 and 13 for study "AVEG-027." Finally, the "Overall Study Timeliness" pie chart illustrates a percentage breakdown of study progress. Each widget includes a maximize icon in the top-right corner for detailed viewing.
Workflow context
Within clinical trial operations, the site selection and startup phase is critical to ensuring timely study initiation. This dashboard can support clinical operations leaders by providing a centralized view of key performance indicators. For instance, the "Site Greenlight Progress to Plan" chart could help managers identify which sites are lagging in their activation steps, while the "Key Startup Activities Completeness Risk" widget can highlight potential delays in critical-path milestones for specific studies like "AVEG-027." By monitoring the "Timeliness of Complete Activities" and "Site Selection Progress" metrics, teams can make informed decisions regarding resource allocation or site support. This visual representation of startup data can assist in identifying systemic bottlenecks across a portfolio, ultimately supporting efforts to streamline the transition from site feasibility to active patient enrollment.
Source, version, and interpretation limits
The screenshot is sourced from an official Veeva Study Startup datasheet and represents a 2020-era user interface. Because this is a static image, it cannot establish real-time data synchronization, automated updates, or active integration with live clinical databases. The displayed metrics, study names such as "AVEG-027," and percentage breakdowns are synthetic demonstration data and do not represent actual clinical trial results. Additionally, individual customer configurations, user permissions, and subsequent software updates may alter the layout, available filters, specific widgets, and overall functionality of the dashboard compared to the historical interface shown here.
Authoritative references
Use these primary sources to confirm current product positioning, terminology, and release-specific behavior.
- Veeva Study Startup datasheet(Official Veeva PDF)
- Veeva Study Startup product overview(Official Veeva product page)
- Veeva Study Startup features(Official Veeva resource)