What this Study Startup screenshot shows
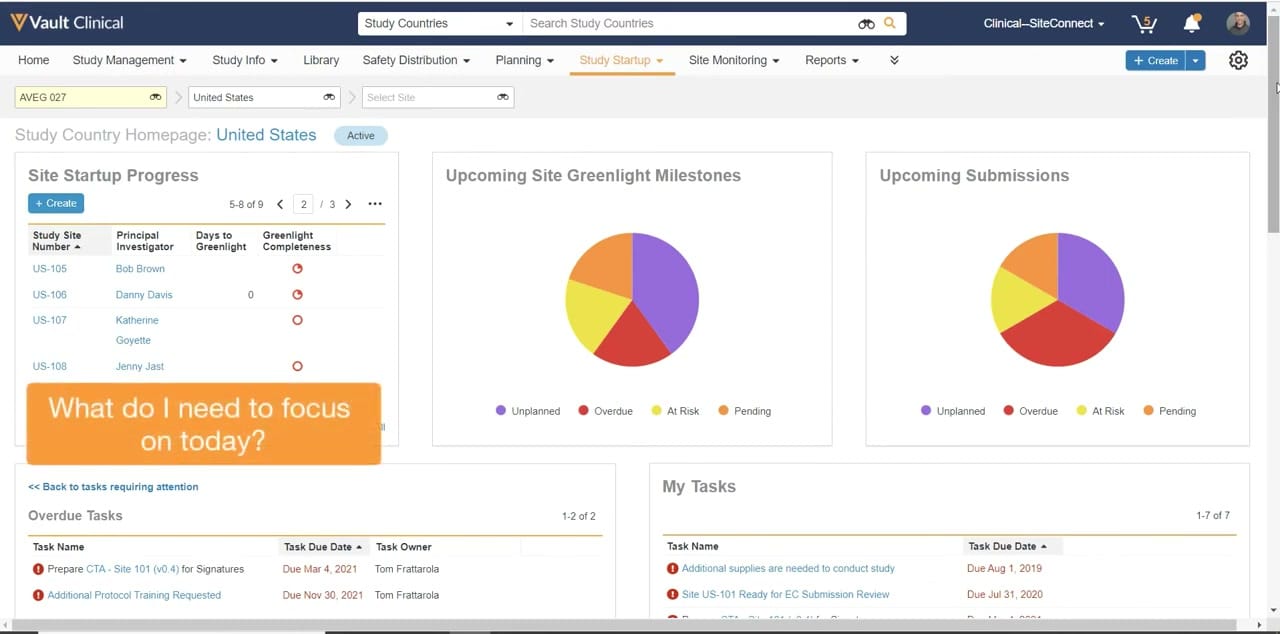
This public interface reference displays the Study Country Homepage within Veeva Vault Study Startup, focused on the United States country view for study AVEG 027. The dashboard provides a centralized workspace for clinical operations users to monitor site startup progress, milestones, and pending actions. The layout features several structured cards, including a Site Startup Progress table, visual pie charts for Upcoming Site Greenlight Milestones and Upcoming Submissions, and dedicated lists for Overdue Tasks and My Tasks. By presenting key metrics and task lists in a single view, the interface helps users identify outstanding items that require immediate attention. The page includes standard navigation tabs, study-level context selectors, and status indicators to help users manage country-specific startup activities.
Visible interface elements
- Study Country Homepage title with an Active status badge and United States country context.
- Site Startup Progress table listing study site numbers, principal investigators, and greenlight completeness indicators.
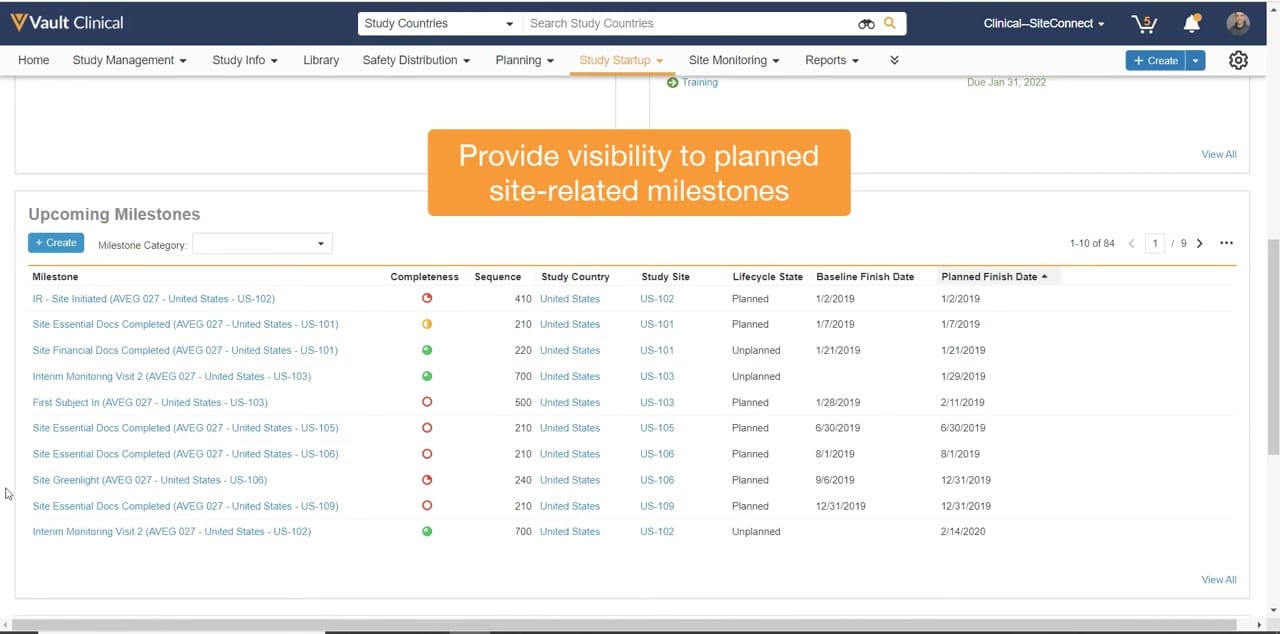
- Upcoming Site Greenlight Milestones pie chart displaying Unplanned, Overdue, At Risk, and Pending categories.
- Upcoming Submissions pie chart showing status distributions for pending submissions.
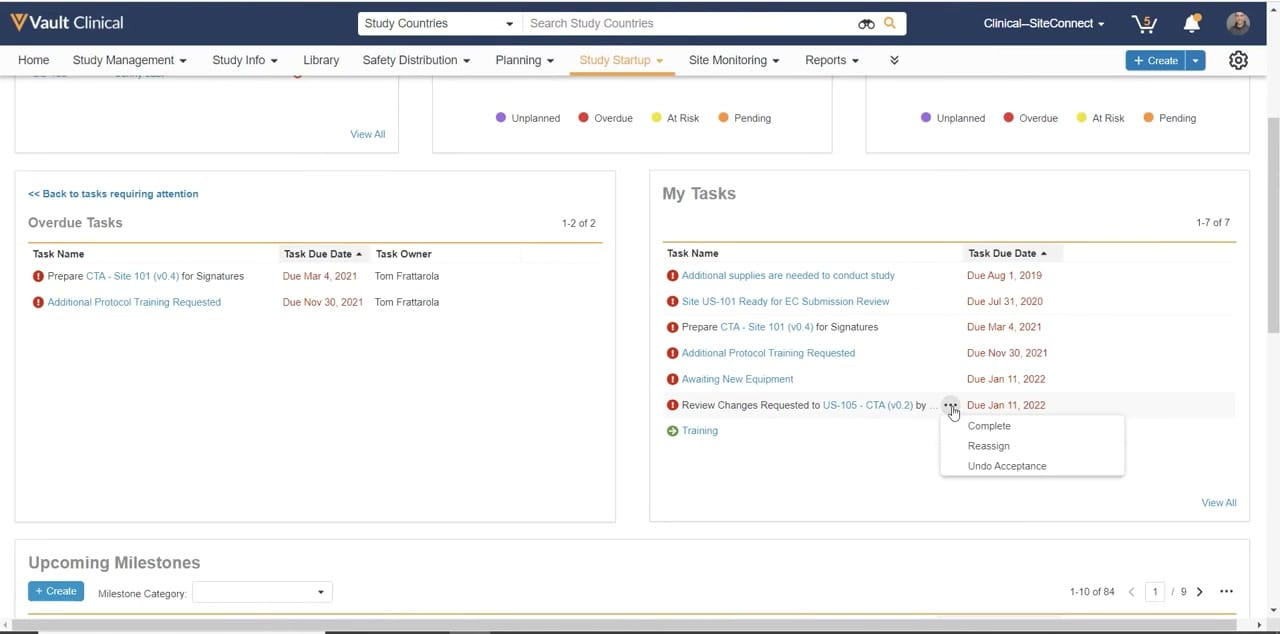
- Overdue Tasks list displaying task names, past due dates, and assigned task owners.
- My Tasks table showing a list of tasks with associated due dates.
- Top navigation bar featuring tabs for Study Management, Study Info, Library, and Study Startup.
- Context selectors at the top left for filtering by study, country, and site.
Interface details
The interface is organized into a multi-column dashboard layout beneath a global navigation header. At the top, breadcrumb-style dropdown selectors allow users to filter by study (AVEG 027), country (United States), and site. The main workspace displays the "Study Country Homepage: United States" with an "Active" status badge. The "Site Startup Progress" card contains a tabular list of study sites, principal investigators, days to greenlight, and greenlight completeness indicators. To the right, two pie charts visualize status distributions for "Upcoming Site Greenlight Milestones" and "Upcoming Submissions," categorizing items as Unplanned, Overdue, At Risk, or Pending. The lower section of the screen contains two task lists. The "Overdue Tasks" table lists specific task names, due dates, and owners, such as Tom Frattarola, alongside a link to return to tasks requiring attention. The "My Tasks" table displays a list of assigned tasks with their respective due dates. Standard UI controls, including pagination buttons, search bars, and a "Create" button, are visible across the dashboard cards to facilitate record navigation and data entry.
Workflow context
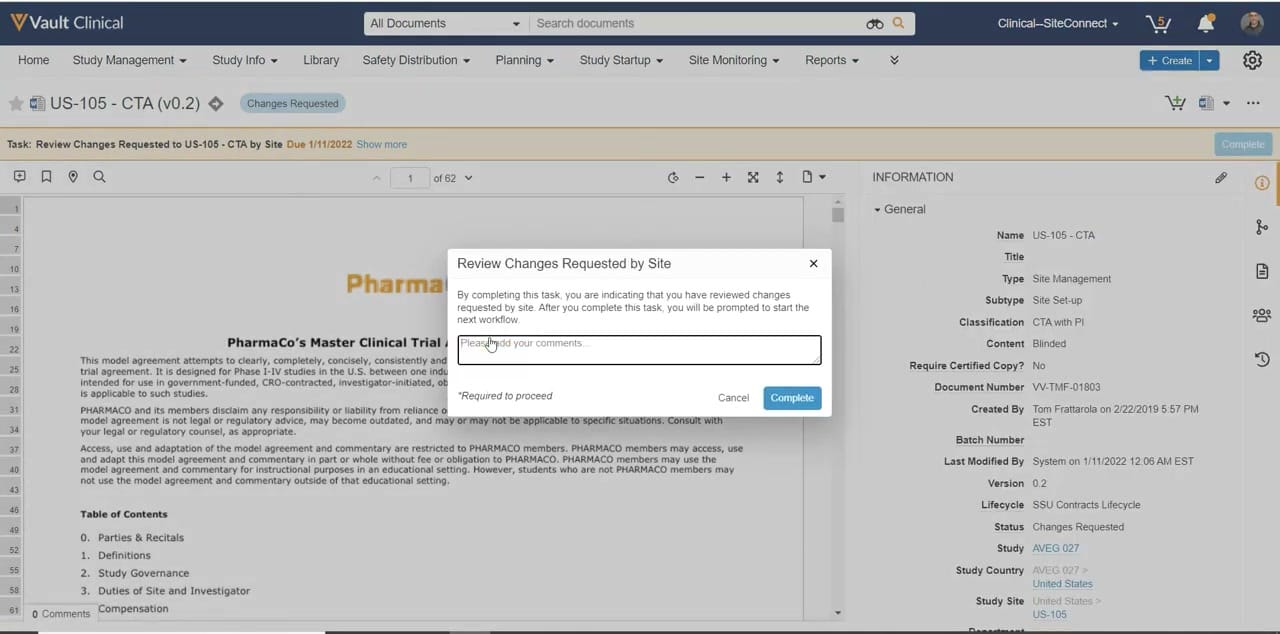
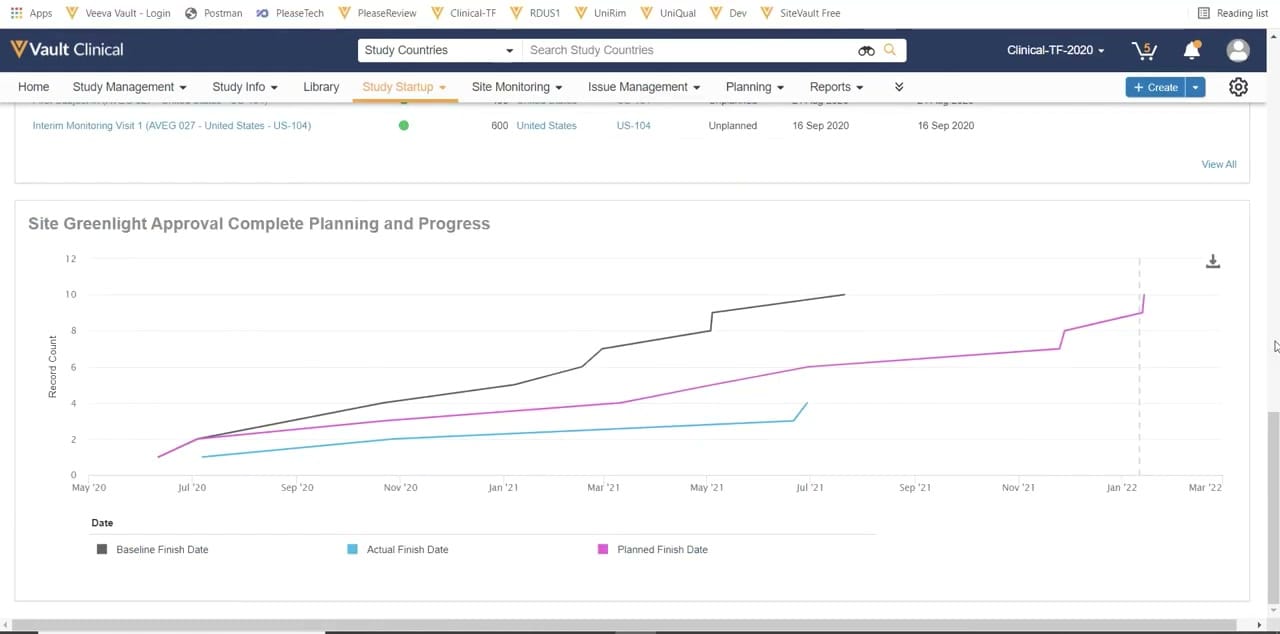
In clinical operations, managing the transition from study planning to site activation involves tracking numerous concurrent tasks, documents, and milestones. This homepage interface can support study startup specialists and country managers in organizing their daily priorities. By consolidating site-specific progress and pending submissions into visual charts, the dashboard could help users quickly identify bottlenecks in the greenlight process. For instance, the "Upcoming Site Greenlight Milestones" chart categorizes milestones by risk level, which can assist teams in prioritizing resource allocation. Additionally, the "Overdue Tasks" and "My Tasks" lists provide direct visibility into outstanding action items, such as preparing clinical trial agreements or reviewing ethics committee submissions. This structured presentation of country-level data can support clinical teams in maintaining momentum during the critical startup phase of a clinical trial.
Source, version, and interpretation limits
The description is based on a public video demonstration of the Veeva Vault Study Startup homepage from February 2022. The visible data, including study names, investigator names, dates, and task descriptions, represents synthetic demonstration data and does not reflect actual clinical trial operations. Because this is a static screenshot, it is not possible to verify real-time data synchronization, automated workflows, or system integration capabilities. The specific layout, available fields, and dashboard widgets may vary depending on individual customer configurations, user permissions, and subsequent software updates. This reference is intended solely to describe the visible user interface elements and layout patterns.
Authoritative references
Use these primary sources to confirm current product positioning, terminology, and release-specific behavior.
- Veeva Vault Study Startup Homepage(Official Veeva YouTube demo)
- Veeva Study Startup product overview(Official Veeva product page)
- Veeva Study Startup features(Official Veeva resource)