What this Study Startup screenshot shows
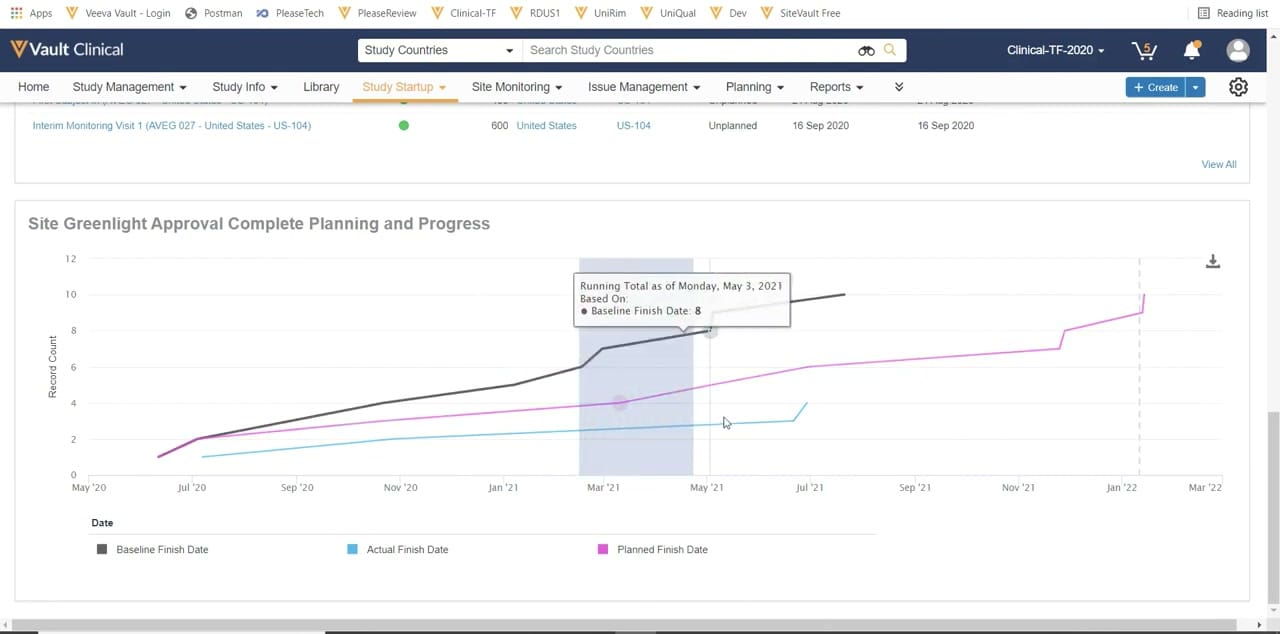
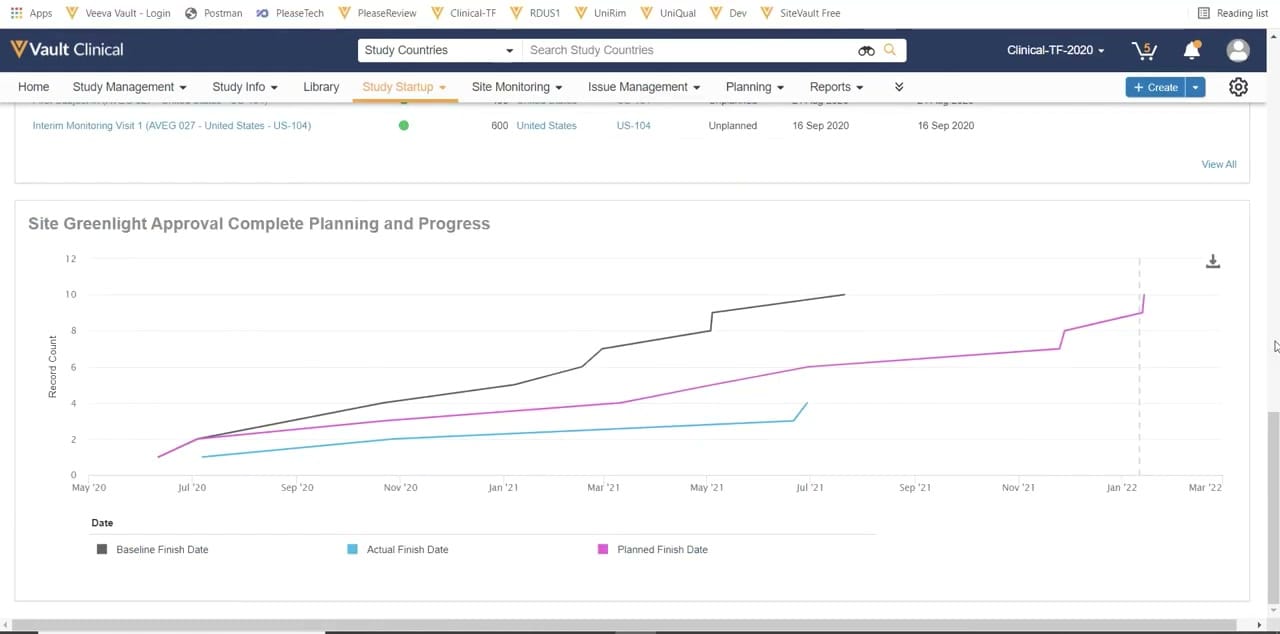
This interface reference displays the "Site Greenlight Approval Complete Planning and Progress" chart within the Veeva Vault Study Startup application. The visualization tracks site activation progress by plotting record counts against a timeline spanning from May 2020 to March 2022. The chart compares three distinct metrics: Baseline Finish Date, Actual Finish Date, and Planned Finish Date. This dashboard component is housed under the active Study Startup tab within the broader Vault Clinical suite. The interface provides clinical operations teams with a visual representation of milestone completion trends, helping them monitor site activation trajectories. By displaying planned versus actual progress, the chart serves as a key tool for tracking study startup timelines across multiple participating sites.
Visible interface elements
- "Site Greenlight Approval Complete Planning and Progress" chart title.
- Line graph displaying Baseline Finish Date, Actual Finish Date, and Planned Finish Date.
- Y-axis labeled "Record Count" ranging from 0 to 12.
- X-axis labeled "Date" spanning from May 2020 to March 2022.
- Active "Study Startup" tab in the primary navigation menu.
- Download icon in the top-right corner of the chart panel.
- Partial record row showing "Interim Monitoring Visit 1 (AVEG 027 - United States - US-104)".
Interface details
The user interface is structured with a standard Veeva Vault Clinical header, featuring global search capabilities configured for "Study Countries" and a primary navigation bar. The active tab is "Study Startup," with other visible options including Study Management, Study Info, Library, Site Monitoring, Issue Management, Planning, and Reports. Below the navigation bar, a partial list view displays a monitoring visit record with associated metadata such as country, site ID, and status. The main body of the screen is dedicated to the "Site Greenlight Approval Complete Planning and Progress" line graph. The vertical axis measures "Record Count" from 0 to 12, while the horizontal axis represents a chronological timeline labeled "Date" with bi-monthly intervals. Three colored lines represent the data: a grey line for "Baseline Finish Date," a blue line for "Actual Finish Date," and a magenta line for "Planned Finish Date." A vertical dashed line marks a specific point in time near January 2022. A download icon is positioned in the upper right corner of the chart panel, allowing users to export the visualization.
Workflow context
In clinical trial management, the "greenlight" process represents the final approval phase before a clinical site can begin enrolling patients. This chart supports clinical operations managers in monitoring this critical path by comparing original baseline projections against current plans and actual completions. By analyzing the gaps between the blue "Actual Finish Date" line and the magenta "Planned Finish Date" or grey "Baseline Finish Date" lines, users can identify schedule slippage or acceleration across the study. This visual trend analysis can support resource allocation decisions, help identify systemic bottlenecks in site activation, and assist in forecasting realistic trial start dates. The chart provides a high-level summary of site readiness milestones, which could help study teams maintain oversight of startup timelines and coordinate with country-level managers to address delays.
Source, version, and interpretation limits
The screenshot is sourced from a public Veeva Vault Study Startup demonstration video published in February 2022. The displayed data, including site counts, dates, and specific study identifiers like "AVEG 027," is synthetic and intended solely for illustrative purposes. Because this is a static image, it does not represent real-time system behavior, active database connections, or automated calculations. Actual user interfaces, available fields, and chart configurations may vary depending on the specific Veeva Vault release, organization-specific configurations, and user permissions. This reference does not imply validation status or regulatory compliance for any specific customer implementation.
Authoritative references
Use these primary sources to confirm current product positioning, terminology, and release-specific behavior.
- Veeva Vault Study Startup Homepage(Official Veeva YouTube demo)
- Veeva Study Startup product overview(Official Veeva product page)
- Veeva Study Startup features(Official Veeva resource)