What this eTMF screenshot shows
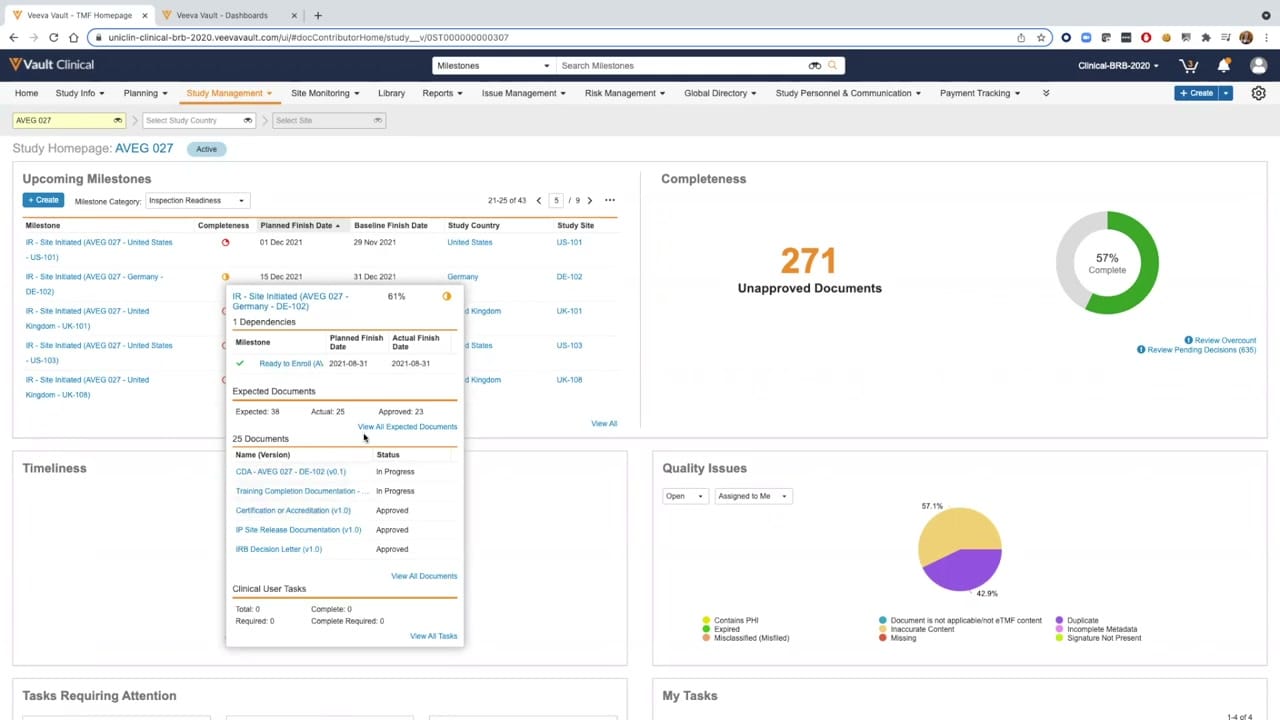
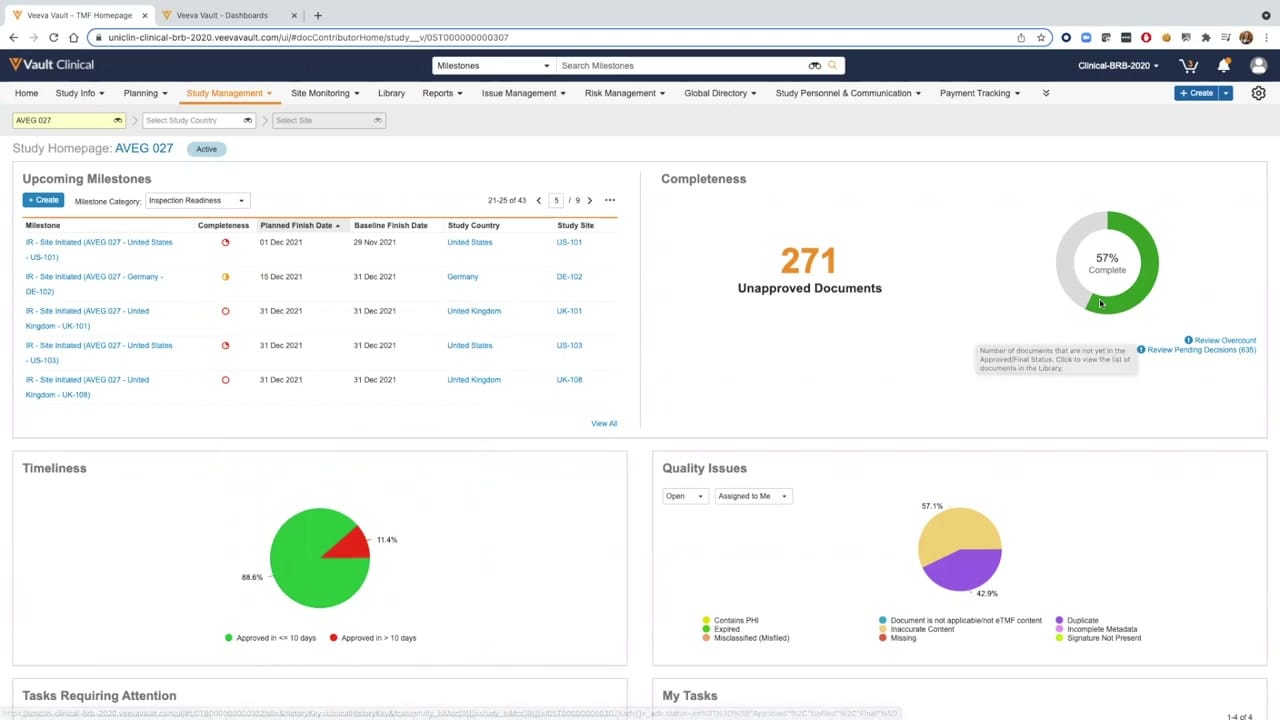
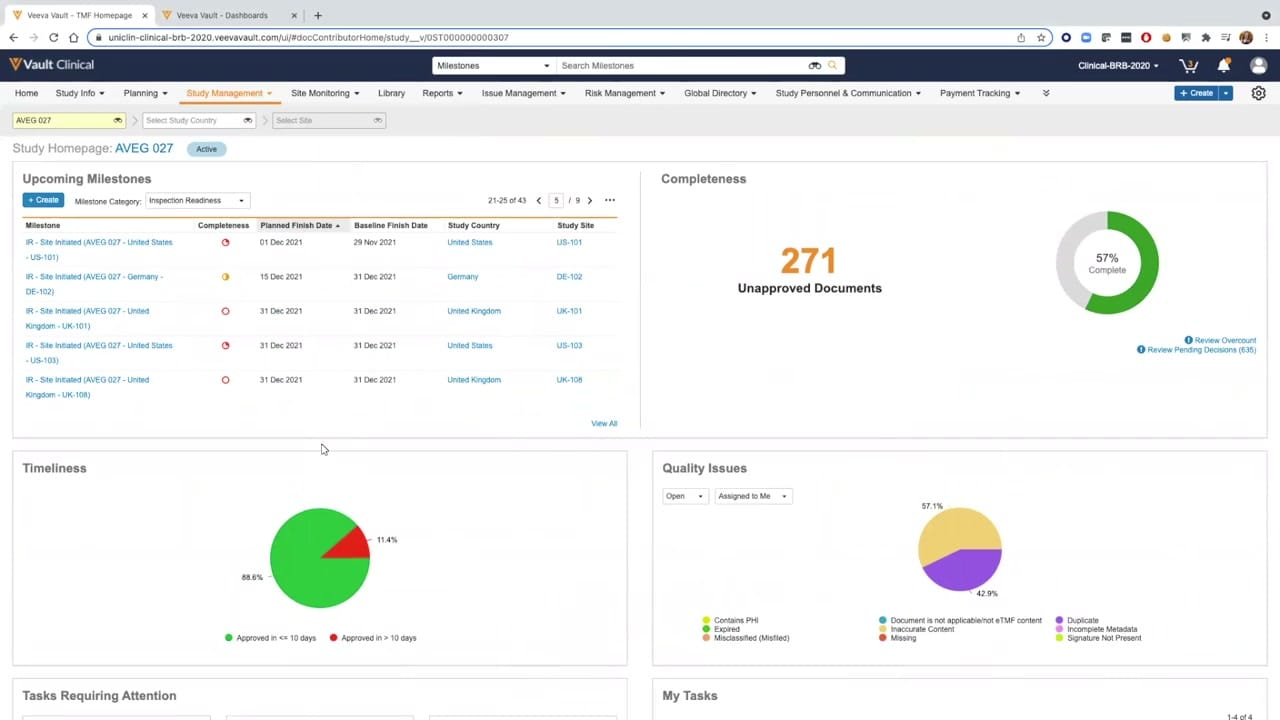
This reference page displays the Study Homepage for study AVEG 027 within the Veeva Vault eTMF application. The interface serves as a centralized dashboard designed to present key metrics related to trial master file completeness, timeliness, and quality issues. The layout is organized into distinct, modular widgets that display synthetic demonstration data, including upcoming milestones, document completeness percentages, and timeliness distributions. Users can navigate through various clinical operations tabs such as Study Management, Site Monitoring, and Reports using the top navigation bar. The dashboard provides a visual overview of document status, helping clinical operations teams monitor the progress of essential trial documentation across different countries and sites associated with the selected study.
Visible interface elements
- Study Homepage header displaying "AVEG 027" with an "Active" status badge.
- Upcoming Milestones widget listing site initiation milestones with planned and baseline finish dates.
- Completeness widget featuring a donut chart showing fifty-seven percent complete and two hundred seventy-one unapproved documents.
- Timeliness widget displaying a pie chart comparing documents approved in ten days or less versus more than ten days.
- Quality Issues widget with a pie chart and dropdown filters for "Open" and "Assigned to Me".
- Top navigation bar with tabs including Study Info, Planning, Study Management, and Site Monitoring.
- Study, Country, and Site dropdown filters located below the main navigation bar.
Interface details
The interface features a multi-widget dashboard layout under the Study Homepage header for the active study AVEG 027. At the top, dropdown filters allow users to filter the displayed data by study country and site. The Upcoming Milestones widget lists specific milestones, such as site initiation events, alongside completeness status indicators, planned and baseline finish dates, and geographic details. To the right, the Completeness widget displays a donut chart indicating fifty-seven percent completeness and highlights two hundred seventy-one unapproved documents, with links to review overcounts and pending decisions. Below these, the Timeliness widget contains a pie chart illustrating the percentage of documents approved within ten days versus those taking longer. Adjacent to it, the Quality Issues widget displays a pie chart categorized by issue types, such as missing signatures or duplicate documents, with dropdown filters for open items assigned to the current user. The bottom of the screen reveals headers for Tasks Requiring Attention and My Tasks, indicating further actionable lists.
Workflow context
In a clinical operations workflow, this homepage dashboard can support study managers in tracking trial master file health and inspection readiness. By presenting aggregated metrics on document completeness and timeliness, the interface could help users identify potential bottlenecks in document collection or approval processes. For instance, the upcoming milestones list allows coordinators to see which site-level documents are pending as key dates approach. The quality issues chart can assist teams in prioritizing remediation efforts by highlighting common document errors, such as missing signatures or incorrect classifications. Additionally, the direct links to pending decisions and unapproved documents can streamline daily tasks by directing users to specific items requiring action. This centralized view could ultimately help study teams maintain oversight of documentation progress across multiple global sites.
Source, version, and interpretation limits
The screenshot is sourced from an official Veeva hosted demo titled Vault eTMF Demo: Part 2, TMF Completeness, dating from approximately 2020. Because this represents a static image of a demonstration environment, the displayed metrics, document counts, and milestone statuses are synthetic and do not represent actual clinical trial data. Furthermore, the user interface, available widgets, and specific metadata fields reflect a historical software release and a specific customer configuration. Actual implementations of Veeva Vault eTMF may vary significantly in appearance, terminology, and available features depending on the software version, active modules, and organization-specific configurations.
Authoritative references
Use these primary sources to confirm current product positioning, terminology, and release-specific behavior.
- Vault eTMF Demo: Part 2, TMF Completeness(Official Veeva hosted demo)
- Veeva eTMF product overview(Official Veeva product page)
- Veeva guide to eTMF features and inspection readiness(Official Veeva resource)