What this eTMF screenshot shows
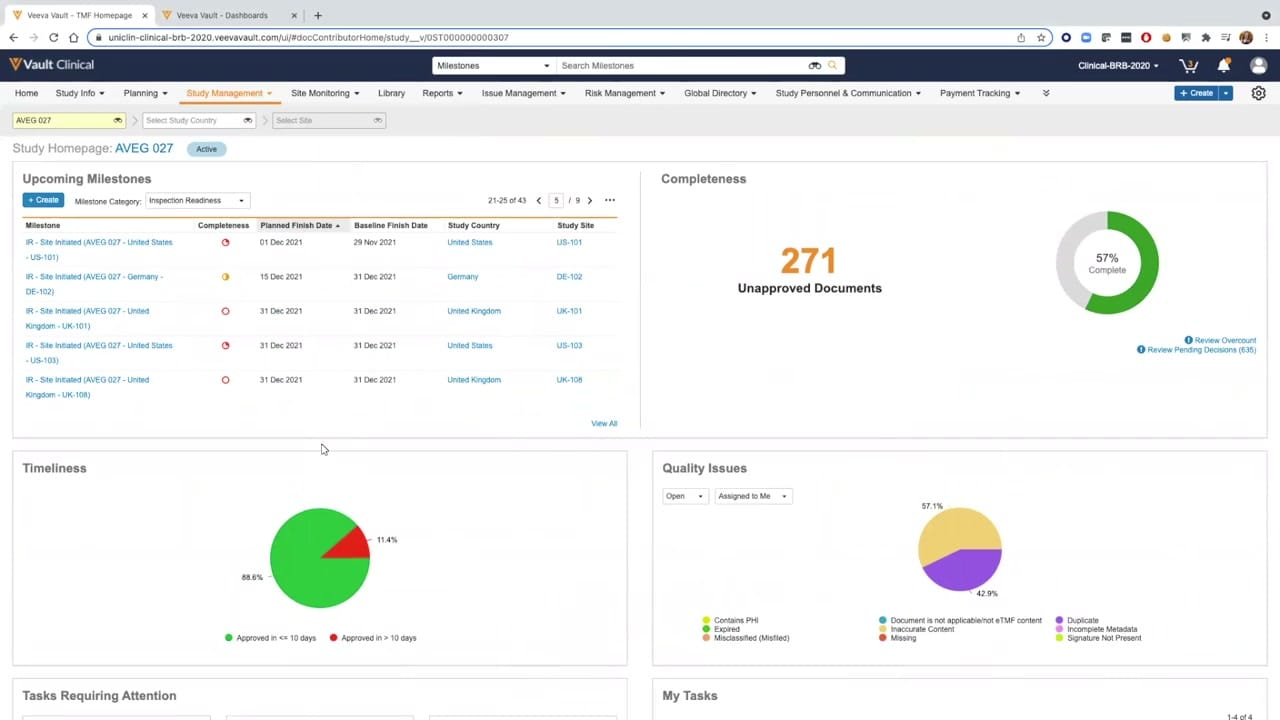
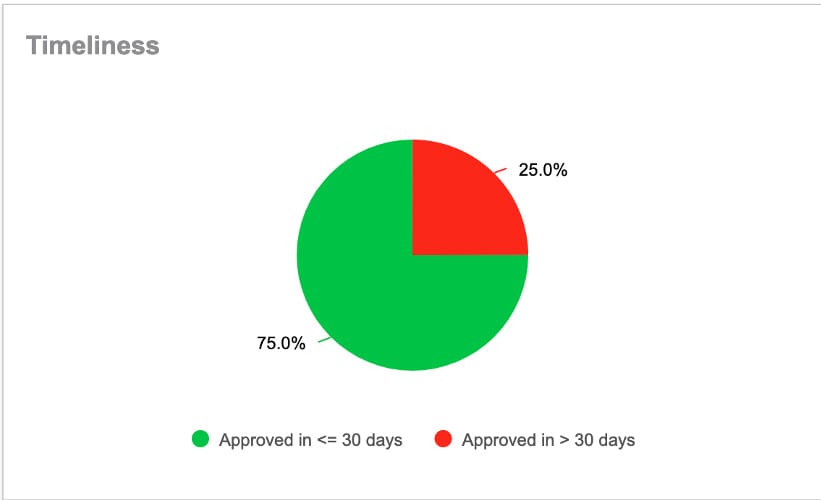
This interface fragment displays the Timeliness metric widget from Veeva Vault eTMF, which is designed to help clinical operations teams monitor document processing times. The widget presents a clean, high-level visual summary of document approval durations, categorizing records based on whether they were approved within a thirty-day threshold. By providing a simple pie chart visualization, the component offers an immediate overview of document filing efficiency across a clinical trial. This specific visualization is typically utilized on the TMF Homepage to give study managers a quick reference point regarding document turnaround times. The clean presentation helps users identify potential bottlenecks in document workflows without needing to run complex, multi-step reports immediately. It serves as an entry point for deeper analysis of trial master file health.
Visible interface elements
- "Timeliness" section header in grey text
- Two-segment pie chart displaying green and red sections
- "75.0%" text label with a green pointer line
- "25.0%" text label with a red pointer line
- Color-coded legend with green and red circular indicators
- "Approved in <= 30 days" legend label
- "Approved in > 30 days" legend label
Interface details
The interface consists of a minimalist card-style widget titled "Timeliness" in a bold, grey sans-serif font at the top left. The central element is a two-segment pie chart that visually represents the proportion of documents meeting specific approval timelines. The larger segment of the pie chart is colored green, representing 75.0% of the dataset, with a thin green pointer line connecting the segment to its text label. The smaller segment is colored red, representing 25.0% of the dataset, similarly connected by a thin red pointer line to its text label. Below the pie chart, a horizontal legend aligns the color-coded categories with their corresponding definitions. A green circular icon precedes the label "Approved in <= 30 days", while a red circular icon precedes the label "Approved in > 30 days". The entire widget is set against a plain white background, emphasizing readability and visual clarity. The layout avoids unnecessary clutter, focusing the user's attention entirely on the two key performance categories.
Workflow context
In the context of clinical trial management, this timeliness widget can support study managers and document specialists in evaluating the efficiency of their document review cycles. By displaying the percentage of documents approved within thirty days versus those taking longer, the chart could help teams identify when document backlogs are beginning to form. This visual cue can prompt users to investigate specific document types or study sites that may be experiencing delays. While the static chart does not directly resolve process bottlenecks, it serves as a diagnostic indicator that can guide resource allocation and process adjustments. Clinical operations personnel can use these insights to prioritize outstanding tasks, potentially helping to maintain inspection readiness by addressing delayed approvals before they impact overall study timelines.
Source, version, and interpretation limits
This image is a fragment of a user interface widget sourced from the TMF Homepage feature brief, an official Veeva PDF originally published in 2021 with subsequent copyright updates. Because this is a static screenshot of a configured demonstration environment, the displayed percentages and thresholds represent synthetic data and do not reflect actual clinical trial performance or real-time metrics. Additionally, the specific labels, color schemes, and time thresholds shown here may vary depending on individual customer configurations, Vault releases, or specific organizational preferences. The static image cannot establish the presence of automated data validation or real-time integration with active clinical trial databases.
Authoritative references
Use these primary sources to confirm current product positioning, terminology, and release-specific behavior.
- TMF Homepage feature brief(Official Veeva PDF)
- Veeva eTMF product overview(Official Veeva product page)
- Veeva guide to eTMF features and inspection readiness(Official Veeva resource)