What this eTMF screenshot shows
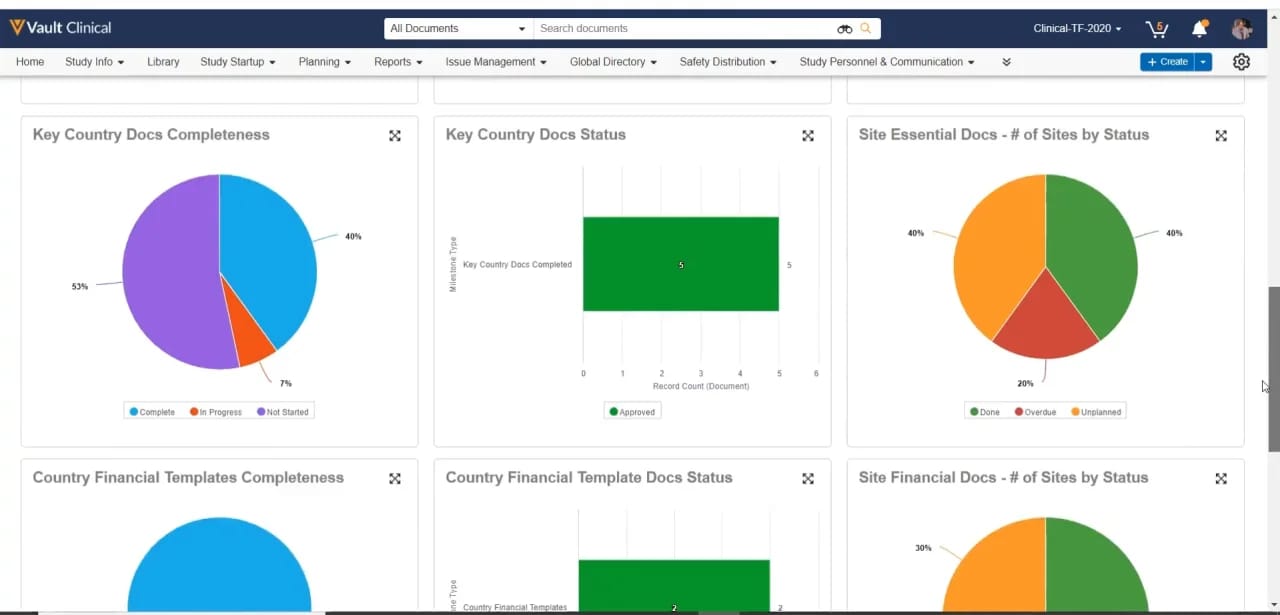
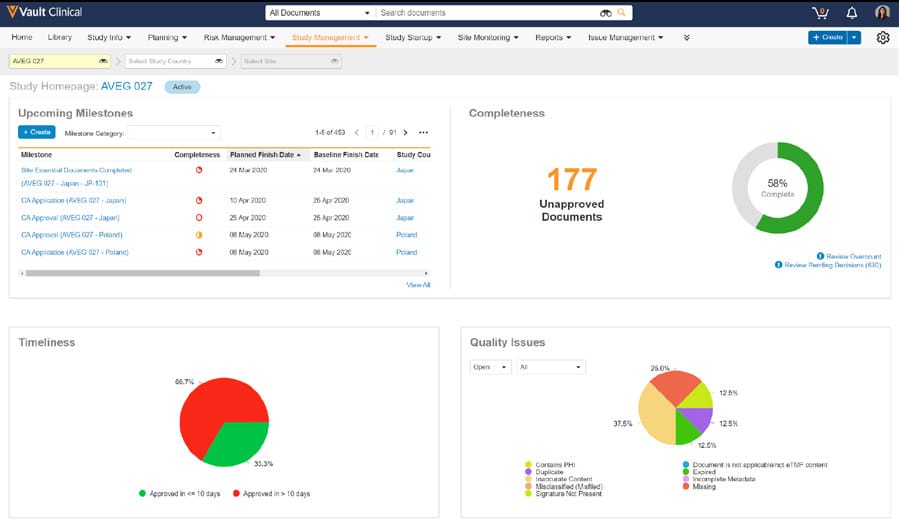
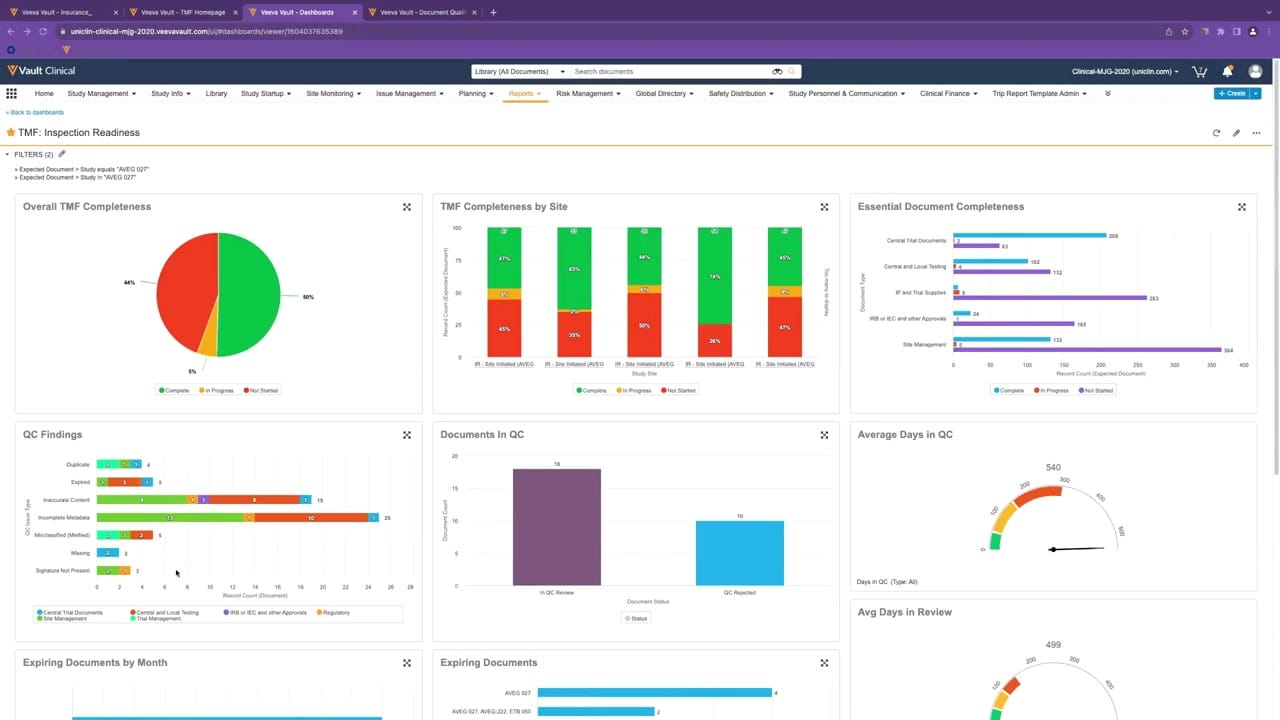
This public interface reference displays a configured Veeva Vault Clinical dashboard titled "TMF: Inspection Readiness" within the Reports tab. The dashboard presents a consolidated view of trial master file metrics, focusing on document completeness and quality control findings. It utilizes synthetic demonstration data from a study labeled "AVEG 027" to illustrate how clinical operations teams can monitor document statuses. The layout features multiple visual components, including pie charts, stacked bar charts, and gauge indicators, to organize complex document metadata. By aggregating metrics such as completeness percentages, quality control issues, and processing times, the interface provides a centralized location for reviewing study documentation progress. This visual summary helps users track outstanding items and identify potential bottlenecks in the document collection and review pipeline without navigating through individual document folders.
Visible interface elements
- TMF: Inspection Readiness dashboard title with two active filters for study AVEG 027.
- Overall TMF Completeness pie chart showing percentages for Complete, In Progress, and Not Started statuses.
- TMF Completeness by Site stacked bar chart displaying percentage breakdowns across multiple sites.
- QC Findings horizontal stacked bar chart categorizing issue types such as Incomplete Metadata and Inaccurate Content.
- Documents in QC vertical bar chart showing counts for In QC Review and QC Rejected.
- Average Days in QC gauge chart displaying a numeric value of 540 days.
- Veeva Vault Clinical navigation header with tabs including Reports, Study Management, and Site Monitoring.
Interface details
The interface is structured with a standard Veeva Vault Clinical header, featuring a global search bar and a primary navigation menu with tabs such as Study Management, Site Monitoring, and Reports. Below the navigation, the "TMF: Inspection Readiness" dashboard displays two active filters restricting the data to study "AVEG 027". The main body of the page is organized into a multi-column grid of data visualizations. The top row includes a pie chart for "Overall TMF Completeness" showing percentages for Complete, In Progress, and Not Started statuses, alongside a stacked bar chart for "TMF Completeness by Site" and a horizontal bar chart for "Essential Document Completeness". The middle row contains a detailed "QC Findings" horizontal stacked bar chart categorized by issue types like Incomplete Metadata and Inaccurate Content, a "Documents in QC" vertical bar chart showing counts for review and rejection states, and an "Average Days in QC" gauge chart. The bottom row displays partial views of expiring document charts and an "Avg Days in Review" gauge. Each chart component includes interactive legends and individual expand controls.
Workflow context
In a clinical operations workflow, this dashboard can support study managers and trial master file specialists in evaluating inspection readiness. The visual breakdown of completeness by site and document type could help users identify specific sites or document categories that require immediate attention or follow-up. For instance, the "QC Findings" chart categorizes common errors, such as incomplete metadata or missing signatures, which can help teams target training or process improvements. Additionally, metrics like "Average Days in QC" and "Avg Days in Review" could assist in monitoring the efficiency of the document review lifecycle. By presenting these metrics in a single view, the interface can support proactive quality management and help prepare for regulatory audits. This centralized monitoring setup allows coordinators to identify lagging areas and allocate resources to resolve outstanding quality control issues before they impact study timelines.
Source, version, and interpretation limits
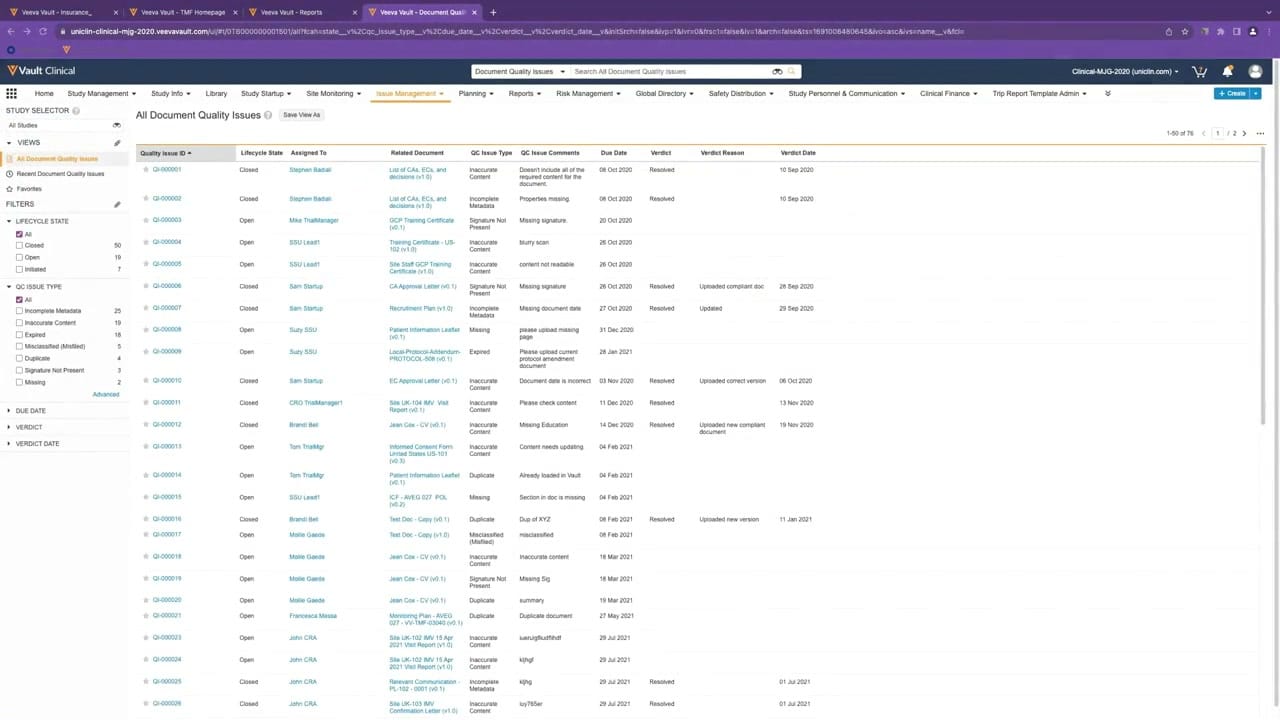
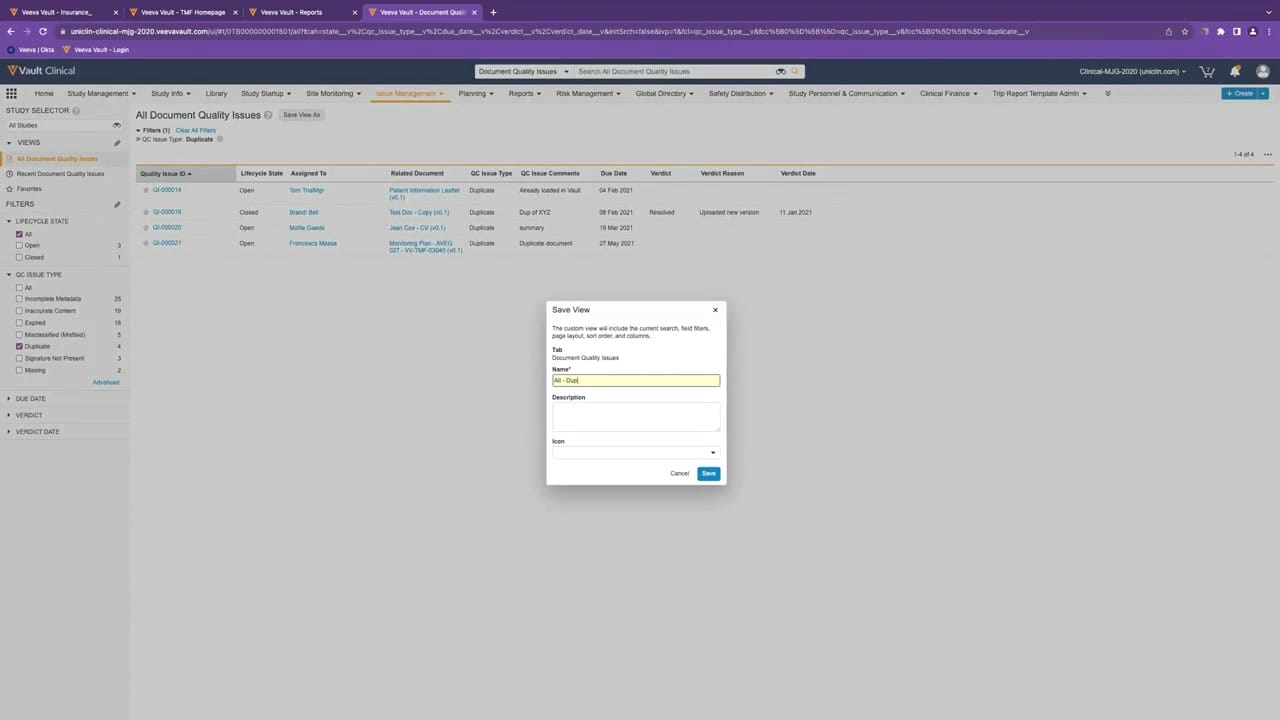
The source of this image is an official Veeva hosted demo titled "Track, Manage, and Report on Quality Issues," published around 2023. The screenshot depicts a configured demo environment containing synthetic demonstration data, meaning the specific charts, labels, and metrics shown do not represent actual clinical trial results or active regulatory submissions. Because this is a static screenshot, it cannot establish that the displayed metrics are updated in real time, automated, or validated. Additionally, the visible layout, color schemes, and available dashboard components may vary depending on individual customer configurations, specific Vault releases, and user permissions within a live Veeva Vault eTMF environment.
Authoritative references
Use these primary sources to confirm current product positioning, terminology, and release-specific behavior.
- Track, Manage, and Report on Quality Issues(Official Veeva hosted demo)
- Veeva eTMF product overview(Official Veeva product page)
- Veeva guide to eTMF features and inspection readiness(Official Veeva resource)