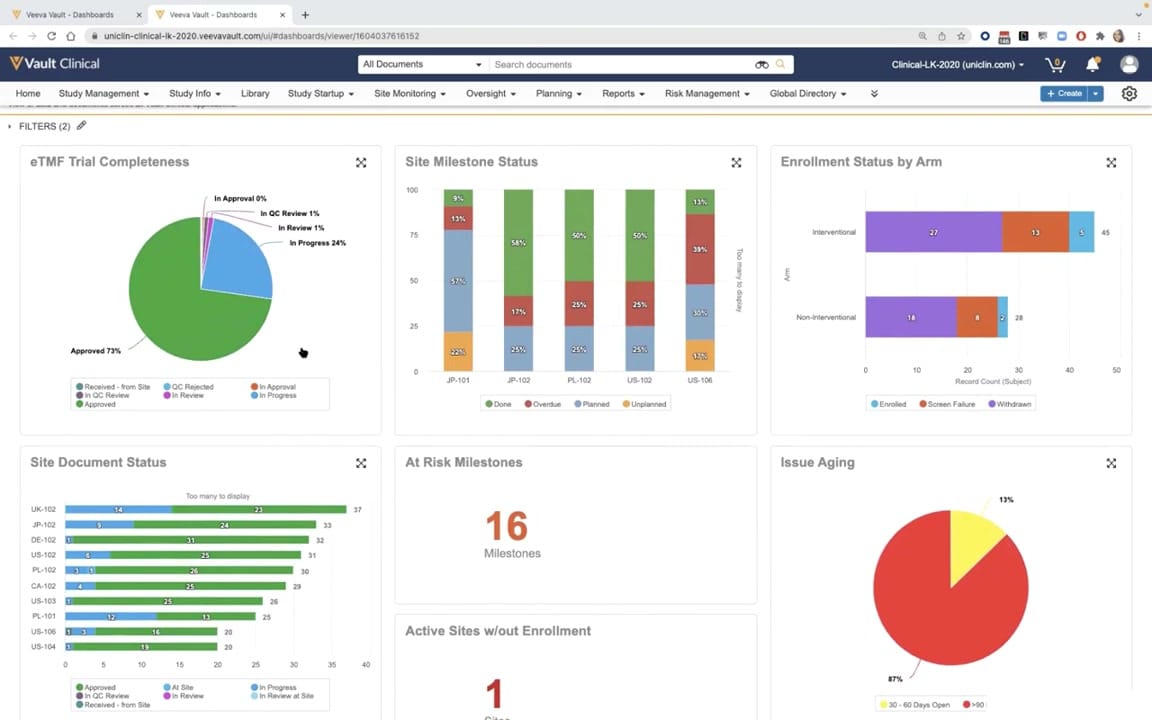
What this CTMS screenshot shows
This interface displays a comprehensive dashboard within Veeva Vault Clinical, specifically highlighting trial management and document completeness metrics. The layout presents multiple data visualization widgets organized in a grid format, designed to give clinical operations teams a consolidated view of study progress. Key metrics visible include trial completeness, milestone statuses, enrollment figures, and document tracking across various clinical sites. By bringing together document-level status and operational milestones, this dashboard provides a centralized location for monitoring study health. The interface features standard navigation tabs at the top, such as Study Management, Site Monitoring, and Oversight, allowing users to navigate between different functional areas of the clinical trial management system. The displayed data represents a synthetic demonstration environment, illustrating how trial metrics can be structured and visualized.
Visible interface elements
- eTMF Trial Completeness pie chart showing document approval percentages.
- Site Milestone Status stacked bar chart displaying done, overdue, planned, and unplanned milestones.
- Enrollment Status by Arm horizontal bar chart showing subject counts for interventional and non-interventional arms.
- Site Document Status horizontal bar chart tracking document stages across multiple site codes.
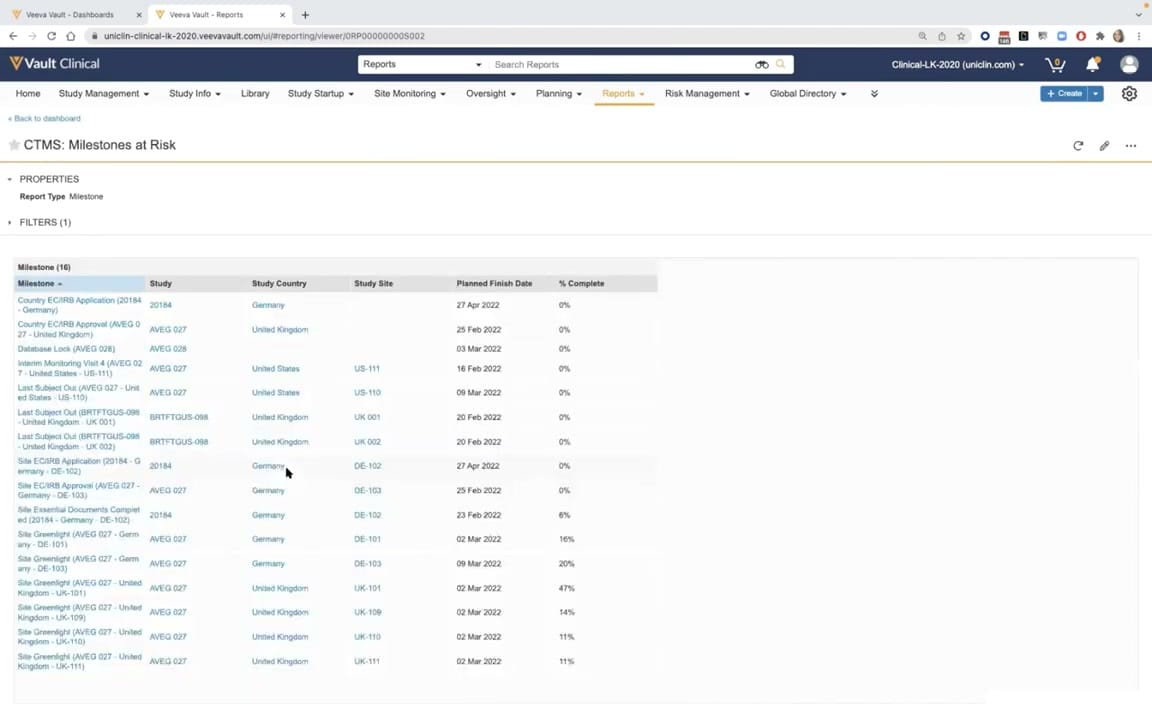
- At Risk Milestones widget displaying a count of sixteen milestones.
- Issue Aging pie chart showing the percentage of issues open for different durations.
- Global navigation bar with tabs including Study Management, Site Monitoring, and Oversight.
Interface details
The dashboard interface is structured into a multi-column grid containing six distinct visualization widgets. In the top-left, the "eTMF Trial Completeness" pie chart displays document status percentages, such as seventy-three percent approved and twenty-four percent in progress. Next to it, the "Site Milestone Status" stacked bar chart tracks progress across specific site codes like JP-101 and US-102, categorizing milestones as done, overdue, planned, or unplanned. The "Enrollment Status by Arm" horizontal bar chart breaks down subject counts into enrolled, screen failure, and withdrawn categories for interventional and non-interventional arms. Below these, the "Site Document Status" horizontal bar chart details document counts across multiple sites, while the "Issue Aging" pie chart tracks open issues by duration. Two numerical callout widgets display "At Risk Milestones" and "Active Sites w/out Enrollment" with bold, colored text. A global navigation bar at the top provides access to menus like Study Info, Site Monitoring, and Reports. A filter bar is visible just below the navigation, indicating that two active filters are currently applied to the displayed dashboard view.
Workflow context
In a clinical operations workflow, this dashboard can support study managers in identifying potential bottlenecks and tracking overall trial progress. For instance, the "eTMF Trial Completeness" and "Site Document Status" widgets could help users identify which sites are lagging in document submission or quality control reviews. The "Site Milestone Status" and "At Risk Milestones" widgets can support proactive risk management by highlighting overdue or pending milestones that might impact study timelines. Additionally, tracking "Issue Aging" could help clinical trial managers prioritize long-standing issues that require immediate resolution. By surfacing these metrics in a single view, the interface can support more informed decision-making and streamline communication between study monitors and site coordinators. This consolidated presentation of trial management and document metadata could help clinical teams maintain oversight without needing to navigate between separate, disconnected tracking systems.
Source, version, and interpretation limits
The screenshot is sourced from the Veeva YouTube video titled "CTMS Oversight Deep Dive Demo," published in March 2022. Because this is a static image of a demonstration tenant, it does not represent real-time, live, or validated clinical trial data. All names, site codes, milestone counts, and document statuses are synthetic demonstration data used for illustrative purposes. Actual user interfaces, available widgets, and specific data configurations may vary depending on the organization's specific Veeva Vault release, custom configurations, and user permissions. The presence of browser chrome and specific URL structures reflects the demo environment at the time of recording.
Authoritative references
Use these primary sources to confirm current product positioning, terminology, and release-specific behavior.
- CTMS Oversight Deep Dive Demo(Official Veeva YouTube demo)
- Veeva CTMS product overview(Official Veeva product page)
- Veeva CTMS trial-management overview(Official Veeva resource)