What this CTMS screenshot shows
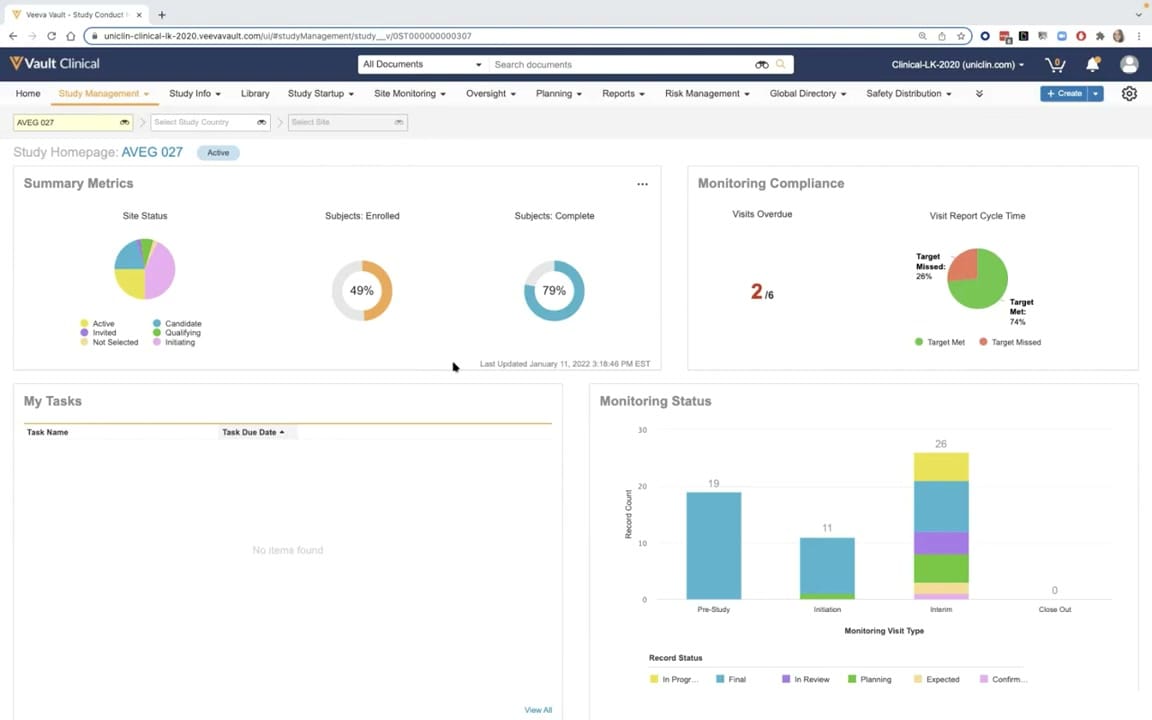
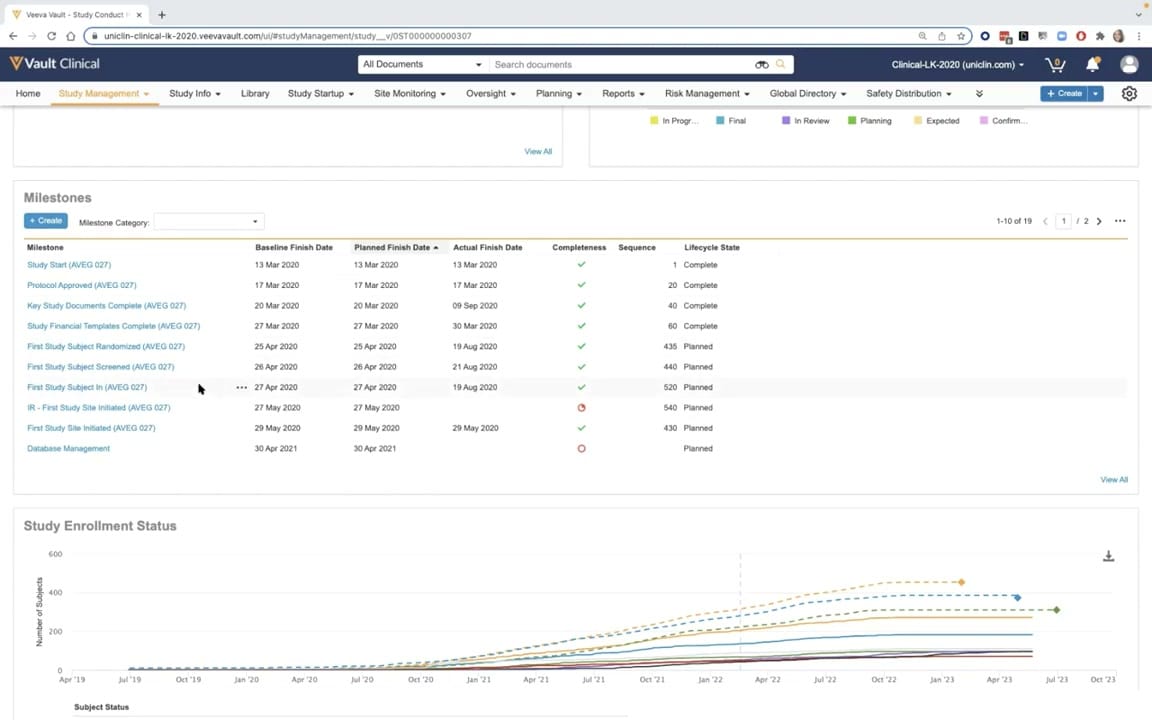
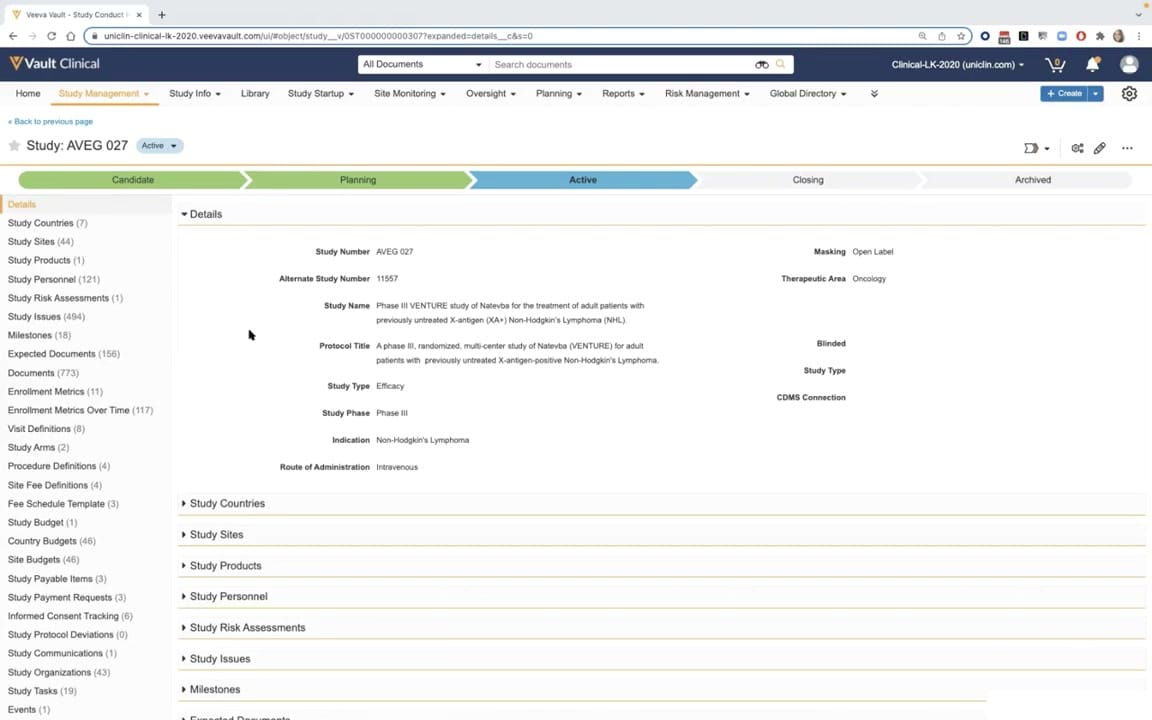
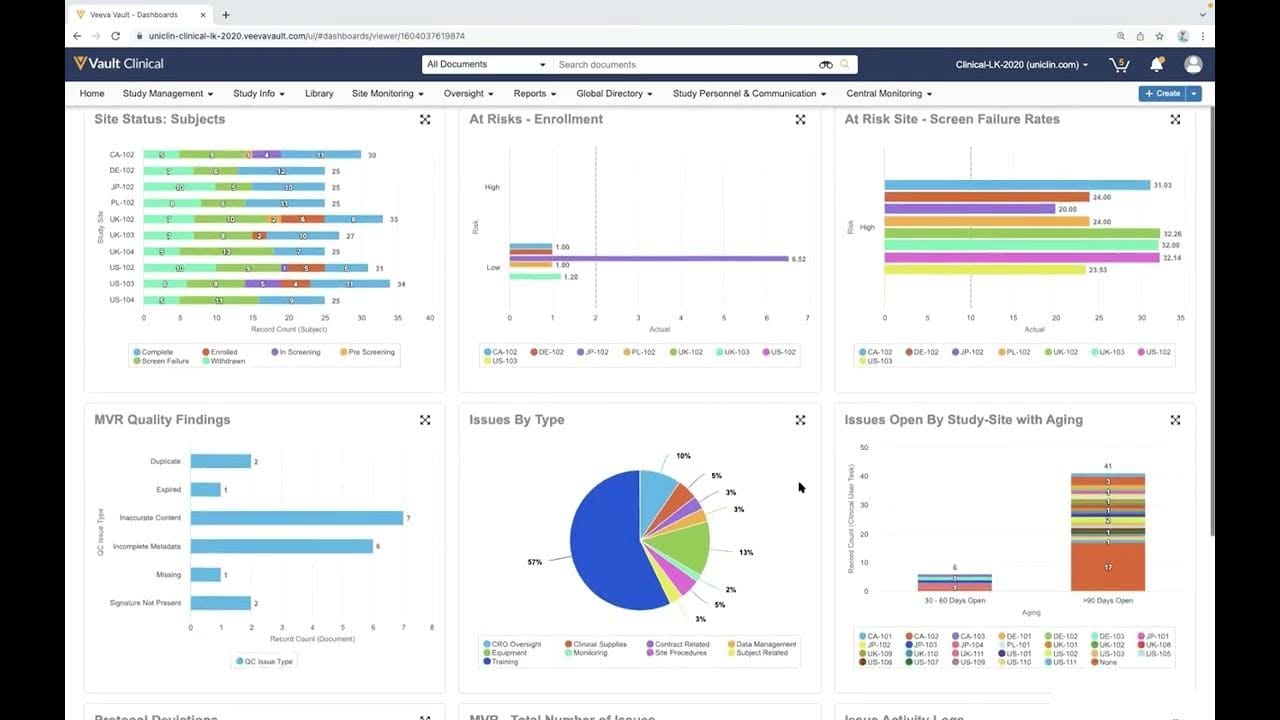
This public interface reference displays a comprehensive study metrics and issue analysis dashboard within Veeva Vault Clinical. The interface presents a multi-panel grid layout designed to aggregate and visualize key performance indicators and operational metrics across clinical trial sites. Visible panels include subject enrollment status, risk-related enrollment metrics, screen failure rates, monitoring visit report (MVR) quality findings, issue distribution by type, and open issues categorized by study-site aging. By organizing these diverse data points into a single, unified view, the dashboard provides clinical operations teams with a structured overview of study progress and potential operational bottlenecks. The synthetic demonstration data shown across the charts illustrates how study managers can track site-level performance, monitor quality findings, and identify outstanding tasks requiring attention, supporting overall trial oversight and quality management workflows.
Visible interface elements
- Site Status: Subjects stacked horizontal bar chart displaying subject counts across multiple study sites.
- At Risk Site - Screen Failure Rates horizontal bar chart showing percentage values for high-risk sites.
- MVR Quality Findings horizontal bar chart detailing record counts for specific QC issue types like incomplete metadata.
- Issues By Type pie chart illustrating percentage breakdown of categories such as CRO Oversight and Site Procedures.
- Issues Open By Study-Site with Aging stacked vertical bar chart categorizing clinical user tasks by duration.
- Vault Clinical top navigation bar containing tabs for Study Management, Site Monitoring, Oversight, and Reports.
- Global search bar and a blue '+ Create' button located in the upper right portion of the header.
Interface details
The user interface features a clean, grid-based dashboard layout under the Vault Clinical header. The top navigation bar includes standard clinical operations tabs such as Study Management, Site Monitoring, Oversight, and Reports, alongside a global search bar and a "+ Create" action button. Below the navigation, the dashboard displays six distinct visualization panels arranged in a three-column, two-row grid. The top row contains three horizontal bar charts: "Site Status: Subjects," which uses color-coded stacked bars to represent subject stages; "At Risks - Enrollment," comparing risk levels to actual enrollment; and "At Risk Site - Screen Failure Rates," displaying percentage rates by site. The bottom row features "MVR Quality Findings," a horizontal bar chart detailing document-level QC issue types; "Issues By Type," a multi-colored pie chart illustrating percentage distributions of operational categories; and "Issues Open By Study-Site with Aging," a stacked vertical bar chart tracking unresolved clinical user tasks across specific timeframes. Each panel includes interactive legends, axis labels, and individual expand icons in the top-right corners to facilitate detailed data inspection.
Workflow context
In a clinical trial management context, this dashboard can support clinical operations users in monitoring study health and site performance. For instance, the "Site Status: Subjects" and "At Risk Site - Screen Failure Rates" charts could help study managers identify sites experiencing enrollment difficulties or unusually high screen failure rates. The "MVR Quality Findings" and "Issues By Type" visualizations can assist quality managers in pinpointing systemic issues, such as recurring incomplete metadata or contract-related challenges, allowing for targeted corrective actions. Additionally, the "Issues Open By Study-Site with Aging" chart could help teams prioritize outstanding clinical user tasks that have been open for more than 90 days. By consolidating these metrics, the interface can support proactive risk mitigation, streamline communication between sponsors and clinical research organizations, and help maintain study timelines without requiring users to navigate through multiple individual records.
Source, version, and interpretation limits
The analyzed image is a static screenshot from the IntuitionLabs public Veeva screenshot catalog, representing a configured Veeva Vault CTMS environment. Because this is a static capture, it does not demonstrate real-time data updates, automated background processing, or active integration with live clinical databases. The visible labels, navigation tabs, chart configurations, and specific data points represent synthetic demonstration data and may vary based on individual customer configurations, system permissions, or specific software releases. This reference copy is intended solely to describe the visible layout and structure of the dashboard interface, and it does not imply any regulatory compliance, validation status, or product endorsement.
Authoritative references
Use these primary sources to confirm current product positioning, terminology, and release-specific behavior.
- IntuitionLabs public Veeva screenshot catalog(Public screenshot catalog)
- Veeva CTMS product overview(Official Veeva product page)
- Veeva CTMS trial-management overview(Official Veeva resource)