What this CTMS screenshot shows
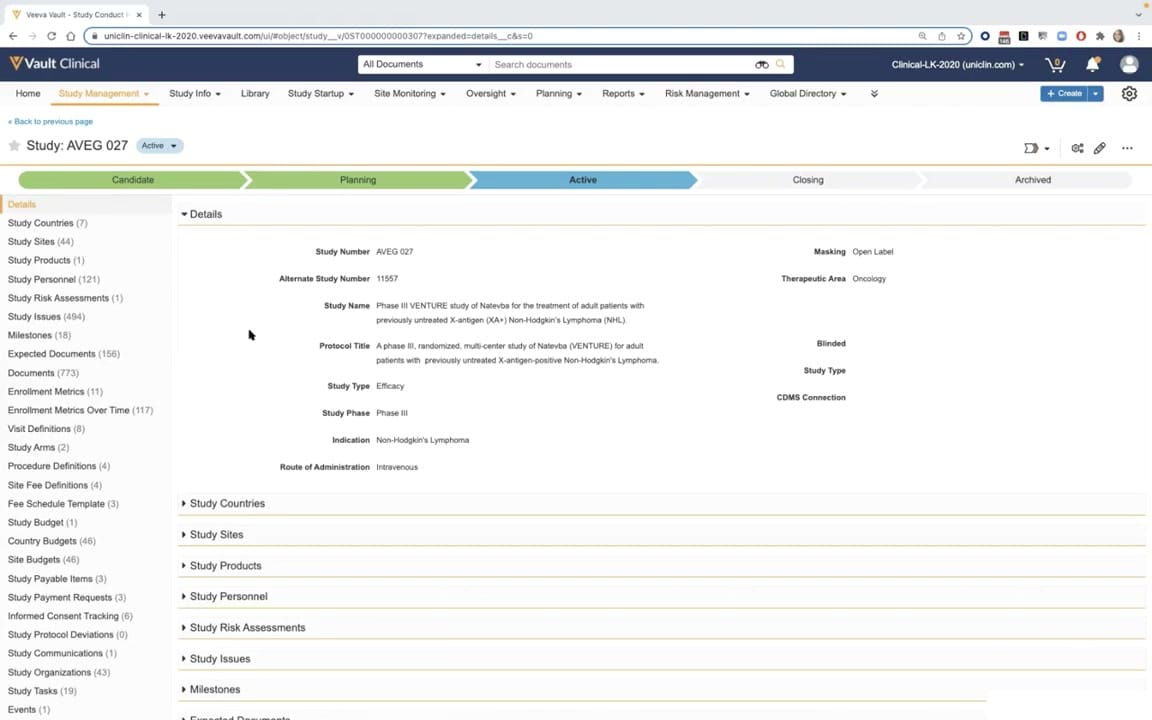
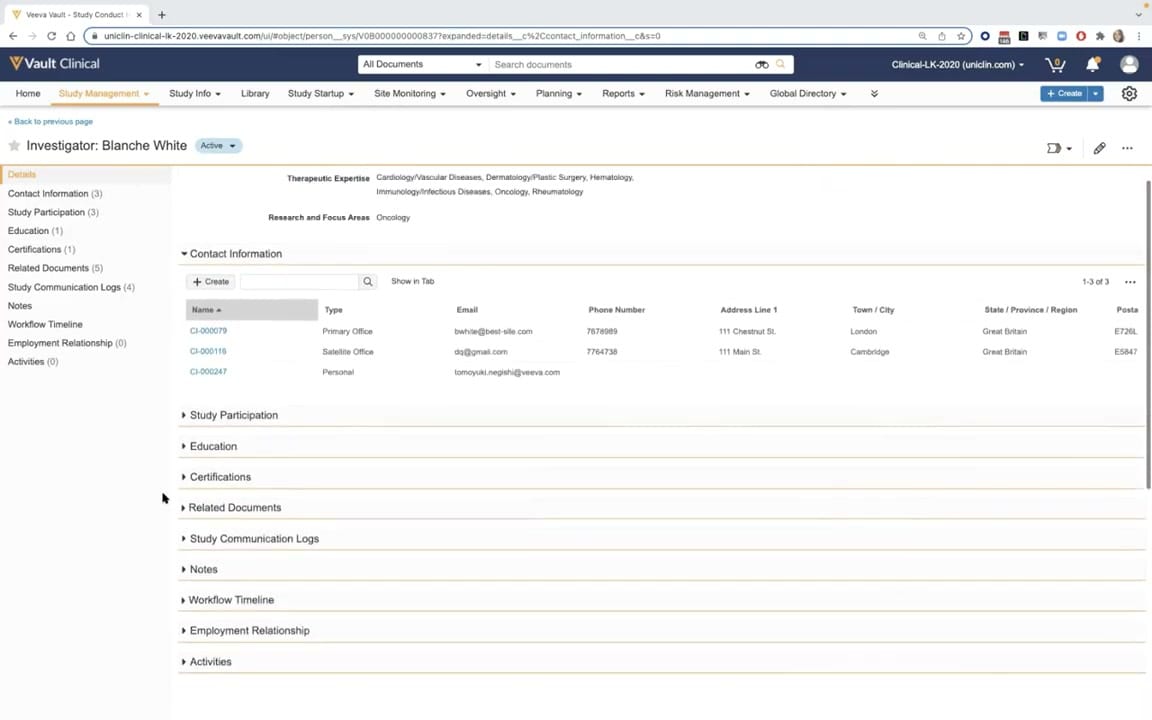
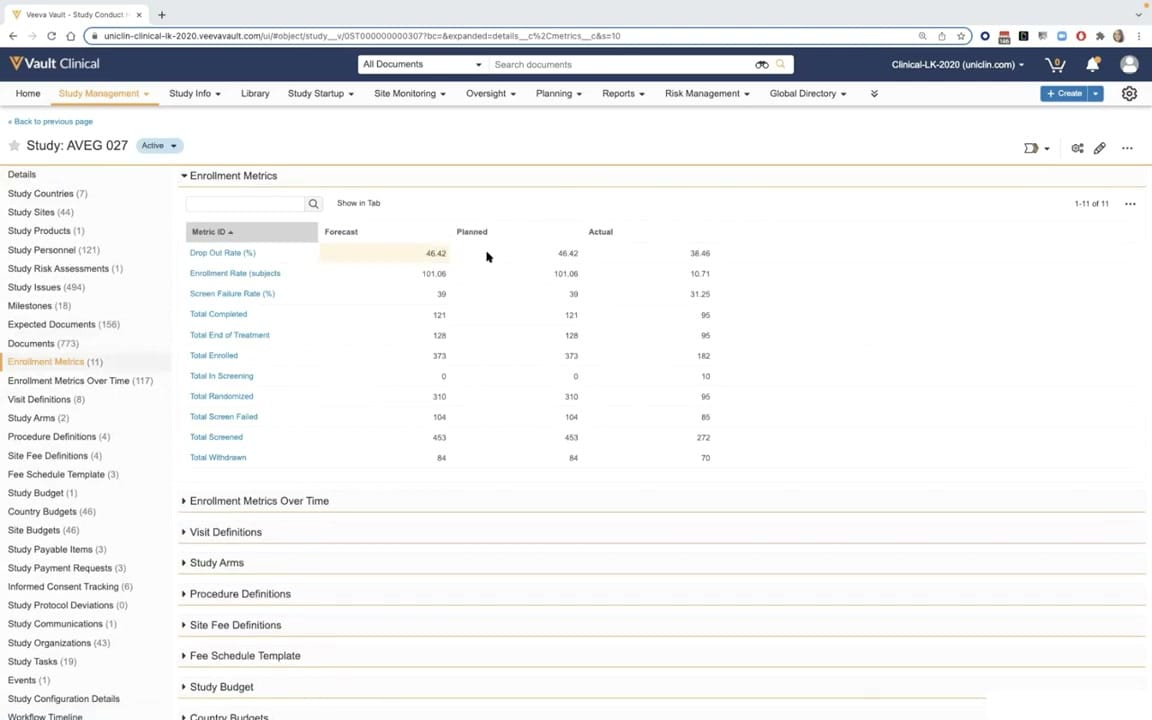
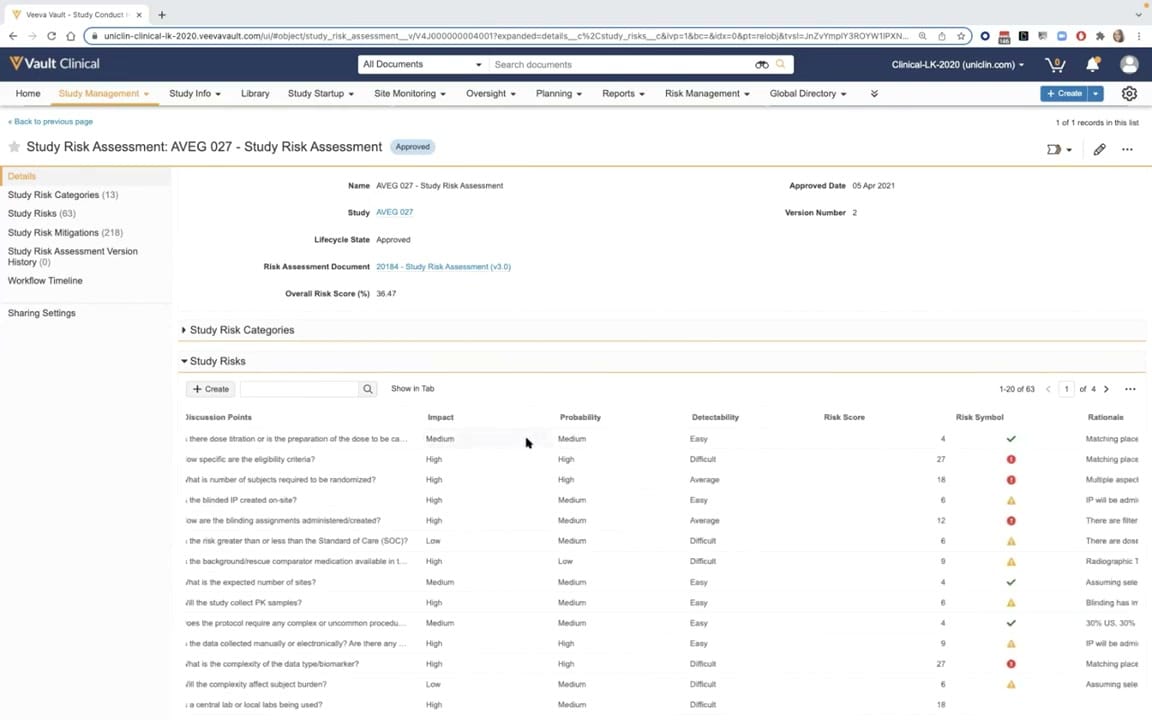
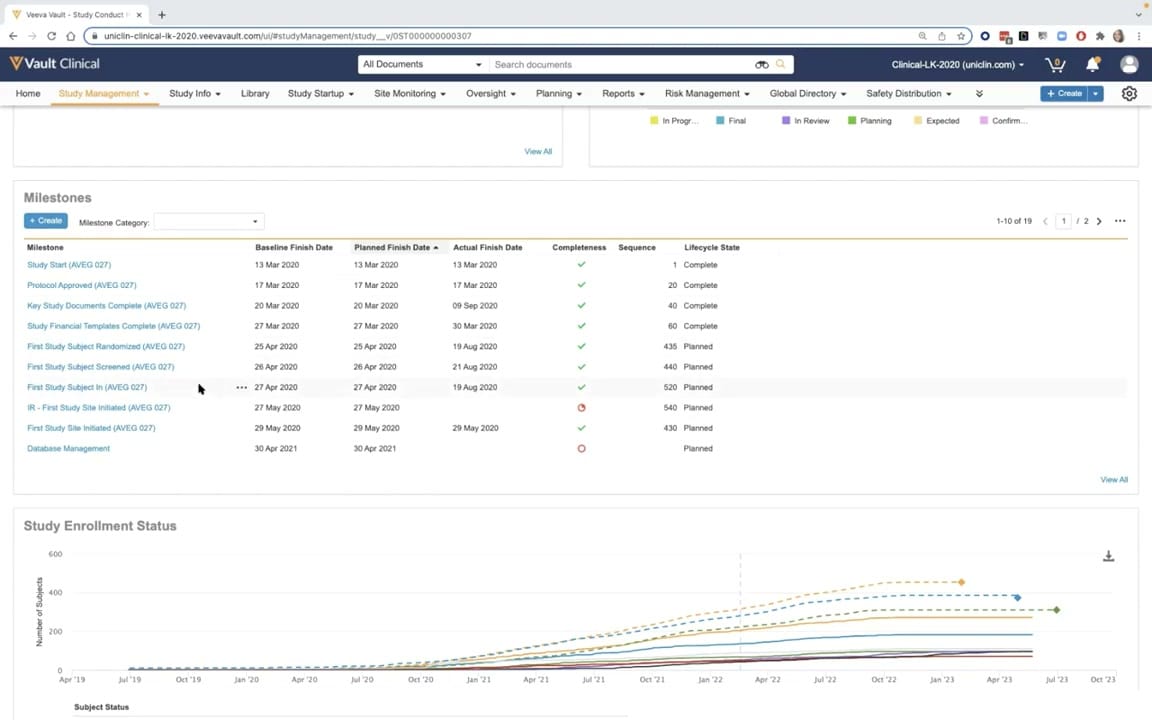
This public interface screenshot displays the Milestones and Enrollment dashboard within Veeva Vault CTMS, configured for clinical trial management. The screen provides clinical operations teams with a centralized view of study progress, tracking key milestones alongside enrollment metrics. The top section features a detailed Milestones table listing critical trial events, such as study start, protocol approval, and subject randomization, complete with baseline, planned, and actual finish dates. Below this table, the Study Enrollment Status panel presents a multi-line trend graph tracking subject counts over a multi-year timeline. This layout enables study managers to monitor operational timelines and enrollment trajectories within a single, unified interface, facilitating proactive oversight of clinical trial progress.
Visible interface elements
- Milestones table displaying baseline, planned, and actual finish dates for study events.
- Study Enrollment Status line graph plotting subject counts over a multi-year timeline.
- Navigation header with tabs including Study Management, Site Monitoring, and Oversight.
- Completeness column in the milestones table featuring green checkmarks and red status icons.
- "+ Create" button and "Milestone Category" dropdown filter above the milestones list.
- Pagination control showing "1-10 of 19" with navigation arrows for the milestones table.
- Download icon located in the top-right corner of the Study Enrollment Status panel.
Interface details
The user interface is structured with a standard Veeva Vault Clinical navigation header, featuring tabs such as Study Info, Site Monitoring, Oversight, and Reports. The primary workspace is divided into two main sections. The Milestones section contains a "+ Create" button, a "Milestone Category" filter dropdown, and a structured data table. This table displays columns for Milestone name, Baseline Finish Date, Planned Finish Date, Actual Finish Date, Completeness status indicators, Sequence number, and Lifecycle State. Visual indicators, including green checkmarks and red circular icons, denote completion status. Below the table, the Study Enrollment Status section features an interactive line chart. The vertical axis measures the number of subjects from zero to 600, while the horizontal axis spans from April 2019 to October 2023. Multiple colored lines represent different subject statuses, with dashed lines extending to project future enrollment trends. A download icon is visible in the top-right corner of the chart panel, and a "View All" link is positioned at the bottom right of the Milestones table.
Workflow context
Within the context of clinical trial management, the Milestones and Enrollment workflow serves as a critical tool for study oversight and operational planning. Clinical operations managers utilize this dashboard to compare actual progress against baseline projections, ensuring that key study milestones remain on schedule. By tracking milestones like "First Study Subject Randomized" and "First Study Site Initiated," teams can identify potential bottlenecks in the study startup phase. Simultaneously, the enrollment status graph allows coordinators to monitor recruitment rates across different subject statuses over time. This integrated view helps teams assess whether enrollment targets are being met or if corrective actions are required to maintain the study timeline. The workflow streamlines communication between sponsors, contract research organizations, and sites by providing a single source of truth for study milestones and subject accrual metrics.
Source, version, and interpretation limits
The screenshot is sourced from an official Veeva YouTube demo titled "CTMS Oversight Deep Dive Demo," published in March 2022. Because this image represents a demo tenant running in a standard web browser, the visible data, labels, and navigation tabs are synthetic and configured for demonstration purposes. Actual user interfaces, available features, and layout configurations may vary depending on the specific Veeva Vault release, customer-specific configurations, and active user permissions. The browser address bar and standard window controls are visible, reflecting the application's web-based delivery model. This reference copy describes only the visible interface elements and does not imply any product performance guarantees.
Authoritative references
Use these primary sources to confirm current product positioning, terminology, and release-specific behavior.
- CTMS Oversight Deep Dive Demo(Official Veeva YouTube demo)
- Veeva CTMS product overview(Official Veeva product page)
- Veeva CTMS trial-management overview(Official Veeva resource)