What this CTMS screenshot shows
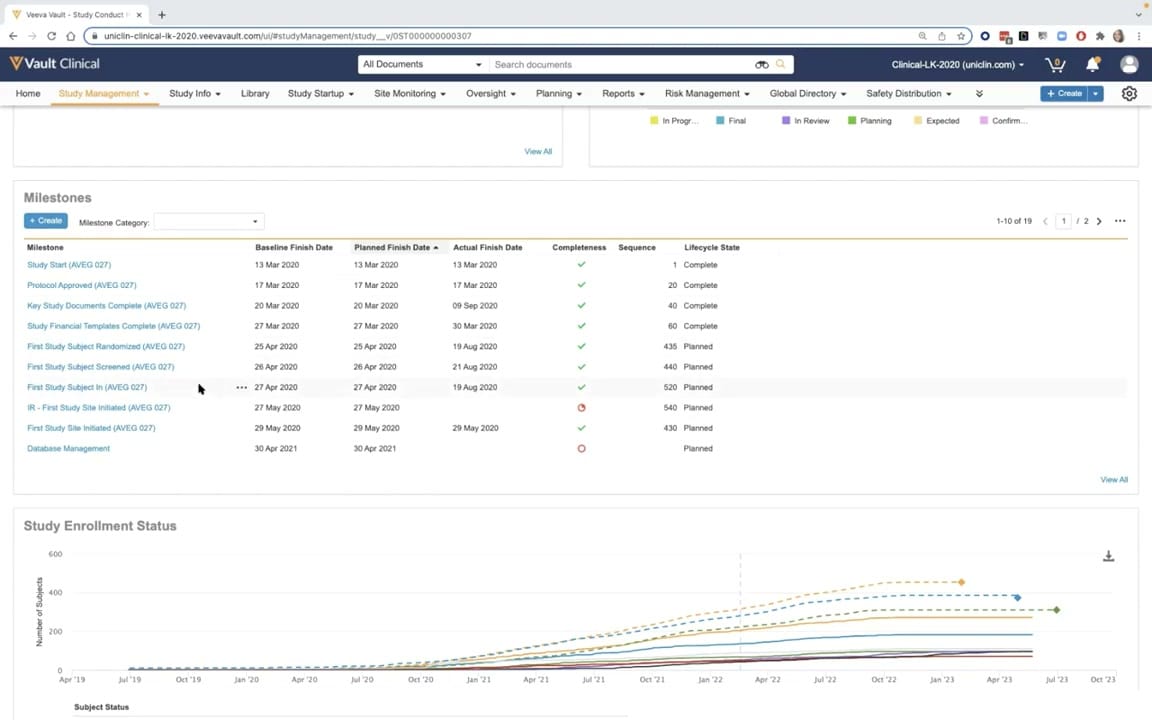
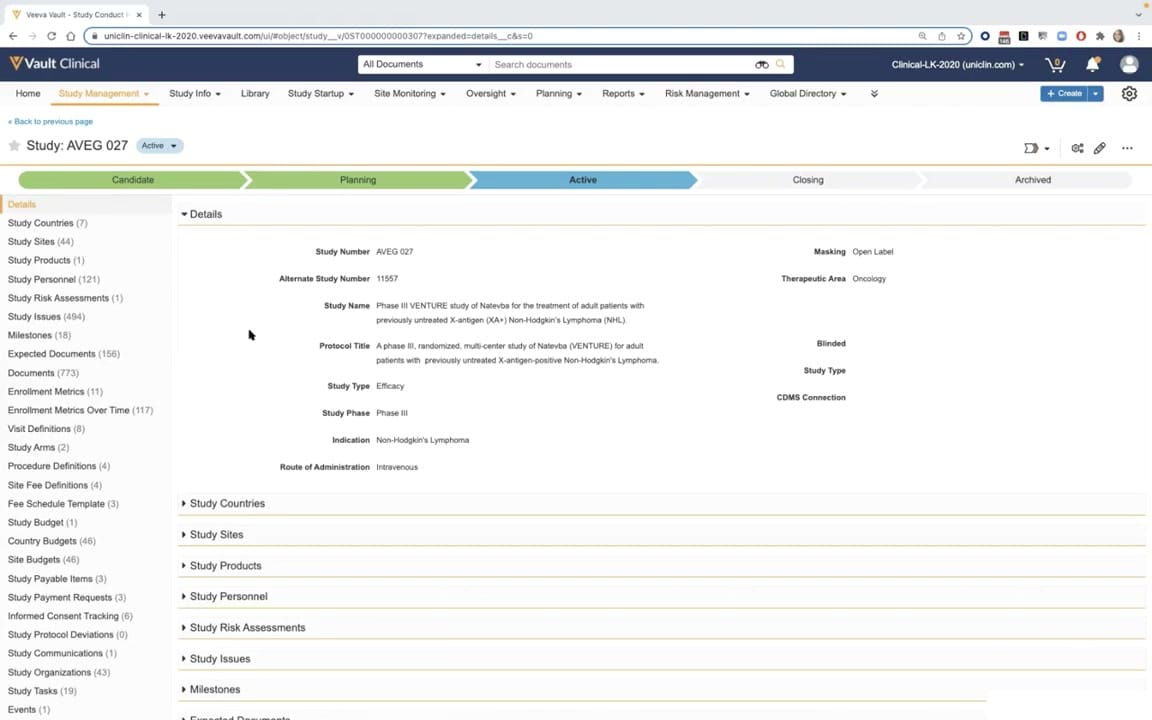
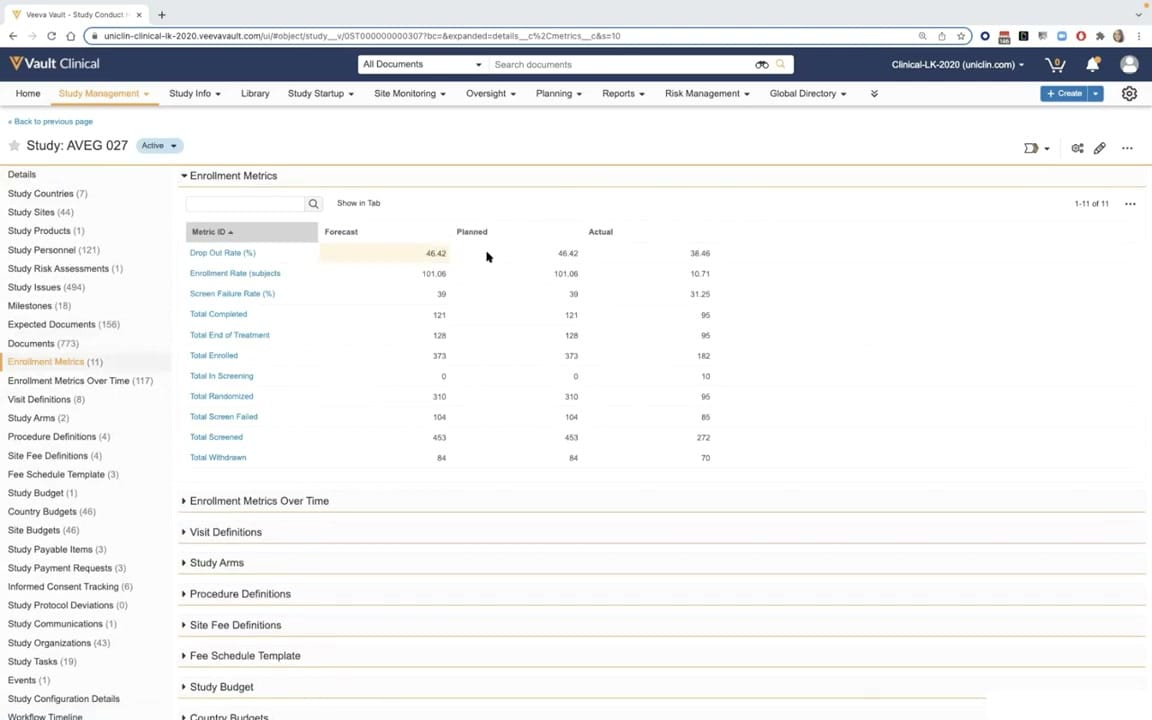
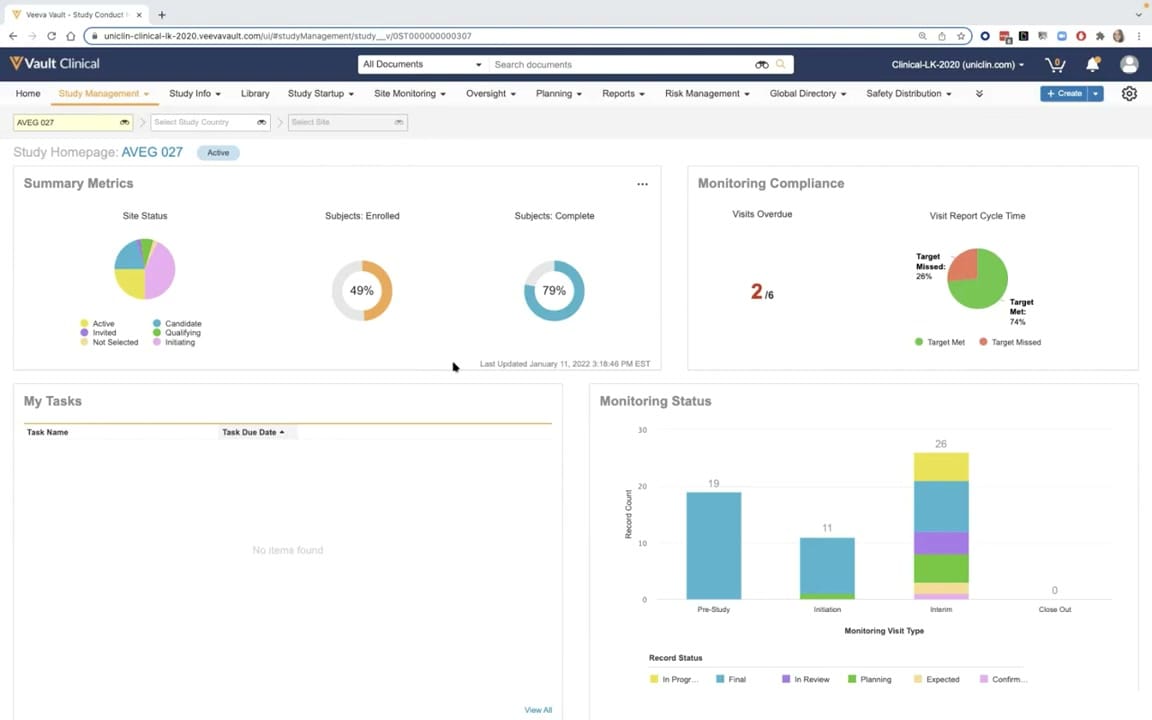
This interface displays the Study Homepage for a clinical trial designated as AVEG 027 within Veeva Vault Clinical. Serving as a centralized dashboard for clinical operations, the screen provides a high-level summary of study progress, compliance metrics, and monitoring activities. The layout is divided into distinct panels that aggregate data on site status, subject enrollment, monitoring compliance, and task assignments. Users can filter the displayed information by study, country, or specific site using the top-level dropdown selectors. The dashboard aims to give study managers and clinical research associates immediate visibility into key performance indicators, such as visit report cycle times and overdue monitoring visits, helping them track operational health and identify potential bottlenecks in the clinical trial lifecycle.
Visible interface elements
- Study Homepage title with the study identifier AVEG 027 and an Active status badge
- Summary Metrics panel featuring a Site Status pie chart and donut charts for subject enrollment and completion
- Monitoring Compliance panel showing a 2/6 Visits Overdue indicator and a Visit Report Cycle Time pie chart
- My Tasks panel displaying a table with columns for Task Name and Task Due Date, currently showing no items
- Monitoring Status stacked bar chart categorizing record counts by monitoring visit types
- Top navigation bar with tabs including Study Management, Site Monitoring, Oversight, and Risk Management
- Dropdown filters for selecting Study, Study Country, and Site at the top of the workspace
Interface details
The user interface features a clean, white-background dashboard structured into four main visualization panels. The top-left panel, titled Summary Metrics, contains a pie chart for Site Status and two donut charts tracking the percentage of enrolled subjects (49 percent) and completed subjects (79 percent). To its right, the Monitoring Compliance panel displays a numerical indicator for overdue visits (2 out of 6) alongside a pie chart illustrating visit report cycle times, showing that 74 percent of targets were met. Below these, the My Tasks panel lists outstanding actions, currently showing no items found. The bottom-right panel, Monitoring Status, presents a stacked bar chart that categorizes monitoring visits by type, including Pre-Study, Initiation, Interim, and Close Out, color-coded by record status such as In Progress, Final, In Review, and Planning. Navigation is facilitated by a top menu bar containing tabs for Study Management, Site Monitoring, Oversight, and Risk Management, allowing users to drill down into specific operational areas.
Workflow context
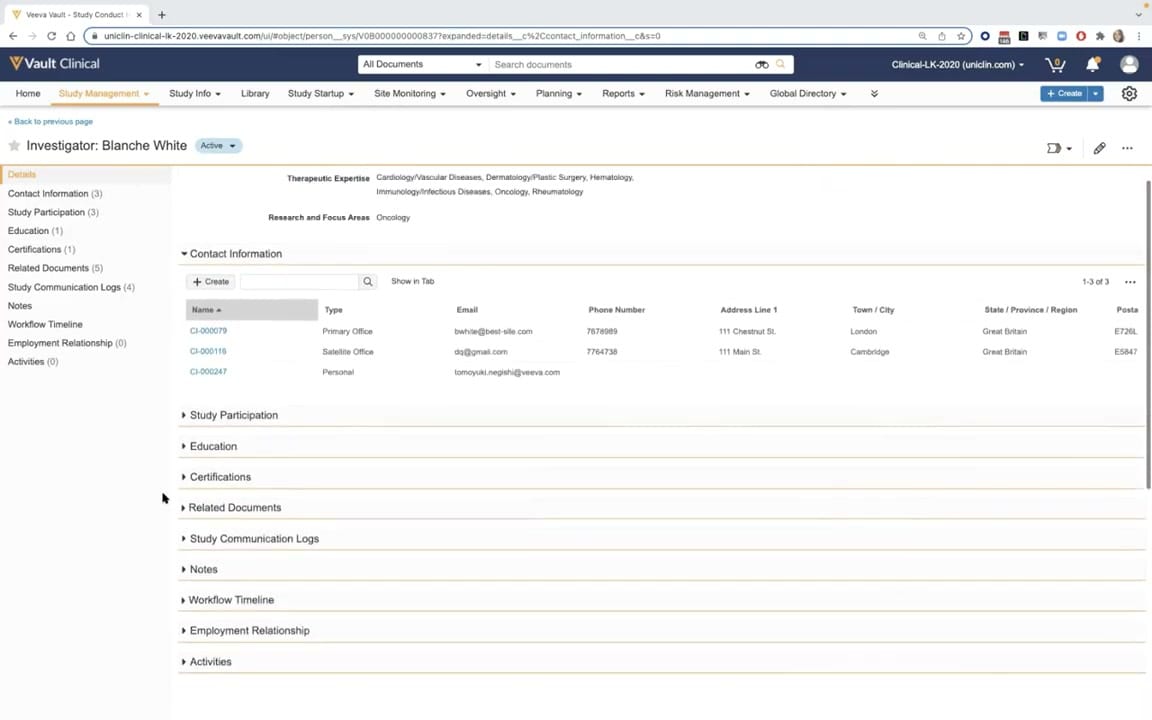
Within the context of clinical trial management, this role-based study summary serves as a primary workspace for clinical operations teams to monitor trial progress and compliance. By consolidating metrics from various study sites, the dashboard supports oversight workflows by highlighting areas that require immediate attention, such as overdue monitoring visits or lagging enrollment rates. Clinical trial managers can use these visual indicators to assess whether monitoring visit reports are being completed within target cycle times, which is critical for maintaining regulatory readiness and data quality. The ability to filter by country or site enables users to transition from a global study overview to localized performance metrics, facilitating targeted interventions. This centralized view reduces the need to run manual reports, streamlining daily tracking tasks for study teams.
Source, version, and interpretation limits
The screenshot is sourced from the official Veeva YouTube demo titled CTMS Oversight Deep Dive Demo, published in March 2022. Because this image represents a demonstration environment, the displayed study name, AVEG 027, along with all associated metrics, dates, and task lists, should be treated as synthetic demonstration data. Actual user interfaces, available features, and specific dashboard configurations may vary depending on the organization's Vault release, custom configurations, and user permissions. The browser chrome and demo tenant URL are visible, reflecting the system's appearance at the time of the recording.
Authoritative references
Use these primary sources to confirm current product positioning, terminology, and release-specific behavior.
- CTMS Oversight Deep Dive Demo(Official Veeva YouTube demo)
- Veeva CTMS product overview(Official Veeva product page)
- Veeva CTMS trial-management overview(Official Veeva resource)