What this CTMS screenshot shows
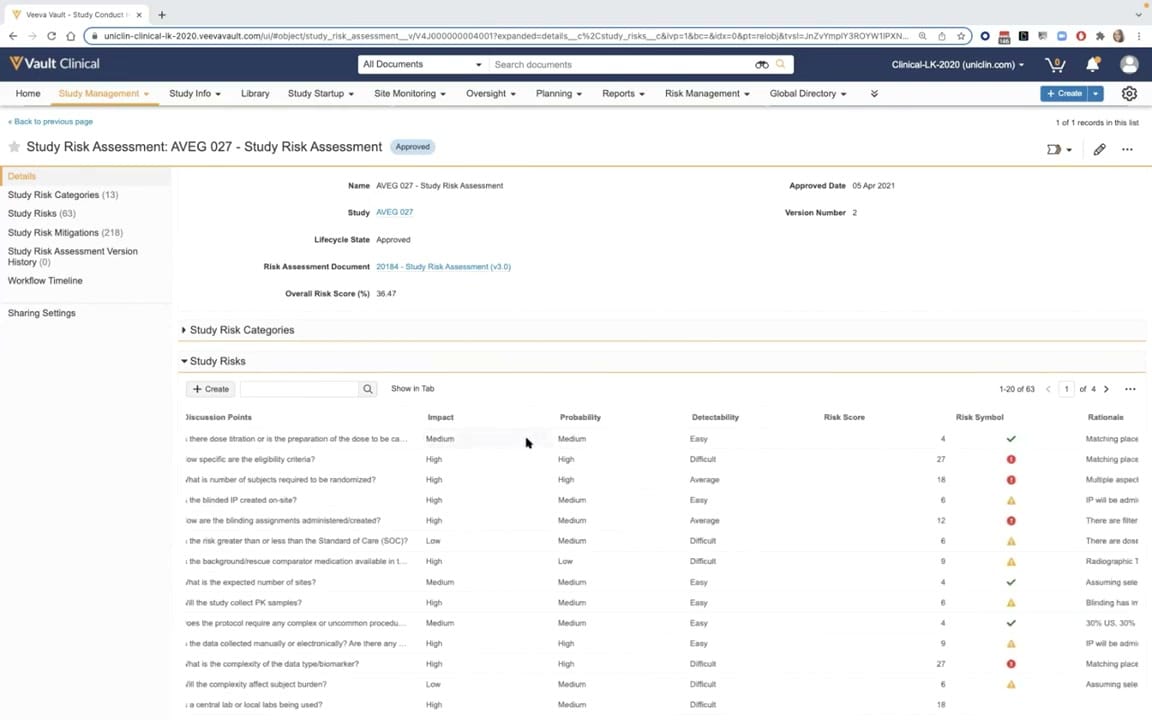
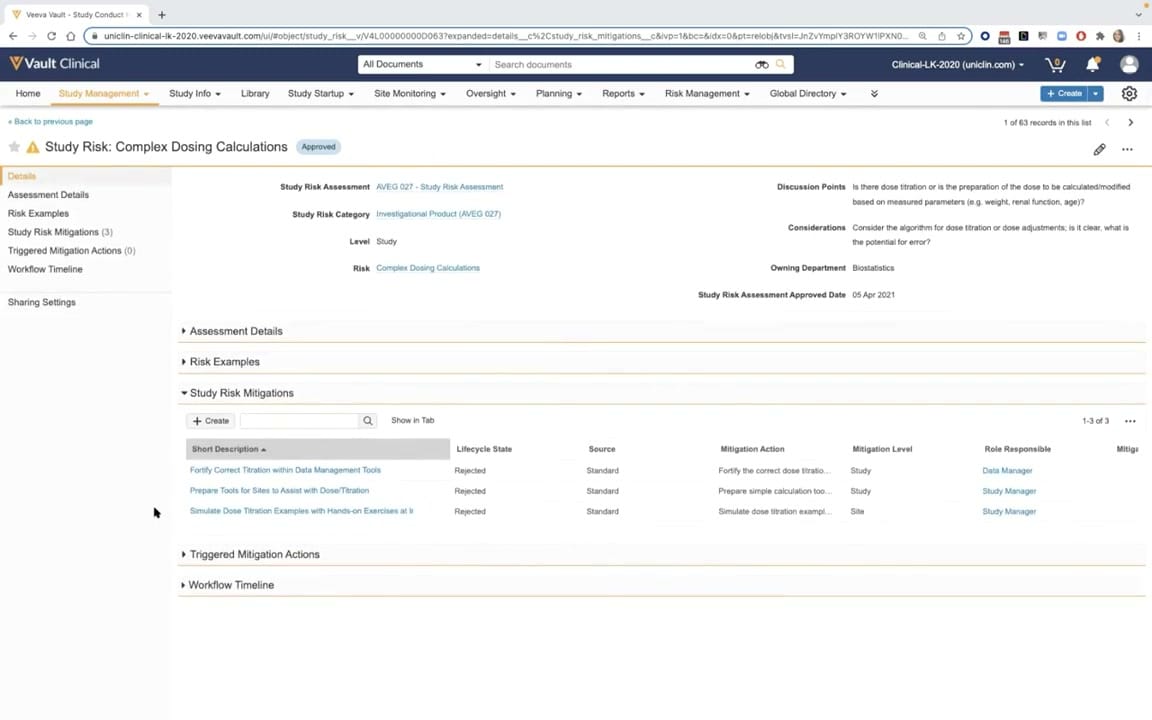
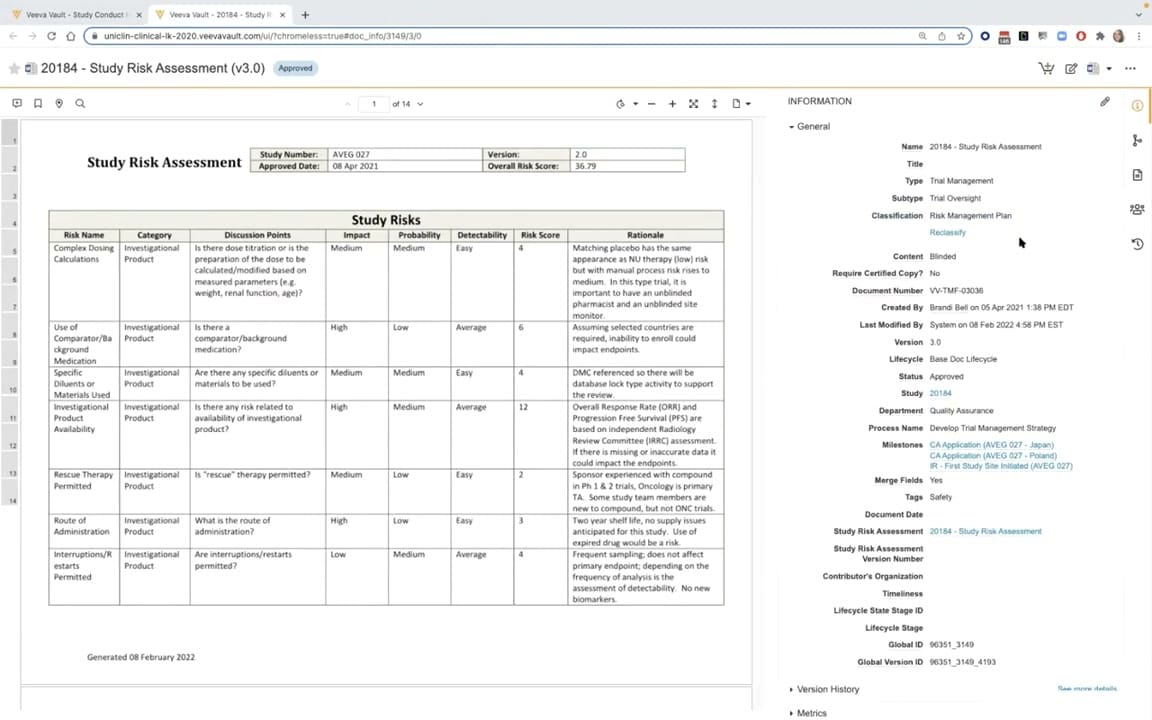
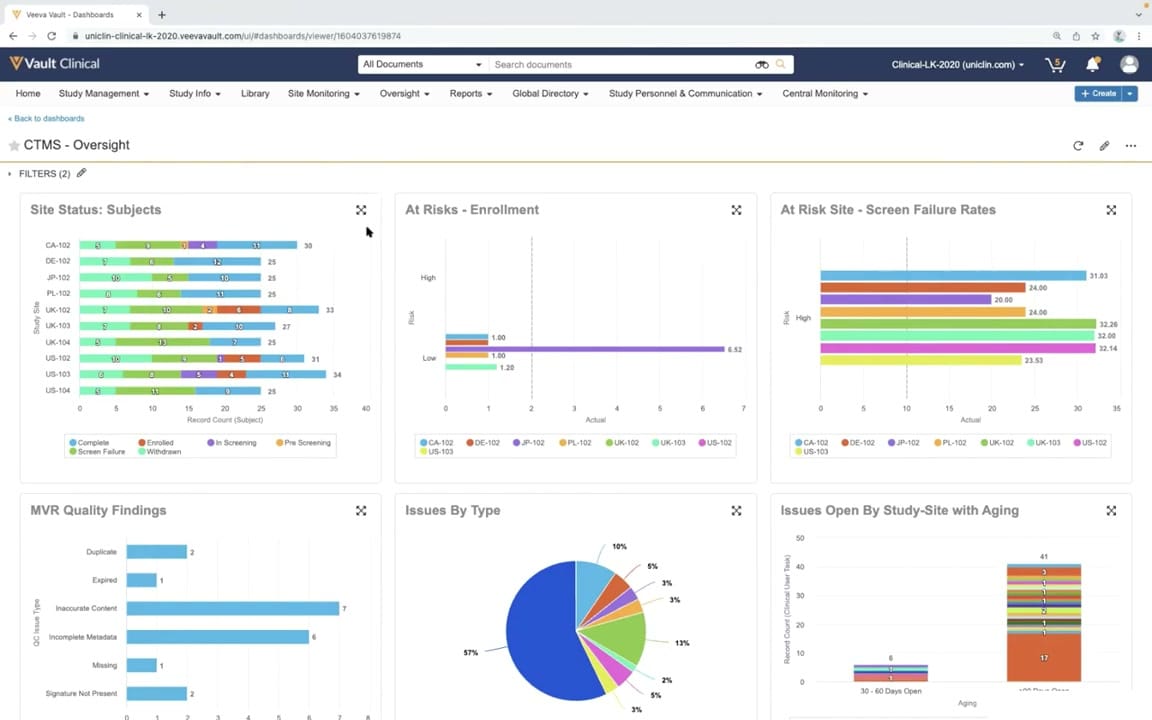
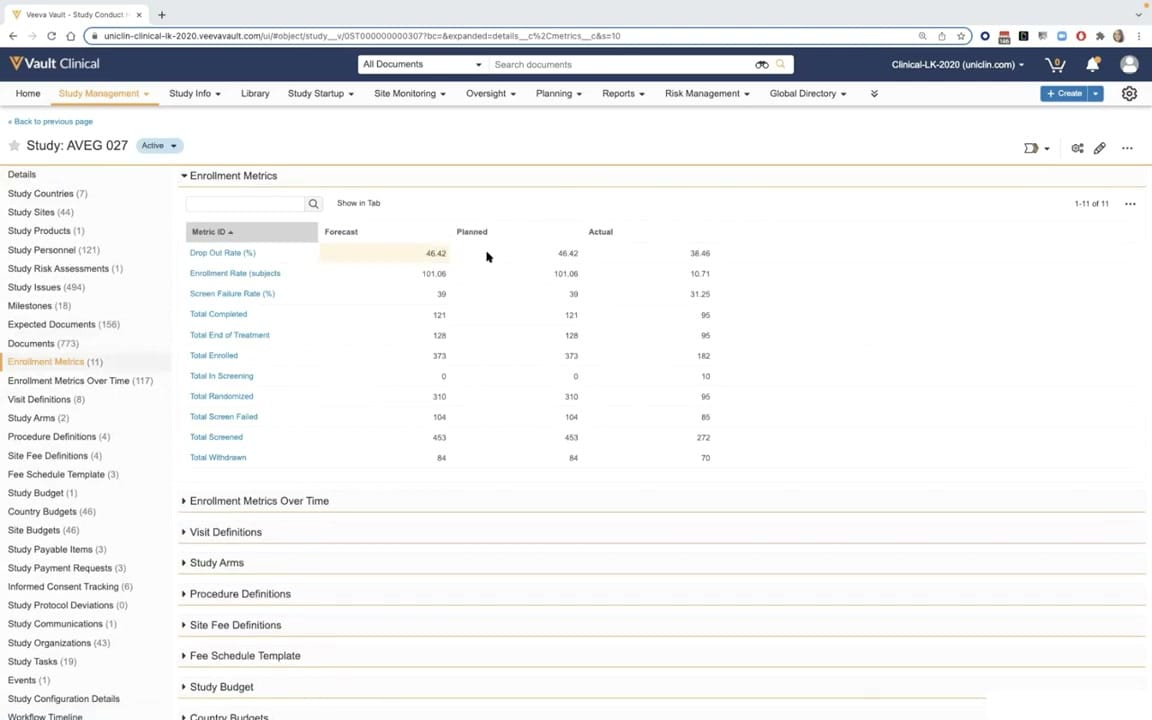
This reference page displays a screenshot of the Veeva Vault Clinical Trial Management System (CTMS) interface, focusing on the Enrollment Metrics workflow for a study designated as AVEG 027. The interface presents a structured overview of key trial performance indicators within a configured Vault environment. On the left side, a comprehensive navigation panel lists various study components, such as sites, personnel, and budgets, along with their respective record counts. The main content area features an expanded Enrollment Metrics section, displaying a tabular view of critical metrics including drop-out rates, enrollment rates, and screening totals. For each metric, the system displays comparative columns for forecast, planned, and actual values. This layout provides clinical operations teams with a centralized view of trial progress, helping them monitor enrollment milestones and compare actual performance against initial projections.
Visible interface elements
- Study header displaying the active study identifier AVEG 027.
- Left-hand navigation sidebar listing study components with record counts, highlighting Enrollment Metrics.
- Enrollment Metrics table with columns for Metric ID, Forecast, Planned, and Actual values.
- Specific metric rows including Drop Out Rate, Enrollment Rate, and Total Enrolled.
- Search input field and Show in Tab button located above the metrics table.
- Collapsed accordion sections below the table, such as Enrollment Metrics Over Time and Visit Definitions.
- Top global navigation bar with menus for Study Management, Site Monitoring, and Reports.
Interface details
The user interface is organized into a standard multi-pane layout typical of Veeva Vault applications. At the top, a global navigation bar provides access to primary modules such as Study Management, Site Monitoring, and Reports. Below this, the study header identifies the active study as AVEG 027. The left-hand sidebar serves as a detailed navigation menu, highlighting Enrollment Metrics with eleven associated records, while listing other study components with their corresponding counts in parentheses. The central workspace displays the expanded Enrollment Metrics section, which includes a search field and a Show in Tab option. The main table contains eleven rows of metrics, including Drop Out Rate, Enrollment Rate, Screen Failure Rate, and various totals such as Total Enrolled and Total Randomized. The table columns are labeled Metric ID, Forecast, Planned, and Actual, allowing for direct comparison of numerical values. Below this active table, several collapsed accordion panels are visible, including Enrollment Metrics Over Time, Visit Definitions, and Study Arms, which can be expanded to reveal additional study parameters.
Workflow context
Within clinical trial operations, tracking enrollment metrics is essential for maintaining study timelines and managing resources. The visible interface supports this workflow by consolidating key performance indicators into a single, structured view. Clinical operations users can utilize this data to compare actual enrollment progress against planned and forecasted targets. For instance, comparing the actual enrollment rate of 10.71 against the planned rate of 101.06 can help teams identify potential delays early in the trial lifecycle. Similarly, monitoring screen failure and drop-out rates can assist in evaluating protocol feasibility or site performance. While the static screenshot displays historical demo data, this structured presentation of metrics can support study managers in making informed decisions regarding site activation, recruitment strategies, and overall trial timelines, ultimately helping to keep the clinical trial on track.
Source, version, and interpretation limits
The provided screenshot is a static frame from an official Veeva YouTube demo titled CTMS Oversight Deep Dive Demo, published in March 2022. Because this image represents a configured demonstration environment, the visible fields, labels, and record counts are synthetic and may not reflect actual production configurations. Additionally, a static image cannot verify real-time data synchronization, automated calculations, or active system integrations. The specific layout, available tabs, and visible metrics are subject to change based on the software release version and individual customer configurations. This reference copy is intended solely to describe the visible interface design and layout patterns of the software.
Authoritative references
Use these primary sources to confirm current product positioning, terminology, and release-specific behavior.
- CTMS Oversight Deep Dive Demo(Official Veeva YouTube demo)
- Veeva CTMS product overview(Official Veeva product page)
- Veeva CTMS trial-management overview(Official Veeva resource)