What this CTMS screenshot shows
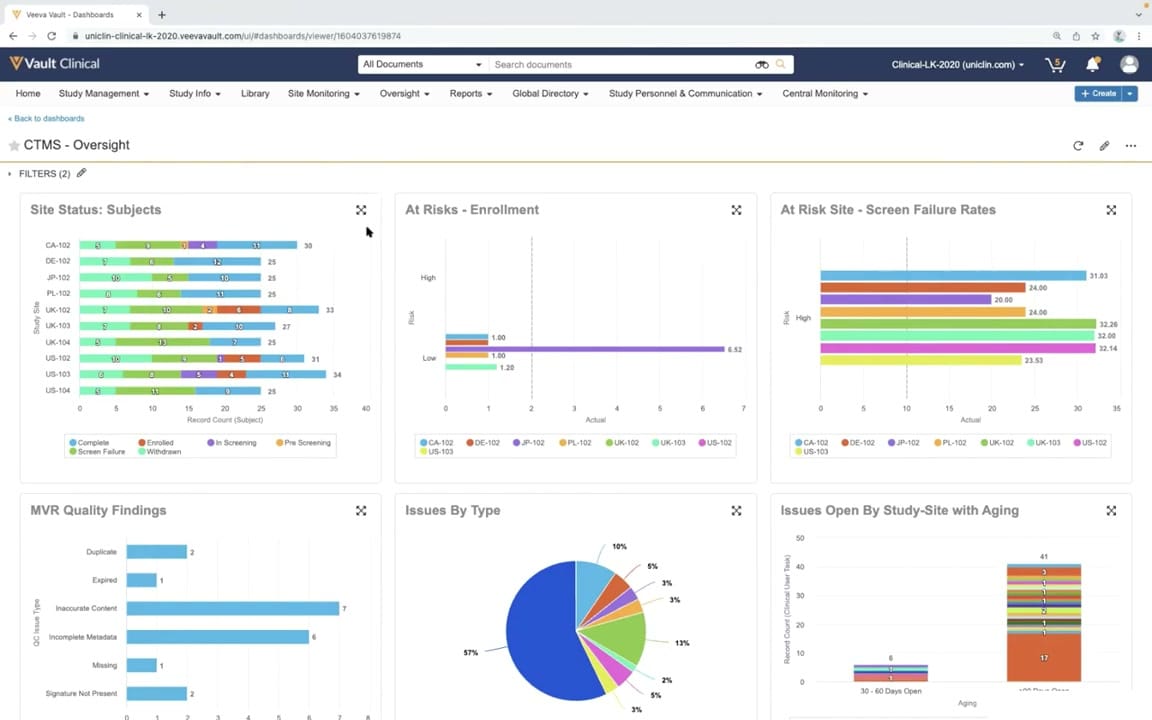
This screenshot displays the CTMS Oversight dashboard within the Veeva Vault Clinical interface, illustrating a cross-study oversight workflow. The dashboard aggregates multiple visual reports to present key metrics across different clinical trial sites and studies. Six distinct data visualization panels are arranged in a grid layout, displaying metrics related to site status, enrollment risks, screen failure rates, monitoring visit report (MVR) quality findings, issues by type, and open issues with aging. The interface features standard Vault navigation elements at the top, including a search bar, document selection dropdown, and clinical operations menus such as Study Management, Site Monitoring, and Oversight. This dashboard serves as a centralized interface for clinical operations personnel to review study metrics and identify potential areas requiring attention across multiple active sites.
Visible interface elements
- "CTMS - Oversight" dashboard title with a star icon and action buttons.
- "Site Status: Subjects" horizontal stacked bar chart showing subject statuses across site codes.
- "At Risks - Enrollment" horizontal bar chart categorized by High and Low risk levels.
- "At Risk Site - Screen Failure Rates" horizontal bar chart with color-coded site legends.
- "MVR Quality Findings" horizontal bar chart detailing QC issue types like Inaccurate Content and Duplicate.
- "Issues By Type" pie chart displaying percentage distributions of issue categories.
- "Issues Open By Study-Site with Aging" stacked vertical bar chart showing open tasks by age brackets.
- Top navigation bar containing "Vault Clinical" branding, search bar, and clinical operations menus.
Interface details
The interface is organized into a clean, two-by-three grid of dashboard widgets under the header "CTMS - Oversight". The top-left panel, "Site Status: Subjects", uses horizontal stacked bar charts to represent subject statuses (Complete, Enrolled, In Screening, Pre Screening, Screen Failure, and Withdrawn) across various site codes like CA-102 and DE-102. To its right, "At Risks - Enrollment" and "At Risk Site - Screen Failure Rates" display horizontal bar charts categorized by risk levels (High and Low) with color-coded legends for individual sites. The bottom row contains three panels: "MVR Quality Findings", which uses a horizontal bar chart to categorize issue types such as duplicate, expired, or inaccurate content; "Issues By Type", represented by a multi-colored pie chart showing percentage distributions; and "Issues Open By Study-Site with Aging", which displays a stacked vertical bar chart categorized by age brackets like 30 to 60 days open and over 100 days open. Each widget includes an expand icon in the top-right corner, allowing users to view individual reports in greater detail.
Workflow context
In a clinical operations workflow, this cross-study oversight dashboard can support trial managers in monitoring operational health across multiple active sites. By presenting consolidated metrics on subject enrollment, screen failures, and open issues, the interface could help users identify underperforming sites or systemic quality concerns. For instance, the "Issues Open By Study-Site with Aging" widget can assist teams in tracking unresolved tasks, while the "MVR Quality Findings" chart could help identify common documentation errors that require targeted training. This visual aggregation of data can support proactive risk management and resource allocation without requiring users to manually compile reports from individual site files. Ultimately, the dashboard provides a structured framework that can help clinical operations teams maintain oversight of study progress, protocol deviations, and site monitoring performance across the entire clinical trial portfolio.
Source, version, and interpretation limits
The screenshot is sourced from the official Veeva YouTube demo titled "CTMS Oversight Deep Dive Demo," published in March 2022. Because this image represents a static frame from a demonstration environment, it does not reflect real-time data, active clinical trials, or live system integrations. The visible labels, site codes, and metrics are synthetic demonstration data configured for illustrative purposes. Actual user interfaces, available dashboard widgets, and navigation options may vary depending on the specific Veeva Vault release, individual customer configurations, and user permission levels. Consequently, this reference image should be used solely to understand the general layout and visual capabilities of the CTMS oversight interface.
Authoritative references
Use these primary sources to confirm current product positioning, terminology, and release-specific behavior.
- CTMS Oversight Deep Dive Demo(Official Veeva YouTube demo)
- Veeva CTMS product overview(Official Veeva product page)
- Veeva CTMS trial-management overview(Official Veeva resource)