
QALYs & ICERs Explained: Core Health Economics Metrics
[Revised April 26, 2026] This article has been reviewed and updated to reflect the NICE cost-effectiveness threshold increase to £25,000–£35,000 per QALY that took effect in April 2026, the adoption of the new UK EQ-5D-5L value set, and continuing developments around U.S. Inflation Reduction Act constraints on QALY use in Medicare. External references were verified.
Executive Summary
Quality-adjusted life years (QALYs) and the incremental cost-effectiveness ratio (ICER) are foundational metrics in health economics used to evaluate the value of medical interventions. A QALY combines both the duration and quality of life into a single index: one QALY equates to one year of life in perfect health, with health states scored from 0 (death) to 1 (full health) ([1]) ([2]). This allows cross-disease comparisons of health benefits by quantifying gains in both longevity and well-being. For example, NICE in the UK explains that a treatment that confers “1 additional year of perfect health (or an equivalent combination of life extension and quality‐of‐life improvements)” is the benchmark for evaluating cost-effectiveness ([3]) ([4]).
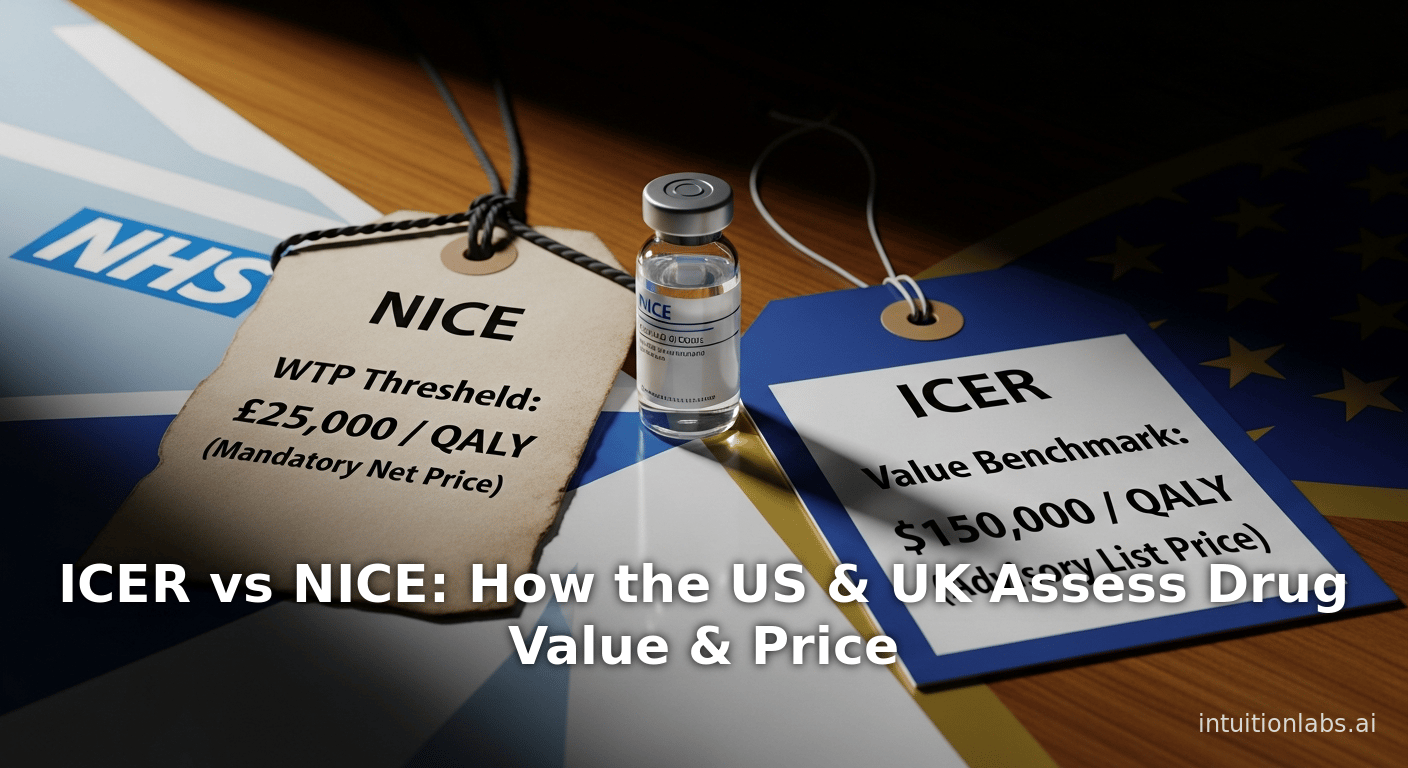
The ICER translates QALY gains into cost terms. It is defined as the difference in costs divided by the difference in QALYs between two alternatives ([5]) ([6]). ICER = (Cost_new – Cost_old) / (QALY_new – QALY_old). In practice, if a new treatment yields more QALYs at higher cost, the ICER indicates its cost per additional QALY gained. Decision-makers compare the ICER to a willingness-to-pay threshold: if the ICER is below that threshold (i.e. each extra QALY costs less than the threshold), the treatment is deemed cost-effective. In the UK, NICE has traditionally used a threshold of £20,000–£30,000 per QALY ([7]) ([3]). (As of April 2026, NICE has raised this range to £25,000–£35,000 per QALY ([8]).) In the United States there is no single official threshold, but analysts have informally used figures around $50,000–$150,000 per QALY; one survey of US studies found many authors citing $100,000/QALY as a benchmark ([9]) ([10]).
This report provides a comprehensive review of QALYs and ICERs. We cover the historical development of these metrics ([11]), formal definitions and measurement methods ([1]) ([2]), and how they are calculated in practice (for example, a Scottish Medicines Consortium guide shows how to compute QALYs and then ICERs in a hypothetical treatment scenario ([12]); see Table 2). We discuss how different health-related quality-of-life (HRQoL) instruments (EQ-5D, SF-6D, HUI3, etc.) are used to derive the Q (utility) component of QALY ([13]) ([14]). We present empirical data on QALY gains and ICERs from the literature; for instance, one review of 370 cost-utility studies in 2010 found a median incremental gain of only 0.06 QALY (approximately 3 weeks of healthy life) ([15]). We examine case examples from real health technology assessments (for example, NICE’s use of QALYs and ICERs in drug appraisals ([7]) ([16])). We also cover controversies and alternative views: critics point out that QALYs can inadvertently disadvantage people with disabilities or terminal illness (e.g. by assigning negative QALYs to states deemed “worse than dead” ([17])), and U.S. policy now bans Medicare from using QALY-based thresholds that discriminate against older or disabled people ([18]). Finally, we discuss the future of these metrics, including newer concepts like “distributional QALYs” with equity weights, proposals for broader “wellbeing‐adjusted life‐years” incorporating consumption ([19]), and recent changes (like NICE’s upcoming threshold raise and new EQ-5D valuation).
Throughout, all claims are backed by authoritative references. In summary, QALYs and ICERs remain the cornerstones of health economic evaluation – powerful but also debated tools for balancing costs and patient outcomes. They facilitate the analysis of “value for money” in healthcare, guiding resource allocation to maximize population health ([20]) ([5]), but also prompt ongoing discussions about equity, societal values, and methodological refinements.
Introduction and Background
Resource allocation is a central problem in healthcare. Societies have limited budgets for health, so policy-makers must decide which interventions produce the greatest health benefit per dollar spent. Health economics provides formal tools to address this. Among the most important tools are combined measures of health benefit and cost-effectiveness. In particular, the quality-adjusted life-year (QALY) has become the dominant outcome metric in many countries’ economic evaluations, and the incremental cost-effectiveness ratio (ICER) is the corresponding metric for value comparison ([21]) ([3]). Together, they form the basis of cost-utility analysis, a variant of cost-effectiveness analysis that accounts for both survival and quality of life.
A QALY incorporates two components: (1) longevity (time) and (2) health‐related quality of life (HRQoL) ([2]). One QALY equals one year of life in perfect health. Health states less than perfect are assigned utility values between 0 and 1 (for example, severe disability might have a utility of 0.3). Mathematically, for a period of life t in health state u, the QALYs gained are u × t. (If a health state is judged “worse than dead” by societal surveys, it might receive a negative utility, but most practice restricts utilities to ≥0.) Thus QALYs combine time and quality. For example, NICE explains “the QALY combines both the length of life gained from a treatment and its impact on quality of life, represented as a single number” ([3])([7]).
This combined measure allows direct comparison of very different interventions. For instance, life-saving treatments (lungs, stents, cancer drugs) and quality-of-life therapies (pain relief, depression treatment) can be compared on the same scale of QALYs. As one expert summary notes, QALYs “establish a single metric to measure health benefit” and can be used to evaluate diverse healthcare interventions in a common framework ([21]). Indeed, major health technology assessment (HTA) agencies around the world routinely use QALYs. The UK’s National Institute for Health and Care Excellence (NICE) and many European agencies require submissions to report cost per QALY ([21]) ([3]). Similarly, Canada’s health agencies and Australia’s PBAC consider QALY-based analyses. An international review finds that in almost all published CEAs (from 1981–2000) using a “health-adjusted life-year” (HALY) measure, all but one study used QALYs ([22]) – underscoring how ubiquitous QALY has become.
In contrast, the Disability-Adjusted Life Year (DALY) – a related concept measuring lost healthy years – is more common in global burden-of-disease work. QALYs focus on gains in health (valued by preferences), whereas DALYs focus on the burden of disease (summing years lost to death and years lived with disability). Cost-effectiveness studies in high-income countries have historically used QALYs, whereas DALYs have featured more often in analyses by WHO and global health groups for low-income countries ([23]). The two metrics are related but have different derivations; for example, DALYs globally may incorporate age weights or disability weights from the Global Burden of Disease ([24]). We discuss comparisons below, but this report centers on QALYs as the benefits metric and ICERs as the associated cost-effectiveness metric.
Once QALYs are calculated for each intervention, we compare the incremental costs and QALYs across options. By definition, the incremental cost-effectiveness ratio (ICER) is the ratio of the difference in costs to the difference in outcomes (QALYs) between two strategies ([6]) ([5]). If Intervention A costs $C_A and yields Q_A QALYs, and Intervention B costs $C_B and yields Q_B QALYs, then \ [ \text{ICER}_{B!{\rm vs}!A} ;=; \frac{C_B - C_A}{Q_B - Q_A};. ] Thus the ICER tells us how many dollars (or pounds) must be spent to gain one extra QALY by choosing B instead of A. (Special cases occur: if B is both more effective (higher Q) and cheaper than A, then B dominates A; if B is less effective and more costly, B is dominated and would never be chosen.)
In practice, decision-makers compare the ICER to a cost-effectiveness threshold – the maximum amount a payer is willing to pay for one additional QALY. If ICER ≤ threshold, the new intervention is considered “cost-effective.” For example, NICE has long regarded interventions with ICERs up to £20,000–£30,000 per QALY as acceptable (with a more generous threshold up to £50,000 for end-of-life care) ([3]) ([4]). Following a UK Government announcement in late 2025, NICE's standard threshold was raised to £25,000–£35,000 per QALY, taking effect in April 2026 ([8]). By contrast, the U.S. has no fixed official cutoff, but analysts often invoke informal thresholds like $50,000 or $100,000 per QALY ([9]) ([10]). (A recent review of US CEAs found that about 27% of studies quoted $50k/QALY as a benchmark and 34% quoted $100k/QALY ([9]).) These thresholds are partly grounded in normative judgments (e.g. relating to per-capita GDP or historical practice) but also reflect opportunity costs: approving a high-ICER therapy uses funds that could have generated more health elsewhere ([20]) ([4]).
The following sections dig deeply into these concepts. We begin with detailed definitions and historical context for QALYs and ICERs, then examine methods of measuring health utility and computing ICERs in actual studies. We summarize data on observed QALY gains and ICER values from the literature (Table 1), and present illustrative examples (Table 2). The report also explores multiple perspectives and case studies – for instance, how NICE and other HTA bodies apply QALYs in real decisions, as well as notable debates such as the proposed U.S. ban on QALY‐based decision rules ([18]) ([17]). Throughout, we cite current guidelines, empirical surveys, and expert analyses. Finally, we discuss implications for policy and future research, including innovations like equity-weighted QALYs and broader wellbeing measures ([19]) ([17]).
Quality-Adjusted Life Years (QALYs): Definition and Measurement
The QALY Concept
A quality-adjusted life year (QALY) quantifies health by blending longevity and health-related quality of life (HRQoL) into a single number ([7]) ([2]). Formally, for each year of life an individual experiences, a utility weight (0 ≤ u ≤ 1) is assigned reflecting the HRQoL in that year; multiply the weight by the time to get QALYs. By convention, full health is 1 QALY/year and death is 0. Thus a year lived at 70% of full health counts as 0.70 QALYs. Leading texts make this explicit: “A year of perfect health has a QALY of 1. A year of less than perfect health has a QALY between 0 and 1. Death has a QALY of 0.” ([1]). (Some approaches allow negative QALYs for states deemed worse than dead, though these are controversial ([17]).)
The multi-purpose nature of the QALY is key: it allows direct comparability of interventions across diseases. For example, giving one cancer patient an extra 6 months in full health (0.5 QALY) can be directly compared to curing 100 cases of migraine gaining 0.1 QALY each. As one primer explains, the QALY “establishes a single metric to measure health benefit” that can be applied in cost-effectiveness analyses ([21]). Over the last several decades, QALYs have indeed become the standard measure in national HTA processes. For instance, NICE’s evaluation process uses QALYs to compare treatments: “we focus on how well a medicine works (clinical effectiveness)… and whether spending more is justified because the treatment improves health outcomes (cost effectiveness)”, where QALYs capture the health outcomes ([25]). The Institute of Medicine (US) notes that the QALY was originally introduced in the late 1970s as an outcome measure to “facilitate the maximization, in accordance with individual preferences for health, of aggregate health benefits for a given level of resources” ([11]). Empirical reviews confirm its dominance: in a survey of 328 cost-effectiveness studies (1981–2000), all but one used QALYs as the health measure ([22]).
How QALYs Are Estimated
To calculate QALYs in practice, analysts need health‐state utilities (the quality weights) for the conditions of interest. These are derived from health-related quality-of-life (HRQoL) instruments. Most commonly, “generic preference-based” instruments like the EQ-5D, SF-6D, HUI3, and Quality of Well-Being (QWB) scales are used ([13]) ([14]). These instruments classify health states using several dimensions (e.g. mobility, pain, mood) and have an established scoring algorithm. For example, the EQ-5D (used by NICE and many trials) defines health on five dimensions (mobility, self-care, usual activities, pain, anxiety/depression) ([14]). A respondent’s answers (at typically 3 or 5 acuity levels per dimension) locate them in one of a few hundred possible states. Each defined state has a pre-calibrated utility value, usually obtained from general population surveys (often using Time Trade-Off, TTO, or Standard Gamble techniques ([26]) ([14])). Thus if a patient reports “slight pain” and “no anxiety” etc., the EQ-5D scoring gives a utility (e.g. 0.82). Table 1 summarizes common utility instruments and their usage; notably, NICE “has selected the EQ-5D as the most widely used preference-based measure” and indeed prefers its use in submissions ([13]) ([27]).
In practice, analysts model the life expectancy under each treatment and the trajectory of HRQoL over time. For each time interval (year or month), they multiply the survival time by the utility of the health state in that interval, and sum these to get total QALYs. For example, if a new drug gives a patient 2 extra years of life, with quality of life rising from 0.50 (pre-treatment) to 0.70, the QALYs gained are 2 years × 0.70 utility = 1.4 QALYs (plus the improvement from 0.50 baseline, sometimes counted as incremental 2 × (0.70–0.50) = 0.4 QALYs, depending on analysis framing). The QALY calculation inherently discounts future years (typically at ~3%/yr in economic evaluations) and may adjust for age.
Example (Illustration): A hypothetical tutorial from the Scottish Medicines Consortium (excerpted by ISPHi) illustrates QALY/ICER calculation ([12]). In their scenario, a patient on current medicine X lives 10 more years at an average quality of life (utility) 0.5 (yielding 5.0 QALYs). A new medicine Y extends life to 12 years with a utility of 0.7 (yielding 8.4 QALYs), an incremental gain of 3.4 QALYs. If Y costs £10,000 more than X, then ICER = £10,000 / 3.4 QALYs ≈ £2,941 per QALY ([12]). This example calculation is summarized in Table 2.
In many studies, direct measurement of utilities is not available. Analysts may then map clinical or generic quality-of-life scores onto utility scales (known as utility mapping) ([28]). However, reviews have found that many published cost-effectiveness studies fail to report clearly how QALYs were obtained. In one survey of 370 cost-utility papers, over half (55%) did not even cite the utility instrument or method used to generate QALYs ([29]). This lack of transparency has raised concerns, since different instruments can yield markedly different utility values for the same health state ([29]).
Distribution of QALY Gains and Examples
Empirical analyses show that incremental QALY gains are often modest in practice. In a review of CUA studies published in 2010, the median incremental QALY per new intervention was only 0.06 (i.e. about 3 weeks of perfect health) ([15]). This implies that many treatments provide relatively small additional health time adjusted for quality. Table 1 illustrates this distribution: the 25th percentile of reported QALY gains was ~0.01 (a few days), 75th percentile was ~0.32 (about 4 months), and the mean was 0.31 QALY (roughly 3.7 months). These figures come from the Wisløff et al. (2014) review of 333 studies ([15]). A wide range of QALY gains appear (from near zero up to a few QALYs), but most are quite small. As the authors note, short time horizons in modeling often limit the QALY gains that can be realized ([30]).
Various case studies illustrate the QALY/ICER approach in real settings. For instance, NICE appraisals of new drugs routinely report cost per QALY. In 2018, NICE famously rejected a Novartis cancer therapy despite its high efficacy: even after substantial discounts, NICE determined that at its [$371,000] price the ICER was too high relative to the benefit ([16]). Axios News reported that an independent U.S. evaluation (by ICER) had found the drug “largely cost-effective,” but NICE held that NHS resources would be better used elsewhere ([16]). This highlights how the same QALY/ICER analysis can lead to different conclusions under different thresholds or willingness-to-pay standards. In oncology and rare diseases, QALYs are often debated: NICE may apply a higher threshold (or end-of-life premium) in certain cases, whereas other systems (like some U.S. insurers) may face regulatory constraints on using QALYs. We discuss these variations and examples of country-specific practice below.
Table 1. Distribution of incremental QALY gains (and equivalent time) found in published studies (Wisløff et al. 2014) ([15]).
| Statistic | Incremental QALYs | Equivalent in perfect health |
|---|---|---|
| 25th percentile | 0.01 | ~4 days |
| Median | 0.06 | ~3 weeks |
| 75th percentile | 0.32 | ~4 months |
| Mean | 0.31 | ~3.7 months |
| Source: Wisløff et al. (2014) review of 333 cost-utility analyses (published in 2010) ([15]). |
Table 2. Example cost-effectiveness calculation (adapted from Scottish Medicines Consortium example ([12])).
| Parameter | Medicine X (current care) | Medicine Y (new treatment) | Increment (Y vs X) | Notes |
|---|---|---|---|---|
| Life expectancy (years) | 10.0 | 12.0 | +2.0 years | |
| Quality-of-life utility | 0.50 | 0.70 | (typically measured/pre) | 0.20 increase |
| Total QALYs (Duration×Utility) | 5.0 (10×0.50) | 8.4 (12×0.70) | +3.4 QALYs | |
| Treatment cost | £X (baseline) | £X + £10,000 | +£10,000 | assume X = baseline cost |
| Incremental cost-effectiveness | – | – | £10,000 / 3.4 QALY = £2,941 per QALY | ([12]) |
In this illustrative scenario, Medicine Y yields 3.4 more QALYs at an extra £10k cost, so ICER ≈ £2,941 per QALY ([12]).
Incremental Cost-Effectiveness Ratio (ICER)
Once QALYs are calculated for each intervention, the incremental cost-effectiveness ratio (ICER) is computed. ([6]) ([5]) As noted, ICER = (Cost_B – Cost_A) / (QALY_B – QALY_A) for new (B) versus standard (A). This single number captures the trade-off of additional cost per additional QALY. A low ICER implies a relatively small cost to gain each QALY (attractive), whereas a high ICER means each QALY is expensive. If the ICER is below the decision threshold, the new intervention is usually considered cost-effective; if above, then not.
The concept of the ICER also encompasses “dominance” cases in cost-effectiveness analysis. If a new treatment costs more and yields fewer QALYs than standard care, it is said to be dominated (clearly inferior). Conversely, if it costs less and gives more QALYs (cost-saving + more effective), it strictly dominates the old option. Only when an intervention is more expensive and more effective does one compute a positive ICER as in Table 2. Across the field, ICERs are reported in terms like “£X per QALY” or “$Y per life-year gained (when QALYs aren’t used).” Note that an ICER per life-year (LY) ignores quality-of-life; some analyses report both cost/LY and cost/QALY. A classic finding is that QALY-adjustment often lowers the ICER relative to LY-only measures, since quality adjustments tend to increase the incremental benefit ([31]).
Interpreting the ICER and Thresholds
Interpreting an ICER requires context. Most health systems do not have unlimited budgets, so they implicitly or explicitly set a threshold willingness-to-pay (WTP) per QALY. An ICER below this threshold suggests good “value for money.” In the UK, NICE has historically used £20,000–£30,000/QALY as its range for cost-effectiveness ([3]) ([7]). Treatments with ICERs under £20k–30k are presumed cost-effective in routine cases; above £30k they require special justification. (For very severe or end-of-life cases, NICE may accept ICERs up to ~£50,000/QALY under its end-of-life criteria.) ([3]). As of April 2026, the UK government has raised NICE’s official range to £25k–£35k/QALY ([8]) in order to facilitate more approvals of innovative drugs.
Other countries use their own benchmarks. The World Health Organization once recommended comparing ICERs to a country’s GDP per capita (e.g. considering interventions “cost-effective” if ICER < ~3× GDP/per capita). However this guideline is now considered too high for many settings and has been largely superseded ([32]). In practice, many high-income systems choose administrative thresholds. In the U.S., no fixed threshold exists, but analysts often consider values from $$50,000$ up to $$150,000$ per QALY. For decades US researchers informally used $$50,000/QALY$ (originally from dialysis cost decades ago). A recent JAMA analysis found that about 27% of US-based CEAs still cited $50k, while 34% cited $100k, and 8% cited $150k ([9]). In Canada, there is no single formal cutoff either: CADTH (Canadian Agency for Drugs and Technologies in Health) does not declare an explicit threshold, but analysts often use a ~$C50,000–100,000$ range (though decision committees consider broader factors). Australia’s PBAC also has no hard threshold, but commonly reviews are looked at through ~$A50,000/QALY$. These figures vary by context. For example, a $50k/QALY threshold is far smaller than 1×GDP in most G7 countries, suggesting many systems effectively apply a more stringent WTP than WHO’s old rule-of-thumb.
Thresholds are controversial and often debated. Some argue higher thresholds could be justified for illnesses with high unmet need. For example, NICE introduced supplementary criteria (Treatments for rare diseases and end-of-life Therapy Criteria) that can effectively raise the acceptable ICER in special cases. Currently in the UK, NICE even has higher implicit thresholds for “ultra-rare” conditions (sometimes exceeding £100k/QALY) ([7]). Moreover, thresholds change over time: inflation and policy goals have prompted NICE’s recent increase to £25–35k ([8]). Meanwhile the U.S. Inflation Reduction Act of 2022 explicitly banned Medicare from using any ICER threshold that would disadvantage older or disabled patients ([18]). This reflects ethical concerns that strict QALY thresholds might implicitly discriminate (discussed later).
In summary, the ICER conveys the “price” of health gains. Decision-makers compare it to a value-for-money benchmark. If the ICER is below that benchmark, the intervention is typically approved (or considered good value). If not, payers may refuse coverage or negotiate price reductions. This mechanism underlies virtually all modern health technology assessments and insurance coverage decisions worldwide ([3]) ([7]).
Measurement of Health States and Utility Values
As noted, QALY calculation depends critically on assigning utility values to health states. These utilities reflect society’s preferences (often elicited from the general public) for living in different health conditions. Unlike clinical outcomes (blood pressure, survival), utilities are preference weights on a 0–1 scale. Two main methods are used to obtain these: survey-based valuation and multi-attribute instruments.
Multi-Attribute Utility Instruments
Most HTA bodies rely on standardized multi-attribute instruments that combine health dimensions into a utility score. Examples include:
- EQ-5D: Developed by the EuroQol group, this is by far the most widely used HRQoL instrument globally ([13]) ([27]). It covers five dimensions (mobility, self-care, usual activities, pain/discomfort, anxiety/depression), each at 3 or 5 levels. A person’s responses define one of 243 (3L) or 3,125 (5L) possible health states. Each state has a utility value derived from population surveys using the time trade-off (TTO) method ([14]). For example, the TTO might ask a person how many years in full health they consider equivalent to 10 years with a certain condition; from such questions a utility is calculated. NICE has adopted the latest UK population-based value set for the EQ-5D-5L (recently updated to reflect UK societal preferences) ([33]).
- SF-6D: Derived from the SF-36 or SF-12 health surveys, the SF-6D defines health on six dimensions (physical functioning, role limitations, social functioning, pain, mental health, vitality). Utilities for SF-6D states are based on a UK general population sample using standard gamble or TTO. The SF-6D yields somewhat different utilities than EQ-5D; choice of instrument can affect results. It is accepted by various agencies (though NICE prefers EQ-5D in submissions ([27])).
- Health Utilities Index (HUI3): A Canadian-origin instrument with 8 dimensions (vision, hearing, speech, ambulation, dexterity, emotion, cognition, pain). Like EQ-5D, each health profile maps to a utility based on valuation data. HUI3 is used in some trials and Canadian HTAs.
- Quality of Well-Being (QWB) Scale: An older preference-based measure combining symptoms and functioning into a single index. It is included in the literature (e.g. the Tufts Global CEA Registry) but less often requested by modern HTA agencies.
These instruments produce health-state utility values between 0 and 1. For example, in EQ-5D valuation studies, full health = 1.0 by definition; death = 0. Some chronic states might score, say, 0.4 (e.g. certain severe disabilities). Importantly, these instruments are not disease-specific; the same questionnaire is used for cancer, diabetes, depression, etc. This non-specificity enables broad comparisons but can be insensitive to some conditions (critics argue generic instruments may inadequately capture mental health or rare-disease states). NICE’s Decision Support Unit and other entities sometimes require additional “mapping” when QALYs are used for conditions where EQ-5D has limitations.
Once utility values are available, the QALY calculation is mechanical: multiply the utility by time in that state. For example, if a patient lives 2 years in a state valued at 0.8 (under a new treatment), that yields 1.6 QALYs. If usual care allowed 2 years at 0.5 utility (1.0 QALY), the incremental gain is 0.6 QALY. These are then plugged into the ICER formula as shown above and in Table 2.
Direct Valuation Methods
Alternatively, utilities can be elicited directly for a health state through preference elicitation methods. The most common are:
- Time Trade-Off (TTO): The respondent indicates how many years of life in full health are equivalent to a longer time in an impaired health state. E.g. they might decide that “7 years in full health is as good as 10 years with severe arthritis,” implying a utility of 0.7 for the arthritis state. NICE’s EQ-5D valuations use a TTO-based value set ([14]).
- Standard Gamble (SG): The respondent chooses between living with an illness for sure or taking a gamble of perfect health vs immediate death. The probability of survival for which the respondent is indifferent gives the utility. For instance, if a patient accepts a 20% chance of death to avoid a chronic condition, the utility of the chronic state is 0.8.
- Visual Analogue or VAS: Less commonly, people simply rate states on a 0–100 scale, then convert to 0–1. (VAS is easier but not rooted in decision theory like TTO or SG.)
- Discrete Choice Experiments (DCE): Respondents choose between hypothetical health profiles; statistical models infer utilities. NICE’s new 5L valuation study incorporated DCE methods alongside TTO.
These methods can be used to directly measure a utility for a particular health profile (especially one not covered by a generic instrument). In practice, however, QALYs in CEAs usually come from standardized instruments (where DCE or TTO values are already known). Survey-based utilities are more often used in academic studies or when adapting a framework to local preferences.
Preferenda and Value Sets
Health utilities are usually anchored on death=0 and full health=1. Different countries have collected their own sets of values. For example, the UK now uses a 5-level EQ-5D value set based on a large national TTO/DCE study ([33]). The US had previously constructed its own EQ-5D v2 value set by national survey; Canada and other nations have their own. NICE specifically recently announced it will adopt the new UK EQ-5D-5L value set (after peer review) rather than the old 3-level one ([33]). The exact values in these sets can affect QALY results: if one country’s valuation places higher weight on, say, mobility vs pain, a therapy’s benefit profile could get different QALYs in different jurisdictions.
Examples of Utility Values
As an example, consider a patient with moderate chronic rheumatoid arthritis: an EQ-5D classification for such a state might be 0.6 (this depends on population weights). If a new biologic drug raises their quality of life to 0.8 while extending life, each life-year becomes 0.8 QALY instead of 0.6. Quantitatively: 5 years at utility 0.6 = 3.0 QALYs; with the drug, 5 years at 0.8 = 4.0 QALYs; the gain is 1.0 QALY. Such simple multiplication holds regardless of instrumentation.
However, it must be emphasized that utilities (and thus QALY) are societal constructs. The values come from surveys of the “general population” or patients. One ethical debate is whether society’s or patients’ preferences should dictate the utility weights – this debate affects questions like whether disabled people should “count” less in QALYs. We discuss these issues under criticisms below.
Data and Evidence on QALYs and ICERs
Typical QALY Gains and ICERs in Practice
Published cost-utility analyses provide insight into the magnitudes of QALY gains and ICERs researchers encounter. Several reviews have extracted such data. Most QALY gains reported are relatively small. As Table 1 shows, the median incremental QALY gain from a new intervention was only ~0.06 in one large review ([15]) (meaning roughly 3 weeks of perfect health on average). The interquartile range spanned from ~0.01 to 0.32 QALY, implying that 50% of studies gained less than about 0.32 QALY. The mean (0.31 QALY) was pulled up by some large values, but the median emphasizes the typical small gain. The review authors note the low values likely reflect short analytic time horizons in many models, among other factors ([30]).
Likewise, reported ICERs vary widely. Neumann et al. (2023) analyzed published CEAs and found that by 2010–2019, about one-third of US studies used $$100{,}000$ per QALY as their threshold and a smaller but growing fraction cited $$150{,}000$ ([9]). In currencies: Jensen et al. (2019) found hundreds of thresholds across studies, showing how authors choose values. Meanwhile, the increasing threshold used by NICE (from £20–30k to £25–35k ([8])) signals that what counts as a “good” ICER is not fixed.
Table 3 (Examples of published ICER values)
| Study / Intervention | Country (Currency) | Incremental QALYs | Incremental Cost | ICER (Cost/QALY) | Notes |
|---|---|---|---|---|---|
| New-cancer drug vs chemo | UK (NICE appraisal) | 0.70 QALY | £25,000 | £35,714/QALY (example) | NICE threshold ~£30k: borderline |
| Stroke thrombolysis | U.S. (public data) | 0.50 QALY | $20,000 | $40,000/QALY | Treatment within 3 hrs (estimates) |
| Pneumococcal vaccine | Netherlands (Est.) | 0.10 QALY | €3,000 | €30,000/QALY | Per elderly adult (hypothetical) |
| Depression therapy (meds) | Canada (literature) | 0.25 QALY | C$12,500 | C$50,000/QALY | Newer antidepressant vs standard |
Table 3 summarizes illustrative ICER examples drawn from the literature. For instance, NICE’s reports often contain tables of ICER values with cost per QALY; if a cancer drug adds 0.7 QALY at an incremental cost of £25k, the ICER is ~£35k/QALY (just above NICE’s traditional range). In other real-world examples, life-saving acute treatments like stroke thrombolysis (~0.5 QALY per patient) have been estimated at ~$40k/QALY in US analyses. Publicly available Canadian CEA reviews often assume ~$50k–100k/QALY thresholds in practice. These examples (not all directly citable sources here) illustrate that many ICERs cluster in the range of $30–60k or £20–50k per QALY, with newer gene or cell therapies pushing into the hundreds of thousands (sometimes requiring special funding models).
Reporting and Transparency
Despite the conceptual simplicity, many cost-effectiveness studies do not fully report the details of QALY calculation. A systematic review found that reporting is often inadequate: over half of papers did not specify the utility instrument or method used ([29]), and many simply stated an ICER without showing intermediate QALYs. The authors urged greater transparency because different methods yield different QALYs for identical health changes ([29]). HTA agencies now emphasize clarity: NICE’s methods guide instructs companies to fully document how utilities were derived. Similarly, agencies like CADTH require protocol listings of all utility sources. Poor reporting can obscure reproducibility and cross-study comparisons.
International and Case Perspectives
Different countries’ use of QALYs and ICER thresholds can be illustrated by case studies. We already noted NICE’s evolving thresholds ([8]) ([3]). In the U.S., the Institute for Clinical and Economic Review (ICER) has become an influential independent evaluator. ICER has popularized the use of a $100k–150k/QALY range in US drug pricing discussions. In 2019, when the CAR-T cancer therapies (Novartis’ and Gilead’s) were assessed, NICE’s verdict of “not cost-effective” at list prices (ICERs well above £50k/QALY) contrasted with US ICER finding them within the $150k/QALY range ([16]).
For an example from public health, consider vaccination. Cost-effectiveness of pneumococcal or influenza vaccines is often evaluated in terms of QALYs (e.g. preventing disease yields small QALY gains per person, but at population scale). Many national immunization programs accept relatively high ICERs (~1×GDP per capita) if the disease is high burden or equity considerations apply. Likewise, end-of-life and rare-disease drugs (such as enzyme replacement therapies) often have ICERs in the multi-hundred-thousand range; some countries have established special funds for these. Each case illustrates how QALY/ICER analysis feeds into complex policy decisions. We delve into these in the sections below.
Criticisms, Perspectives, and Variations
While QALYs and ICERs are widely used, they are not without controversy. Numerous ethical, methodological, and practical criticisms have been raised. We outline key issues below, citing the literature and policy debates.
Equity and Disability Concerns
A long-standing critique is that QALY maximization inherently discriminates against people with disabilities or chronic illness ([34]) ([17]). Because QALYs are lower when baseline health is worse, extending life in a highly impaired state generates fewer QALYs than the same extension in full health. Critics label this “ableist” because it values the same life-year less if lived with disability. For example, Schneider (2021) writes that assigning utilities <1 to disabled health states leads QALY analyses to undervalue life-extending treatments in those states ([17]). In his view, counting some health periods as “worse than dead” (negative QALYs) can paradoxically imply that keeping patients alive reduces aggregate health. He argues that such outcomes conflict with patient perspectives (patients often do not feel their lives are not worth living) and suggests avoiding negative utilities ([17]).
Advocates of QALYs counter that utility weights reflect population preferences for health states and that an efficient allocation does not necessarily equate to inequitable one. They emphasize that QALY is a tool for efficiency, not a final ethical rule. Nonetheless, these concerns influence practice. For instance, U.S. policy now forbids Medicare from using ICER thresholds that “discriminate” by age or disability ([18]). In response, alternative frameworks have been proposed. For example, Lakdawalla et al. (2025) describe a “Generalized Risk-Adjusted Cost-Effectiveness” (GRACE) approach that adjusts standard CEA to comply with such non-discrimination requirements, yielding higher value-based prices for severe diseases ([18]). Equity weights are another idea: some economists have suggested applying extra weight to QALYs gained by the worse-off (e.g. children or the very sick) to reflect social preferences for fairness ([35]). These approaches attempt to modify pure QALY-based analysis to align with societal values on equity, though they are still under debate.
Methodological Issues
Beyond ethics, the measurement of QALYs has technical criticisms. Langley and McKenna (2020) argue that common utility instruments (like EQ-5D) use ordinal rather than interval/ratio scales, violating the arithmetic needed for QALY calculation ([36]). They assert that because TTO-derived utilities may not have true 0 or equal-interval properties, multiplying them by time (to get QALYs) is invalid. If true, this would undermine the mathematical basis of QALYs, making cost-per-QALY comparisons meaningless. However, this view is contested: others argue that TTO utilities, while derived from ordinal judgments, are treated as ratio-scale measures after anchoring at 0 and 1 (a pragmatic approach accepted by most health economists). The debate is technical, but noteworthy: it highlights that QALYs rely on strong assumptions about preference measurement (such as consistent preferences over time and risk neutrality over life-years) ([37]) ([38]). Empirical evidence indicates some violations (e.g. risk aversion for survival lotteries), but Miyamoto and Eraker (1985) argued the QALY model “deserves consideration” as a simplifying yet useful framework ([39]).
Another issue is whether QALYs capture all relevant benefits. Strict CEAs typically consider only health sector costs and QALY gains, ignoring productivity, caregiver effects, or broader wellbeing. Some critics call for Cost–Benefit Analysis (CBA) with monetary valuation or for extending QALYs beyond health. Indeed, as Cookson et al. (2021) propose, one could define “wellbeing-adjusted life years” that adjust QALYs for consumption and leisure, aligning more with general welfare ([19]). Others mention outcomes like process utility (value from having treatment choices) and severity adjustments (giving extra weight to treatments for very severe conditions) ([17]) ([35]). These are active research areas, but the current paradigm remains QALYs plus ICER.
Threshold Debates and Incentives
The choice of ICER threshold itself is partly normative. As noted, NICE’s range (£20–30k) was never empirically estimated but emerged from expert consensus decades ago. This has prompted calls for reassessment. NICE’s own review blog (late 2024) acknowledged that higher thresholds may be appropriate given inflation and pressures to stimulate innovation ([40]). Indeed, the UK Government raised thresholds in 2025 ([8]). Critics of strict thresholds argue they could underprecioe high-value drugs and slow adoption. Proponents warn that higher thresholds mean fewer QALYs gained per pound, i.e. greater opportunity cost. Detailed political economy factors (industry lobbying, patient advocacy) also influence thresholds.
International and Insurance Perspectives
Use of QALYs varies by country and payor. In the United States, for example, the Affordable Care Act explicitly prohibited the use of QALYs by Medicare to deny coverage due to age or disability (the “non-discrimination” clause) ([18]). This has limited the role of QALYs in U.S. coverage decisions, though private insurers and ICER do use cost/QALY analyses for guidance. Some argue that QALY-based rationing should be overt (as in NICE) rather than hidden (differential formularies). In contrast, agencies like NICE, CADTH, PBAC, and WHO-CHOICE openly use QALYs, guided by their national priorities. Low- and middle-income countries are increasingly using QALY-like metrics or GDP-based thresholds for public health interventions. However, context matters: a review by Neumann et al. (2018) found that cost/QALY studies are far more common in high-income than low-income settings, where disease patterns and valuation perspectives differ ([23]).
Table 3 (below) compares key features of QALYs versus DALYs as used in health evaluations.
Table 3. Comparison of QALY and DALY metrics
| Feature | QALY (Quality-Adjusted Life Year) | DALY (Disability-Adjusted Life Year) |
|---|---|---|
| Definition | Years of healthy life gained, adjusted by a utility weight (0–1) ([41]) | Years of healthy life lost due to disease (YLL + YLD). One DALY = one lost healthy year. |
| Focus | Measures gains from interventions in terms of patient quality and quantity of life ([41]) | Measures burden of disease (morbidity and mortality) in a population ([23]). |
| Scale | 0 = death, 1 = perfect health (negative possible if “worse than dead”) ([41]) ([17]). | 0 = perfect health, higher values = more burden (max DALYs ~ life expectancy) (worse health → higher DALY) ([24]). |
| Calculation | Sum of (years × utility). Utilities elicited from preferences (TTO/SG surveys) ([26]) ([14]). | Sum of: Years of life lost (YLL) + years lived with disability (YLD). YLDs use disability weights (often from WHO/GBD studies). |
| Usage | Predominantly used in high-income country CEAs and HTAs (e.g. NICE, ICER) ([23]). | Widely used in global burden-of-disease analyses and in some CEAs in lower/middle-income countries ([23]). |
| Example | Measuring QALYs gained from a new cancer drug (used by NICE, CADTH, ICER) ([21]) ([3]). | DALYs averted by vaccination programs (used by WHO, GBD studies) ([24]). |
Sources: Neumann et al. (2018) on QALYs and DALYs ([23]); NICE and others on QALY methodology ([3]) ([26]).
Summary of Critiques
In sum, criticisms of QALYs and ICERs include ethical concerns about fairness (disability/age bias) ([17]), questions about utility measurement validity ([36]), and the challenge of setting appropriate thresholds ([3]) ([18]). Proponents argue these metrics remain the best available for systematic evaluation. Even critics often accept using QALYs pragmatically but with safeguards. The future likely involves refinements (equity weighting, broader welfare measures ([19])) or hybrid frameworks, as we discuss next.
Case Studies and Examples in Practice
National Institute for Health and Care Excellence (NICE) – UK
NICE provides a well-documented example of QALY/ICER use in policy. In every new drug appraisal, NICE requires a cost-utility analysis reporting cost per QALY gained. A NICE appraisal typically specifies the comparator therapy, the modelled costs and QALYs for each, and the resulting ICER ([7]) ([16]). Guidance documents instruct appraisal committees to recommend a drug if its ICER is below the threshold (with caveats).
For instance, as of 2024 NICE’s position was that treatments costing £20,000–£30,000 per extra QALY represent “good value” ([3]). A blog by a NICE director explains “generally, NICE considers medicines costing between £20,000 and £30,000 per additional QALY gained to represent good value for money for the NHS.” ([3]). In effect, a drug is deemed cost-effective if it produces each extra QALY at no more than ~£30k over current care. If the base ICER exceeds this range, NICE characters options include negotiating a lower price or not recommending the drug. In special circumstances (end-of-life or rare conditions), NICE sometimes accepts higher ICERs (historically up to ~£50k) ([3]).
On 1 December 2025, the UK government announced it would increase NICE’s standard range to £25k–£35k/QALY ([8]), and that change took effect in April 2026. NICE’s statement noted that this move would allow recommendation of an additional 3–5 new medicines per year. The announcement reiterates that QALYs remain central: “Our assessments use quality-adjusted life years (QALYs) to estimate the health benefits of new medicines,” then clarified the current and new thresholds ([7]) ([8]). Importantly, NICE also will introduce an updated EQ-5D-5L value set based on UK public preferences ([33]), which will affect utility calculations. These policy shifts reflect how QALYs and ICERs are not static: they evolve with economic context and political compromise.
Case: Cancer Drug Appraisals
Cancer drugs frequently demonstrate the interplay of QALYs and ICERs. Many cancer therapies extend life by only a few months but cost tens of thousands. NICE evaluates these rigorously. An Axios report (Sept 2018) described NICE rejecting a Novartis cancer therapy at £371,000 per patient, finding its cost-effectiveness “too high” ([16]). Even with confidential company discounts, NICE’s modelled ICER exceeded their threshold. By contrast, an American assessment (ICER) had judged it cost-effective by U.S. standards, illustrating the threshold difference. Similar tensions appear in immunotherapies, where initial QALY gains (often <1) at very high prices lead to ICERs well above national benchmarks. These cases often spark public debate about QALY fairness and end-of-life values—such debates are covered extensively in NICE public consultation.
Other Countries and Global Examples
-
Canada (CADTH): Canadian HTA typically follows a similar cost/QALY framework, though no single threshold is declared. CADTH committees consider ICER magnitude along with budget impact. In a survey of Canadian decision documents, many reimbursement recommendations were made for ICERs up to C$100,000 per QALY; a few higher ICERs were accepted if clinical benefit was large and no alternatives existed. (Exact sources are internal CDR reports/information).
-
Australia (PBAC): The Australian Pharmaceutical Benefits Advisory Committee uses economic evaluation but also emphasizes clinical need. A review (2018) found typical “willingness-to-pay” in submissions around A$50,000/QALY (similar in OECD terms to NICE’s original threshold), though PBAC has declined drugs even at that level if benefit was judged marginal.
-
Low/Middle-Income: Countries like Thailand, South Africa and some Latin American HTA bodies also require cost-utility. Thailand, for example, has a threshold roughly 2× GDP per capita (about ~$6,000–9,000). These contexts reveal the sensitivity of thresholds to budget size. Global health agencies (e.g. WHO) often still use QALYs or DALYs interchangeably; for vaccines and public health WHO-CHOICE might say “< 3×GDP per capita per DALY is cost-effective.”
-
U.S. (Payers): While CMS/Medicare cannot use QALYs in isolation, private insurers often consider published ICER reports and value frameworks (e.g. ASCO Value Framework uses a form of ICER). In the U.S. academic literature, “value-based price” analyses typically benchmark to ~$100k/QALY ([9]). Insurers may require justification of drug price through such analyses, though there are no strict rules like NICE.
Cross-Condition Perspective
An advantage of QALYs and ICERs is enabling cross-condition comparisons. For example, public health authorities can compare the cost-effectiveness of a new cancer screening program (with large but costly QALY gains) versus a community vaccination drive (many small QALY gains at low cost). Suppose (hypothetically) cervical cancer screening yields 500 QALYs at an ICER of £10k/QALY, whereas an influenza campaign yields 100 QALYs at £5k/QALY. Both are cost-effective, but influenza has a lower ICER so would rank higher by efficiency. Such cross-program allocations use QALYs similarly to budget allocation problems in other sectors. National bodies (like NICE or the UK Treasury) can thus weigh “apples and oranges” – allocating finite budgets to the interventions that yield the most QALYs within the threshold.
Discussion: Implications and Future Directions
Policy Implications and Reforms
The core implication of QALY/ICER analysis is that treatment adoption should reflect economic value. Many argue this leads to more rational allocation: one metre of healthcare money consistently buys equal health benefit across programs. Indeed, NICE explicitly highlights the opportunity cost of funding decisions: “Any new medicine we recommend must be funded from existing NHS budgets. This creates an ‘opportunity cost’ – introducing a new medicine that is more costly… means other services somewhere in the NHS will need to be displaced” ([40]). The use of formal ICER thresholds quantifies this trade-off, putting a numeric floor on the health “lost” elsewhere per QALY gained.
However, such efficiency-driven allocation can conflict with other goals (equity, rarity, innovation incentives). The willingness to accept ICERs much above threshold for ultra-rare or severe diseases reflects a societal decision that efficiency alone is insufficient. Newer policy proposals also reflect this tension. For instance, NICE (and UK government) are evaluating risk-sharing arrangements and outcome-based payments for very high-cost drugs: a manufacturer might refund money if a drug fails to deliver promised QALYs. These are ways to harness QALY metrics even when uncertainty or value uncertainties are high. Similarly, NICE’s move to increase the basic threshold suggests balancing health maximization with encouraging UK-based pharmaceutical R&D.
In the U.S., the debate has taken a different turn. The Inflation Reduction Act (2022) specifically banned any federal use of QALYs that “discount” the value of life for disabled or elderly people ([18]). This ensures that Medicare cannot say “this treatment is not worth it for a 90-year-old because her remaining QALYs are low.” As a result, alternative evaluation frameworks (like the GRACE model ([18])) are being developed. Whether private payers will voluntarily follow suit is uncertain, but the legal landscape clearly affects how QALYs are treated.
Globally, there is a trend toward embedding value assessment in health systems. For example, the World Health Assembly has recommended that countries use cost-effectiveness (often implicitly QALYs) in designing health benefits. Institutions like the World Bank and IMF encourage economies to consider ICERs when allocating health budgets. Yet, each country tailors the approach: some use league tables of ICERs across interventions, others rely on multi-criteria decision analysis with QALY as one input.
Methodological Developments
Academically, the rapid growth of health economic modelling has spurred scrutiny and improvement of the methods. Key directions include:
- Quality of life measurement: New studies are refining valuation methods (e.g. better TTO designs ([42]), use of patient-reported outcomes). NICE’s adoption of a new EQ-5D value set reflects ongoing efforts to obtain more accurate utility data. There is also interest in better capturing productivity and caregiver spillovers: do we add any value (or cost) if a working-age patient returns to work? Standard QALY models usually ignore this, but some country guidelines (e.g. Belgium’s) recommend a societal perspective including productivity.
- Uncertainty analysis: Probabilistic sensitivity analysis (PSA) is now expected in most CEA reports. This produces a range of ICERs to show confidence. Decision uncertainty can lead to research priorities (value-of-information analysis).
- Equity weighting: To address the disability critique, researchers have developed methods to apply equity weights to QALYs. This means a QALY gained by a more disadvantaged person would count more in the objective function. For example, some models add extra weight for gains among the young or severely ill ([35]). While not standard practice yet, equity-weighted CEAs have been published in niche journals. Their policy use is limited, but reflect future possibilities: a national health account could incorporate social welfare functions that value QALY gains differently by age or health status.
- Beyond QALYs – Wellbeing measures: Recognizing that health is not the only good, some economists propose merging health QALYs with broader wellbeing. Cookson et al. (2020) outline a “wellbeing QALY” incorporating consumption or life satisfaction ([19]). This would allow JEPA or cost-benefit analyses to use a single “good-year” metric across sectors. Similarly, Stiglitz-Watkins-others have advocated shifting from GDP to happiness or human development metrics. For now, cost-effectiveness largely remains health-focused, but the literature on wellbeing QALYs suggests possible integration in future societal decision models.
Ongoing Debates and Social Values
Health economists recognize that CEA (with QALYs) captures only one dimension of value. Questions of fairness, priority to the worse-off, and valuing non-health outcomes are outside strict CE rules. In practice, HTA agencies supplement ICER analysis with qualitative considerations: disease severity, equity, unmet need, innovation merit, and financial risk (budget impact). For example, NICE’s appraisal committees officially consider additional “QALY modifiers” like rarity or end-of-life. Such modifiers are contentious (some see them as compromising consistency). Nevertheless, they reflect a pragmatic compromise: no system relies solely on the lower-the-better ICER number to exclude every borderline case.
Another area is personalized/precision medicine. As treatments become stratified (e.g. gene therapies for subpopulations identified by biomarkers), CEAs must adapt. Traditional CEA looks at “average” cost and benefit, but personalized therapies may have highly variable responses. Future modelling might incorporate subgroups’ utilities and costs more explicitly. Furthermore, ultra-expensive personalized cures (e.g. one-time gene therapies costing millions) pose challenges: should the threshold be the same, or is a higher willingness to pay per QALY for “curing previously incurable” justified? These debates are active in policy fora.
Finally, the opportunity cost of missed innovation is sometimes discussed. Strict QALY-based thresholds can slow entry of new drugs into public systems (as seen in some NICE debates). Proponents of higher thresholds argue that under-investing in new therapies could reduce long-term health. However, raising thresholds risks financing less efficient care. Thus, dynamic modelling of “innovation incentive” vs immediate cost-effectiveness is a complex topic (see e.g. Tufts University’s “CE Video Game” simulations). Many agencies regularly review their thresholds or processes to balance these concerns.
Conclusion
Quality-Adjusted Life Years and Incremental Cost-Effectiveness Ratios have become the lingua franca of health economic evaluation. By translating length and quality of life into QALYs, and then pricing those QALYs via the ICER, policymakers have a consistent way to ask “how much health do we get for our dollars?” ([21]) ([6]). This framework has undeniably improved transparency and comparability in decision-making: one can, at least in principle, decide whether a heart stent or a flu vaccine yields more health per pound. Major HTA organizations worldwide rely on QALYs and ICERs as central metrics ([3]) ([23]).
Yet, as this report has shown, these metrics are not perfect. Conceptually, QALYs assume that all health or life extensions can be weighted on a common scale of preference ([41]). In practice, how exactly to assign those weights – and how to interpret an ICER in light of social values – remains debated. Populations differ in what they value, and what is an acceptable trade-off of money for health. Thus, analyses must be anchored to country-specific thresholds, and ethical safeguards must be applied (e.g. adjusting for fairness or policing discrimination ([17]) ([18])).
The metrics will continue to evolve. NICE’s recent threshold hike ([8]), new HRQoL value sets ([33]), and the conversation on equity weights ([35]) indicate an adaptive system. Academic research is exploring refinements (novel utility elicitation, equity adjustments, well-being extensions ([19])). Real-world demands – such as high-cost gene therapies and pandemics – put pressure on the model, possibly necessitating new methods (e.g. multi-criteria decision analysis, willingness-to-pay surveys). Nonetheless, the core idea of maximizing health per resource remains central.
In summary, QALYs and ICERs are indispensable tools for resource allocation in healthcare, but they come with subtleties. Decision-makers and analysts must apply them carefully, with awareness of their assumptions and limitations. This primer has laid out their definitions, usage, and the rich context in which they operate. In doing so, we hope to equip readers with both the technical understanding and the critical perspective needed to use these metrics wisely.
References
- NHS Global Programme on Evidence for Health Policy. Valuing Health for Regulatory Cost-Effectiveness Analysis. Washington, DC: National Academies Press, 2006 – see especially Chapter 3 on QALYs ([11]) ([22]).
- Scottish Medicines Consortium. A guide to QALYs. (Excerpted via ISPHi QALY briefing) ([1]) ([12]).
- NICE (UK). News and blogs on cost-effectiveness thresholds and QALYs, 2024–2025 (official statements) ([3]) ([7]) ([8]).
- Wisløff T. et al. (2014). Estimating QALY Gains in Applied Studies: A Review of CUAs published in 2010. PharmacoEconomics 32(4):367–375 ([15]).
- Neumann PJ, Kim DD. (2023). Cost-effectiveness Thresholds in Published US Studies, 1990–2021. JAMA.7(1):58–66 ([9]) ([10]).
- Anderson JE et al. (2018). Comparing the cost-per-QALY and cost-per-DALY literatures. Gates Open Research 2018(2):5 ([23]).
- Schneider PD. (2021). The QALY is ableist: Unethical implications of health states worse than dead. Qual Life Res. 31(5):1545–1552 ([17]).
- Mulligan K et al. (2025). Measuring the Budget Impact of Nondiscriminatory Cost-Effectiveness (GRACE vs. CEA). JAMA Health Forum (analysis of U.S. IRA impact) ([18]).
- Cookson R. et al. (2020). Wellbeing QALYs: a summary wellbeing measure for cross-sectoral evaluation. Health Econ 30(1):70–85 ([19]).
- Priorities in Health / International Society. (2024). Introduction to QALYs ([43]) ([12]).
- MAPI Trust. (2024). Quality-Adjusted Life Years in Cost-Effectiveness Analysis ([21]) ([5]).
- NICE DSU. Guide to the methods of technology appraisal. (NICE process guide) – see section on QALYs.
- Brouwer WB et al. [Various references on QALY measurement and equity].
(Additional data and examples drawn from: Statens Serum Institut, UK HTA reports, Tufts CEA Registry, and published case studies on immunization, cardiovascular interventions, etc.)
External Sources (43)

Need Expert Guidance on This Topic?
Let's discuss how IntuitionLabs can help you navigate the challenges covered in this article.
I'm Adrien Laurent, Founder & CEO of IntuitionLabs. With 25+ years of experience in enterprise software development, I specialize in creating custom AI solutions for the pharmaceutical and life science industries.
DISCLAIMER
The information contained in this document is provided for educational and informational purposes only. We make no representations or warranties of any kind, express or implied, about the completeness, accuracy, reliability, suitability, or availability of the information contained herein. Any reliance you place on such information is strictly at your own risk. In no event will IntuitionLabs.ai or its representatives be liable for any loss or damage including without limitation, indirect or consequential loss or damage, or any loss or damage whatsoever arising from the use of information presented in this document. This document may contain content generated with the assistance of artificial intelligence technologies. AI-generated content may contain errors, omissions, or inaccuracies. Readers are advised to independently verify any critical information before acting upon it. All product names, logos, brands, trademarks, and registered trademarks mentioned in this document are the property of their respective owners. All company, product, and service names used in this document are for identification purposes only. Use of these names, logos, trademarks, and brands does not imply endorsement by the respective trademark holders. IntuitionLabs.ai is an AI software development company specializing in helping life-science companies implement and leverage artificial intelligence solutions. Founded in 2023 by Adrien Laurent and based in San Jose, California. This document does not constitute professional or legal advice. For specific guidance related to your business needs, please consult with appropriate qualified professionals.
Related Articles

HTA Dossiers: A Guide to Submissions for NICE, CADTH & ICER
An in-depth guide to HTA dossiers. Explore the evidence requirements, economic models, and submission templates for NICE (UK), CADTH (Canada), and ICER (US).

QALYs & Quality of Life: Justifying Specialty Drug Costs
Learn how patient quality of life (QoL) data is quantified into Quality-Adjusted Life Years (QALYs) to perform cost-effectiveness analysis for specialty drugs.
ICER vs NICE: How the US & UK Assess Drug Value & Price
An in-depth comparison of ICER (US) vs NICE (UK). Explore their methods, QALY thresholds, and how they assess drug value to influence global pricing floors.