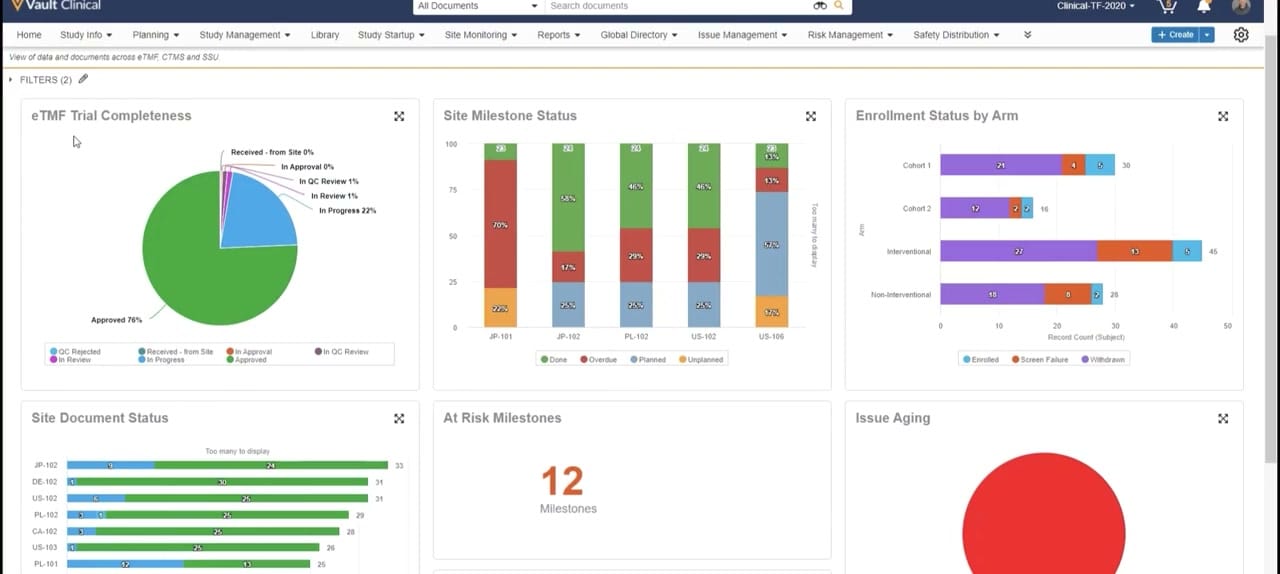
What this Study Startup screenshot shows
This reference page describes the dashboard interface of Veeva Vault Study Startup, displaying various clinical trial metrics. The interface presents a consolidated view of study startup progress, document statuses, and milestone tracking across multiple sites. A top navigation bar provides access to clinical operations areas such as Study Info, Planning, Study Management, and Study Startup. Below the navigation, a sub-header notes that the dashboard displays data and documents across eTMF, CTMS, and SSU. The main workspace is organized into a grid of visual widgets, including pie charts, stacked bar charts, and single-value indicators. These widgets display synthetic demonstration data representing trial completeness, milestone statuses, enrollment by arm, site document status, at-risk milestones, and issue aging. This layout provides clinical operations teams with a centralized location to monitor high-level study metrics.
Visible interface elements
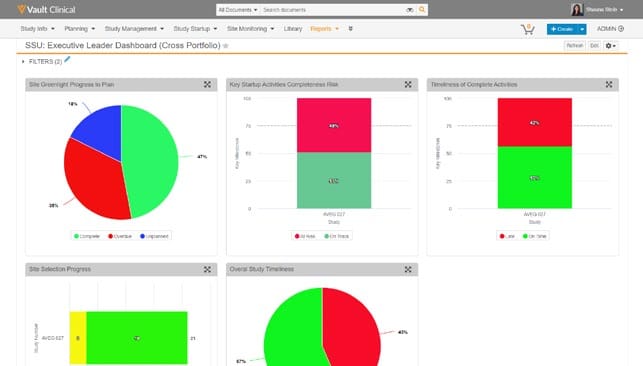
- eTMF Trial Completeness pie chart showing document status percentages such as Approved and In Progress.
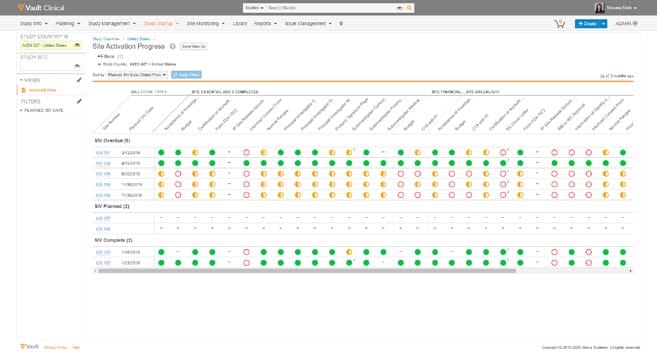
- Site Milestone Status stacked bar chart displaying Done, Overdue, Planned, and Unplanned milestones for specific site codes.
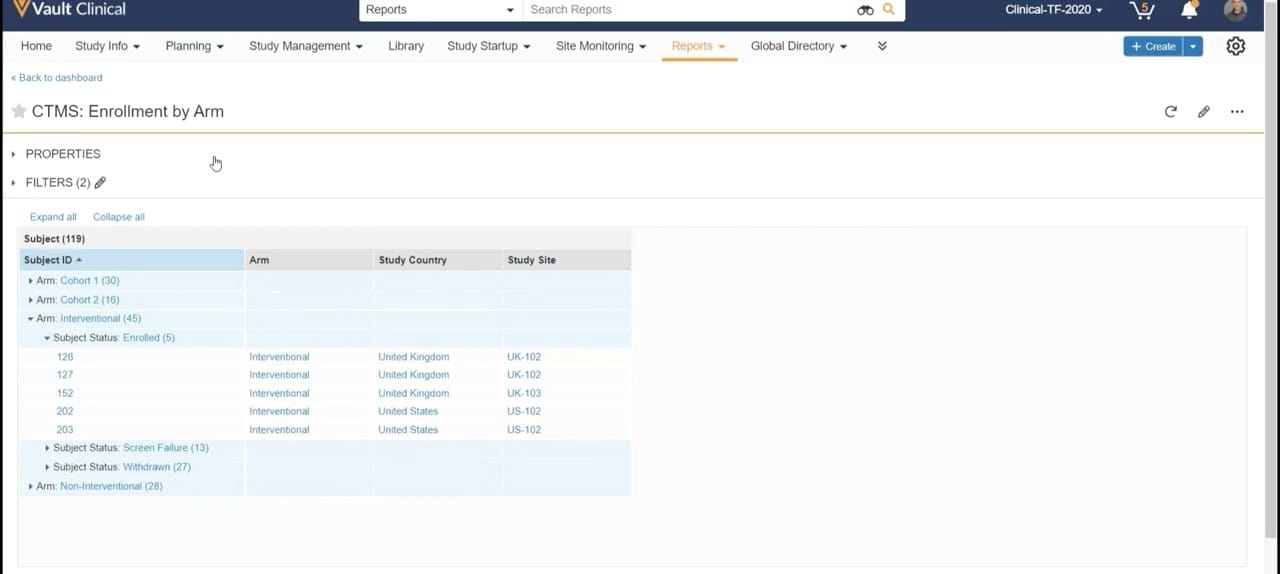
- Enrollment Status by Arm horizontal bar chart showing subject counts for Enrolled, Screen Failure, and Withdrawn categories.
- At Risk Milestones widget displaying a prominent count of twelve milestones.
- Site Document Status horizontal bar chart tracking document counts across multiple site identifiers.
- Global navigation bar with dropdown menus for Study Info, Planning, Study Management, and Study Startup.
- Filters bar showing two active filters with an edit icon.
Interface details
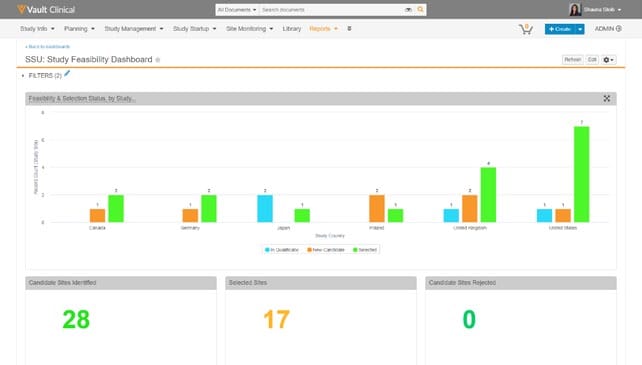
The interface features a structured grid layout containing six distinct reporting widgets. On the top left, the "eTMF Trial Completeness" pie chart displays document status percentages, such as Approved at seventy-six percent and In Progress at twenty-two percent. Next to it, the "Site Milestone Status" stacked bar chart tracks progress across specific site codes like JP-101 and US-102, categorizing milestones as Done, Overdue, Planned, or Unplanned. The "Enrollment Status by Arm" horizontal bar chart displays subject counts for cohorts and interventional arms, segmented by Enrolled, Screen Failure, and Withdrawn statuses. In the bottom row, the "Site Document Status" horizontal bar chart lists document counts across sites, while the "At Risk Milestones" widget highlights a single count of twelve milestones in orange text. The "Issue Aging" widget displays a pie chart representing unresolved issues. A collapsible "FILTERS (2)" bar sits above the widgets, allowing users to refine the displayed dataset. The global header includes a search bar, a "+ Create" button, and navigation dropdowns for managing clinical trial workflows.
Workflow context
In clinical operations, monitoring startup metrics is essential for identifying bottlenecks and ensuring timely site activation. The visible dashboard can support study managers in tracking key performance indicators across multiple study sites. For example, the "Site Milestone Status" widget could help users identify which sites have overdue milestones, allowing them to allocate resources or intervene where necessary. The "At Risk Milestones" indicator provides a quick reference to potential delays that could impact the overall trial timeline. Additionally, the "eTMF Trial Completeness" and "Site Document Status" charts can assist teams in verifying that essential regulatory documents are being collected and approved in accordance with study requirements. By presenting these metrics in a single view, the interface can help clinical teams maintain visibility over site feasibility, qualification, and activation progress, supporting more informed decision-making during the critical startup phase of a clinical trial.
Source, version, and interpretation limits
The analyzed image is a screenshot from the Veeva Study Startup Unified Demo, published around 2020. It displays a configured dashboard with synthetic demonstration data, including mock site codes, milestone counts, and document statuses. Because this is a static screenshot, it cannot establish that the displayed data is real-time, complete, or automatically updated. Actual user interfaces, available widgets, and configuration options may vary depending on the specific Veeva Vault release, customer configurations, and active modules. The presence of specific tabs and fields reflects a demonstration environment and does not represent a standard or mandatory system setup.
Authoritative references
Use these primary sources to confirm current product positioning, terminology, and release-specific behavior.
- Veeva Study Startup Unified Demo(Official Veeva hosted demo)
- Veeva Study Startup product overview(Official Veeva product page)
- Veeva Study Startup features(Official Veeva resource)