What this Study Startup screenshot shows
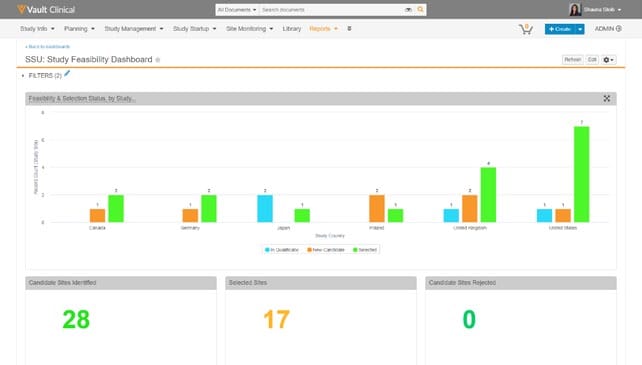
This reference page displays the "SSU: Study Feasibility Dashboard" within the Veeva Vault Clinical interface, specifically highlighting the Study Startup (SSU) module. The dashboard provides a visual summary of site feasibility and selection progress across multiple countries. It features a main bar chart titled "Feasibility & Selection Status, by Study..." which categorizes study sites by country and status, including "In Qualification," "New Candidate," and "Selected." Below the primary chart, three summary cards display key metrics: "Candidate Sites Identified" with a count of 28, "Selected Sites" with a count of 17, and "Candidate Sites Rejected" showing 0. This interface serves as a centralized reporting view for clinical operations teams to monitor site selection pipelines during the early stages of clinical trial planning.
Visible interface elements
- "SSU: Study Feasibility Dashboard" title with a star icon.
- "Feasibility & Selection Status, by Study..." bar chart categorized by country.
- Color-coded legend indicating "In Qualification," "New Candidate," and "Selected" statuses.
- "Candidate Sites Identified" metric card displaying the number 28.
- "Selected Sites" metric card displaying the number 17.
- "Candidate Sites Rejected" metric card displaying the number 0.
- Top navigation bar showing active "Reports" tab and other clinical modules.
- "FILTERS (2)" collapsible panel with an edit pencil icon.
Interface details
The user interface follows the classic Veeva Vault Clinical layout, featuring a top navigation bar with tabs such as Study Info, Planning, Study Management, Study Startup, Site Monitoring, Library, and Reports. The active tab is "Reports," which hosts the "SSU: Study Feasibility Dashboard." Directly below the dashboard title, a collapsible "FILTERS (2)" section allows users to refine the displayed data. The main visualization is a multi-colored bar chart that plots the record count of study sites on the y-axis against study countries on the x-axis. The countries shown include Canada, Germany, Japan, Poland, the United Kingdom, and the United States. A color-coded legend at the bottom of the chart distinguishes between three statuses: blue for "In Qualification," orange for "New Candidate," and green for "Selected." At the bottom of the screen, three distinct metric cards present high-level counts in large, colored typography. Action buttons in the upper right corner, including "Refresh," "Edit," and a gear icon, provide options for dashboard customization and data updates.
Workflow context
In the context of clinical trial operations, this dashboard supports the site feasibility and selection workflow. Clinical operations users can utilize these visualizations to track the progress of potential investigative sites as they move through qualification phases. By viewing the distribution of sites across countries like the United States or the United Kingdom, teams can identify geographic areas that may require additional recruitment efforts or administrative focus. The summary cards at the bottom could help coordinators quickly assess overall progress toward site activation targets, such as comparing the number of identified candidates against those already selected. This structured presentation of site status data can support decision-making during the critical startup phase, helping teams allocate resources to countries or sites that are lagging in the qualification pipeline.
Source, version, and interpretation limits
The screenshot is sourced from an official Veeva Study Startup datasheet and represents a 2020-era user interface. The data displayed, including site counts, country names, and user profiles, is synthetic demonstration data and does not represent actual clinical trial metrics. Because this is a static image, it cannot confirm real-time data synchronization, automated updates, or active integration with live clinical databases. Additionally, the specific layout, labels, and available filters may vary depending on individual customer configurations, administrative permissions, and subsequent Veeva Vault software releases.
Authoritative references
Use these primary sources to confirm current product positioning, terminology, and release-specific behavior.
- Veeva Study Startup datasheet(Official Veeva PDF)
- Veeva Study Startup product overview(Official Veeva product page)
- Veeva Study Startup features(Official Veeva resource)