What this CTMS screenshot shows
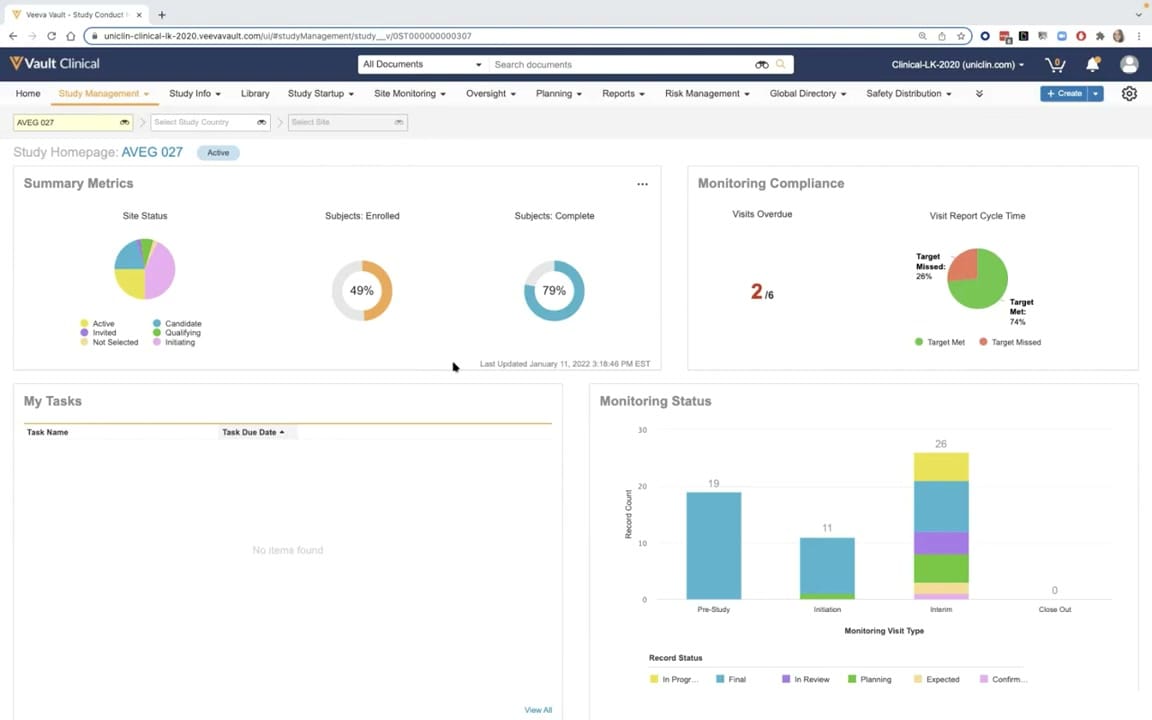
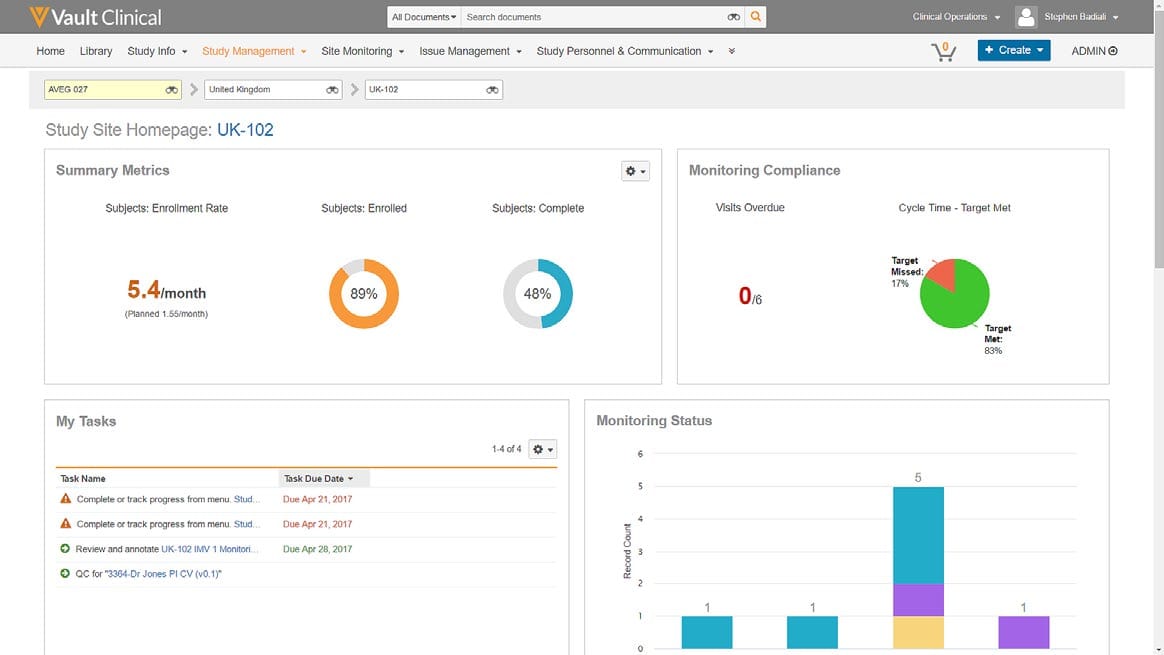
This public interface reference displays the Study Site Homepage for site UK-102 within Veeva Vault CTMS, configured for the AVEG 027 study in the United Kingdom. The dashboard provides clinical operations teams with a centralized view of site-specific performance metrics, monitoring compliance, and outstanding tasks. The layout is divided into four main visualization panels: Summary Metrics, Monitoring Compliance, My Tasks, and Monitoring Status. These panels present key performance indicators such as enrollment rates, subject completion percentages, visit compliance, and task lists. The interface utilizes a clean, widget-based design with visual aids like donut charts, pie charts, and stacked bar graphs to facilitate rapid assessment of site progress. This homepage serves as an operational hub for clinical trial managers and monitors to track site-level activities and address pending actions.
Visible interface elements
- Breadcrumb trail showing the hierarchical path from study AVEG 027 to site UK-102.
- Summary Metrics panel featuring numerical enrollment rates and two circular donut charts.
- Monitoring Compliance panel displaying overdue visits and a target cycle time pie chart.
- My Tasks table listing four specific operational tasks with associated due dates.
- Monitoring Status stacked bar chart illustrating record counts across multiple categories.
- Global navigation bar with tabs for Study Info, Study Management, and Site Monitoring.
- User profile indicator in the top right corner showing Stephen Badiali.
Interface details
The interface is structured with a global navigation header at the top, featuring search capabilities, a user profile menu, and primary tabs such as Study Management and Site Monitoring. Below this, a breadcrumb trail establishes the context, showing the study AVEG 027, the country United Kingdom, and the site UK-102. The main body contains four distinct widgets. The Summary Metrics panel displays a numerical enrollment rate of 5.4 per month alongside two donut charts representing the percentage of enrolled subjects at 89 percent and completed subjects at 48 percent. To the right, the Monitoring Compliance panel highlights zero overdue visits out of six and includes a pie chart illustrating that 83 percent of cycle time targets were met. The bottom-left My Tasks panel lists four actionable items with due dates and status icons, such as review and quality control tasks. The bottom-right Monitoring Status panel features a stacked bar chart displaying record counts across different categories. Each panel includes configuration options, indicated by gear icons, allowing users to manage the displayed data.
Workflow context
Within the Site Performance and Monitoring workflow, this homepage acts as a critical touchpoint for clinical trial managers and clinical research associates. By aggregating site-level data, the interface supports the continuous oversight of clinical trial execution. Users can monitor enrollment velocity against planned targets, track subject progression through the trial lifecycle, and ensure that monitoring visits are conducted within protocol-specified windows. The My Tasks widget integrates daily operational activities directly into the performance dashboard, allowing coordinators to prioritize urgent actions like document reviews or quality control checks. This consolidated view helps clinical teams identify potential bottlenecks, such as lagging enrollment or missed cycle time targets, and take corrective actions. The workflow emphasizes proactive site management by combining high-level compliance metrics with direct links to pending operational tasks.
Source, version, and interpretation limits
The description is based on a public screenshot from the Veeva Vault CTMS datasheet, representing a configured environment with synthetic demonstration data from 2017. Because this image is a static product brief extract, it does not capture real-time data updates, interactive hover states, or drill-down capabilities. Actual user interfaces, available fields, and specific terminology may vary depending on the software release version, active modules, and individual customer configurations. The visual layout and specific metrics shown, such as the enrollment rates and task lists, are illustrative of typical clinical operations workflows and do not represent actual clinical trial results or specific regulatory compliance statuses.
Authoritative references
Use these primary sources to confirm current product positioning, terminology, and release-specific behavior.
- Veeva Vault CTMS datasheet(Official Veeva PDF)
- Veeva CTMS product overview(Official Veeva product page)
- Veeva CTMS trial-management overview(Official Veeva resource)