What this CTMS screenshot shows
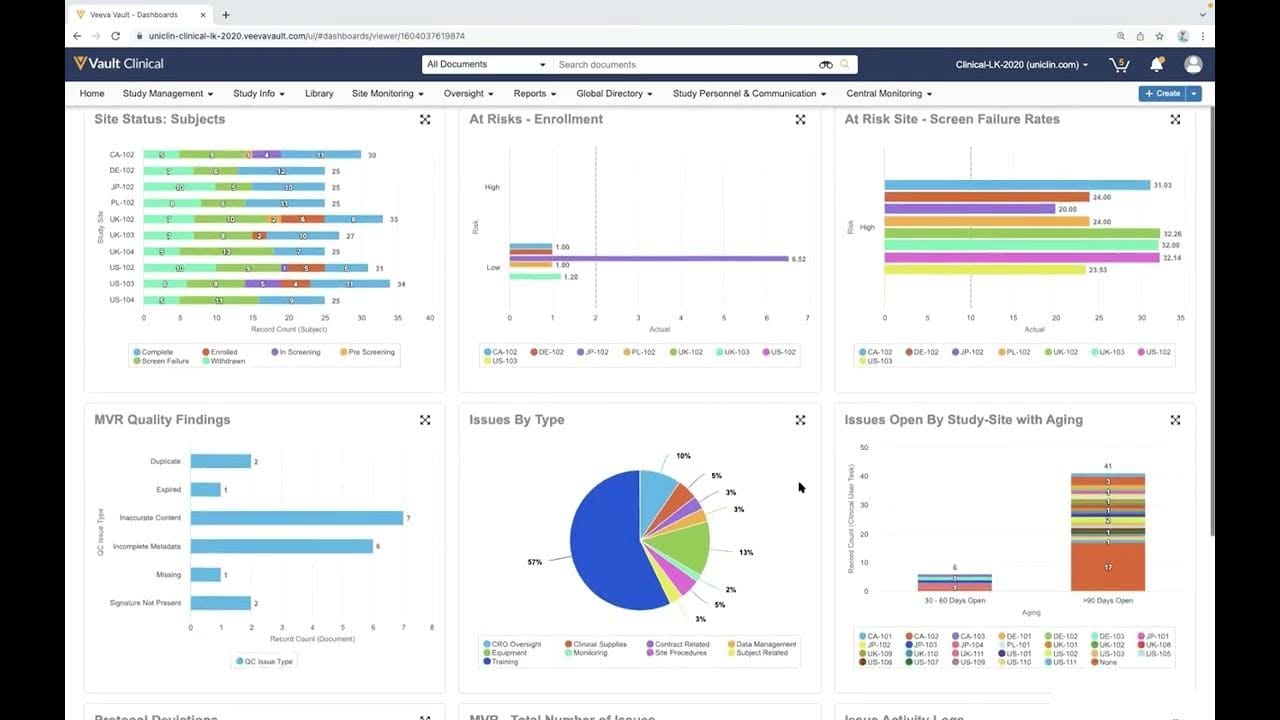
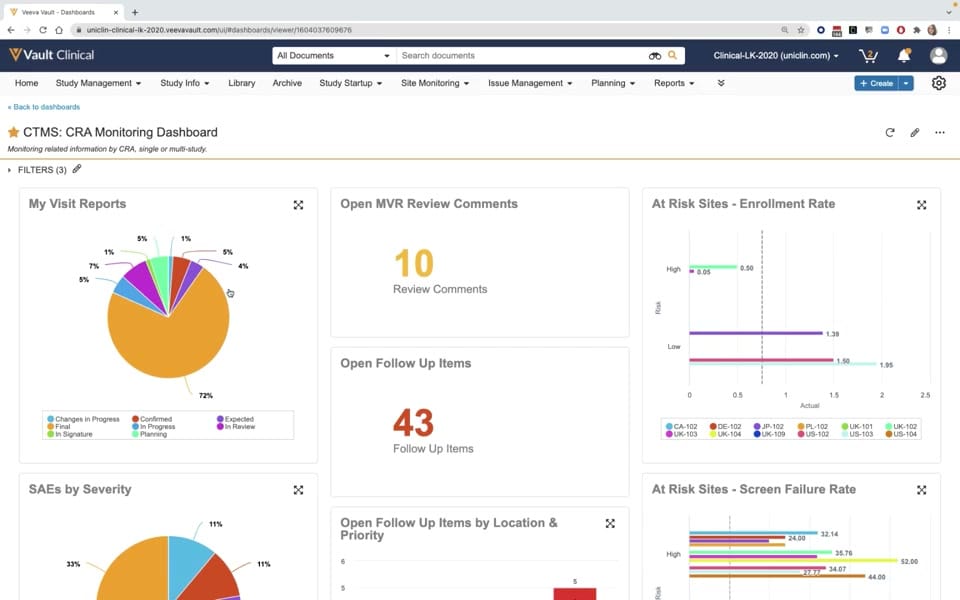
This public interface reference displays the Veeva Vault CTMS CRA Monitoring Dashboard, designed to provide clinical research associates and clinical operations teams with a consolidated view of monitoring activities. The dashboard aggregates key metrics across single or multiple clinical studies, presenting them in a series of visual widgets. Visible components include status tracking for visit reports, open review comments, and outstanding follow-up items. Additionally, the interface displays risk-related metrics such as enrollment rates and screen failure rates across various trial sites. By organizing these metrics into a single, structured layout, the dashboard offers a centralized location for tracking site monitoring progress, identifying potential site-level risks, and managing open action items. The interface features standard Veeva Vault navigation and filtering options to help users refine the displayed dataset.
Visible interface elements
- "My Visit Reports" pie chart displaying report statuses and percentages.
- "Open MVR Review Comments" metric card showing a count of ten.
- "Open Follow Up Items" metric card showing a count of forty-three.
- "At Risk Sites - Enrollment Rate" horizontal bar chart categorized by risk level.
- Top navigation bar with tabs including Site Monitoring and Issue Management.
- Dashboard title "CTMS: CRA Monitoring Dashboard" with a subtitle and filter indicator.
- "SAEs by Severity" pie chart partially visible at the bottom left.
Interface details
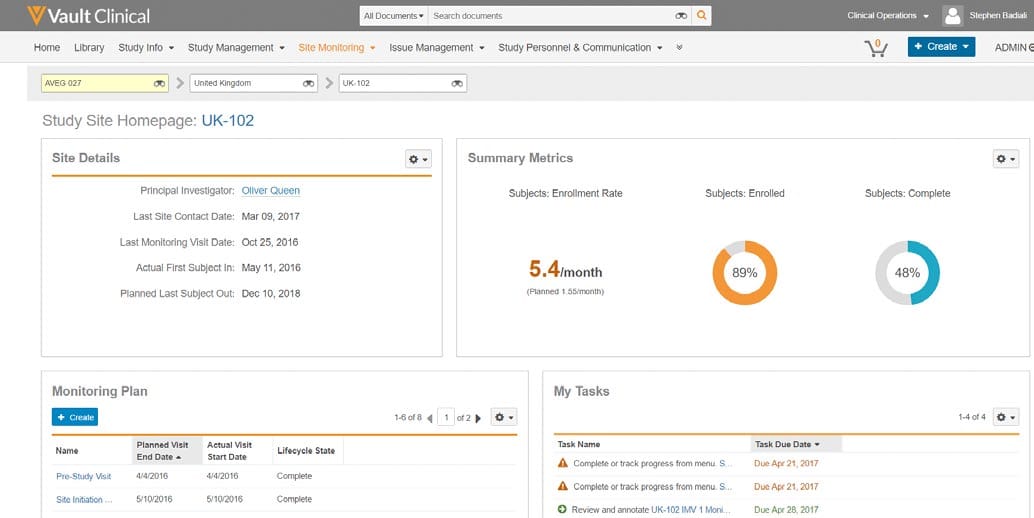
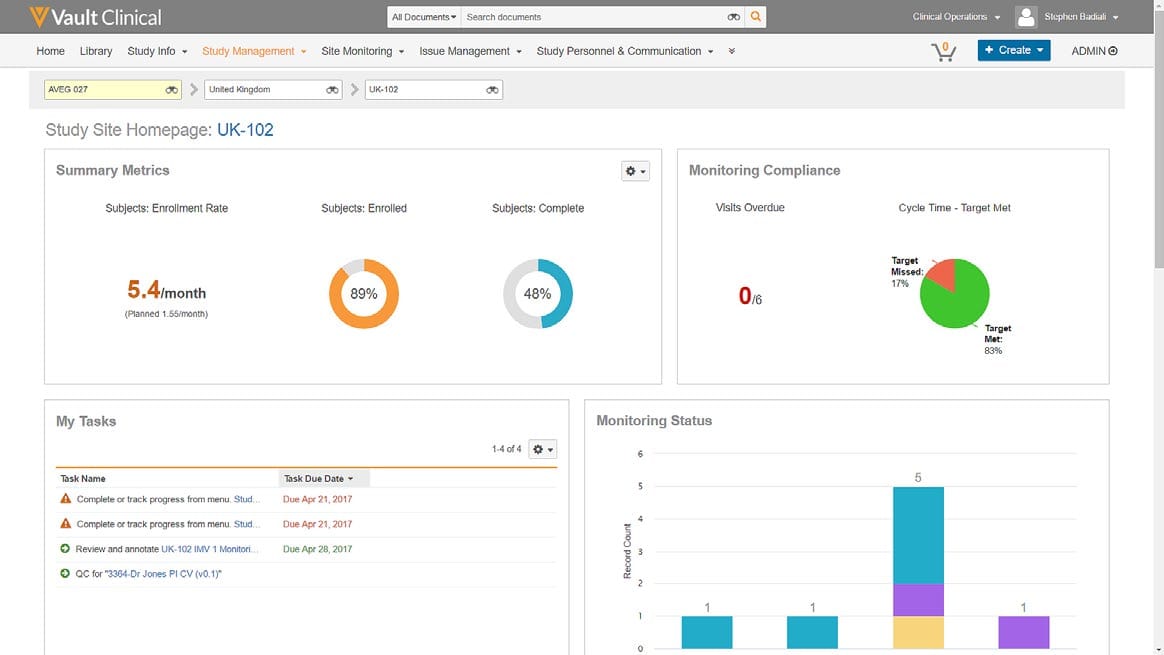
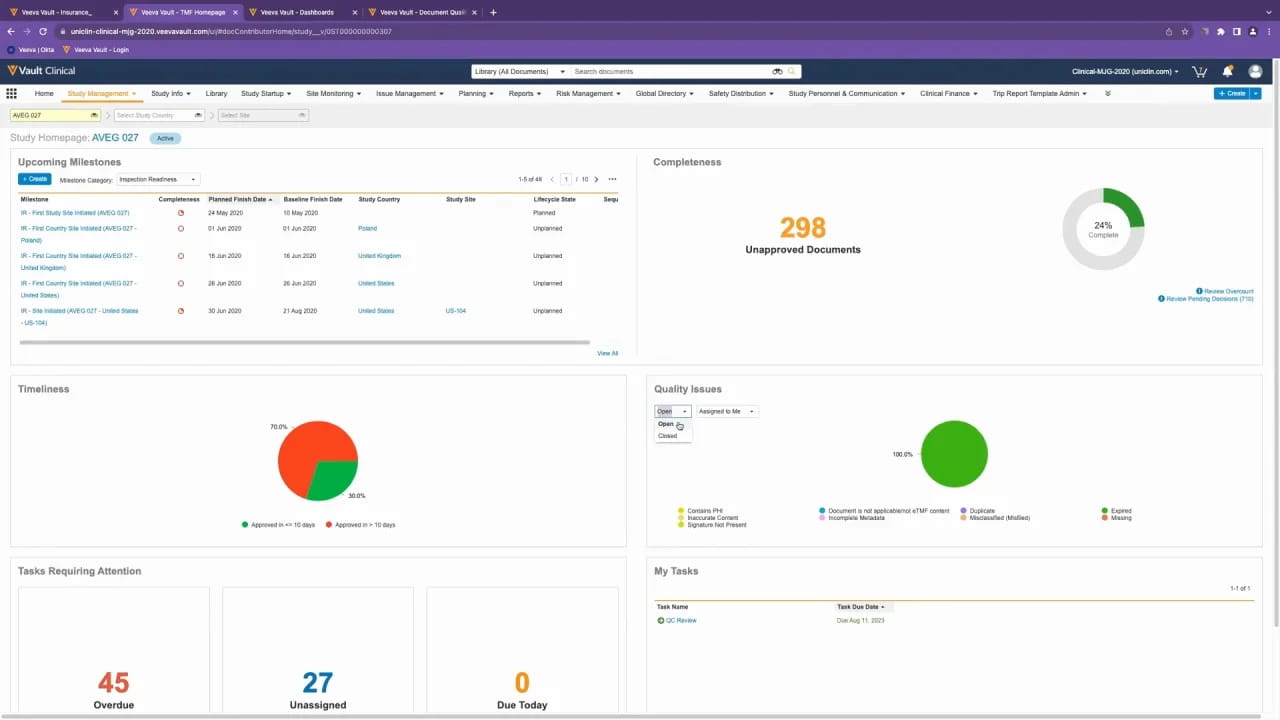
The interface is structured with a top navigation bar containing standard Veeva Vault Clinical tabs, including Study Management, Site Monitoring, and Issue Management. Below the navigation, the dashboard title "CTMS: CRA Monitoring Dashboard" is displayed alongside a subtitle indicating its focus on monitoring-related information by CRA. A collapsible filters panel shows three active filters. The main body of the page is organized into a multi-column grid of data visualization widgets. On the left, a "My Visit Reports" pie chart displays the distribution of monitoring visit reports by status, such as In Progress, Final, and In Review, with a dominant slice representing seventy-two percent of the total. The center column features two numeric summary cards: "Open MVR Review Comments" showing a count of ten, and "Open Follow Up Items" showing a count of forty-three. The right column contains an "At Risk Sites - Enrollment Rate" horizontal bar chart, which plots risk levels against actual enrollment rates for specific site codes. Additional partially visible widgets at the bottom of the screen display serious adverse events by severity and screen failure rates.
Workflow context
In a clinical trial management workflow, a Clinical Research Associate (CRA) or study manager can use this dashboard to monitor site performance and compliance. The "My Visit Reports" chart can support the tracking of monitoring report completion, helping users identify which reports are still in progress or awaiting signature. The numeric indicators for open review comments and follow-up items could help CRAs prioritize their daily tasks, ensuring that outstanding queries and action items are addressed promptly. Furthermore, the risk-related charts, such as the enrollment rate visualization, can support clinical operations teams in identifying underperforming sites that may require additional oversight or corrective actions. By presenting these diverse data points in a single view, the dashboard could help streamline communication between CRAs and study managers, facilitating more efficient trial oversight and risk management across multiple active clinical sites.
Source, version, and interpretation limits
The source of this image is an official Veeva hosted demonstration video from around 2020, representing an older release of the Veeva Vault CTMS application. Because this is a static screenshot of a demonstration environment, the displayed data is synthetic and intended for illustrative purposes only. The visual layout, available widgets, and specific terminology reflect a particular customer configuration and may differ from current production environments or alternative configurations. This static image cannot establish real-time data synchronization, automated workflows, regulatory compliance, or system integration. Users should consult official Veeva documentation for current system capabilities and configuration options.
Authoritative references
Use these primary sources to confirm current product positioning, terminology, and release-specific behavior.
- Monitoring in Veeva CTMS(Official Veeva hosted demo)
- Veeva CTMS product overview(Official Veeva product page)
- Veeva CTMS trial-management overview(Official Veeva resource)