What this Study Startup screenshot shows
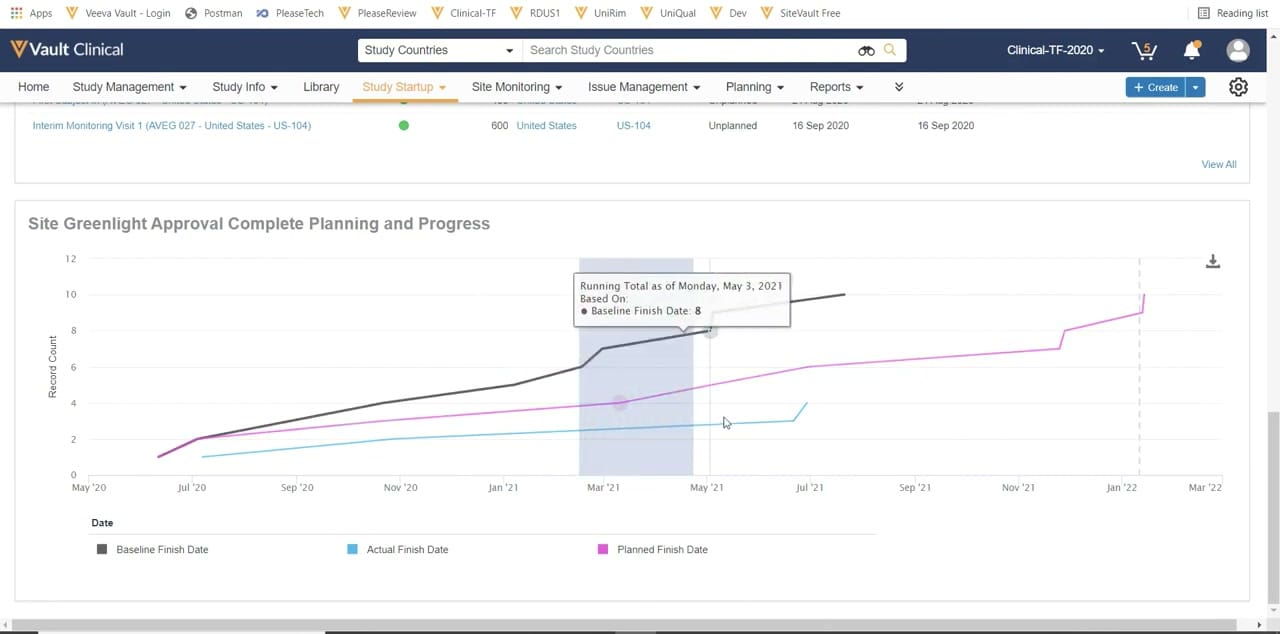
This public interface reference displays the "Site Greenlight Approval Complete Planning and Progress" chart within Veeva Vault Study Startup. The visualization is a line graph designed to track site activation milestones over time, specifically comparing baseline, actual, and planned finish dates. The vertical axis measures the record count from zero to twelve, while the horizontal axis represents a timeline spanning from May 2020 to March 2022. A tooltip is visible on the chart, indicating a running total of eight records for the baseline finish date as of Monday, May 3, 2021. This interface provides clinical operations teams with a visual representation of study startup progress, helping them monitor milestones and identify potential deviations from the original schedule.
Visible interface elements
- Site Greenlight Approval Complete Planning and Progress chart title
- Line graph displaying Baseline Finish Date, Actual Finish Date, and Planned Finish Date
- Interactive tooltip showing a running total of eight for the Baseline Finish Date as of May 3, 2021
- Y-axis labeled Record Count ranging from 0 to 12
- X-axis labeled Date spanning from May 2020 to March 2022
- Veeva Vault Clinical navigation header with tabs including Study Startup and Reports
- Download icon located in the upper right corner of the chart area
Interface details
The interface features a prominent line chart titled "Site Greenlight Approval Complete Planning and Progress." The chart plots three distinct metrics over time: Baseline Finish Date represented by a dark grey line, Actual Finish Date represented by a light blue line, and Planned Finish Date represented by a pink line. A shaded vertical band highlights a specific period on the timeline, and a hover tooltip displays detailed contextual data for a selected point, showing the running total as of a specific date. In the upper right corner of the chart container, a download icon is visible, suggesting options for exporting the visualization. Above the chart, the standard Veeva Vault Clinical header is present, featuring a search bar configured for "Study Countries" and a primary navigation menu with tabs such as Study Management, Study Info, Library, Study Startup, Site Monitoring, and Reports. A breadcrumb or list item for "Interim Monitoring Visit 1" is partially visible at the top, indicating the hierarchical context within the clinical application.
Workflow context
In clinical trial operations, achieving "site greenlight" is a critical milestone that signifies a site is fully approved and ready to begin enrolling patients. This progress chart can support clinical operations managers in tracking the efficiency of their site activation workflows. By comparing the baseline schedule against actual and planned progress, users can identify trends, such as whether site greenlight approvals are falling behind schedule or proceeding as planned. This visibility could help study teams adjust resources, manage expectations with stakeholders, and implement corrective actions if actual finish dates lag behind baseline projections. The chart serves as a key reporting tool within the broader study startup phase, which encompasses feasibility, qualification, and regulatory document collection, ultimately helping teams work toward efficient trial initiation.
Source, version, and interpretation limits
The screenshot is sourced from an official Veeva YouTube demo of the Veeva Vault Study Startup homepage, published in February 2022. The data displayed, including dates, record counts, and specific milestones, represents synthetic demonstration data and should not be interpreted as real-world clinical trial metrics. Because this is a static screenshot, it does not reflect real-time updates, interactive filtering capabilities, or underlying database validation. Additionally, the specific chart configuration, labels, and visible navigation tabs reflect a particular demo environment and may vary based on individual customer configurations, user permissions, and subsequent software releases from Veeva.
Authoritative references
Use these primary sources to confirm current product positioning, terminology, and release-specific behavior.
- Veeva Vault Study Startup Homepage(Official Veeva YouTube demo)
- Veeva Study Startup product overview(Official Veeva product page)
- Veeva Study Startup features(Official Veeva resource)