What this CTMS screenshot shows
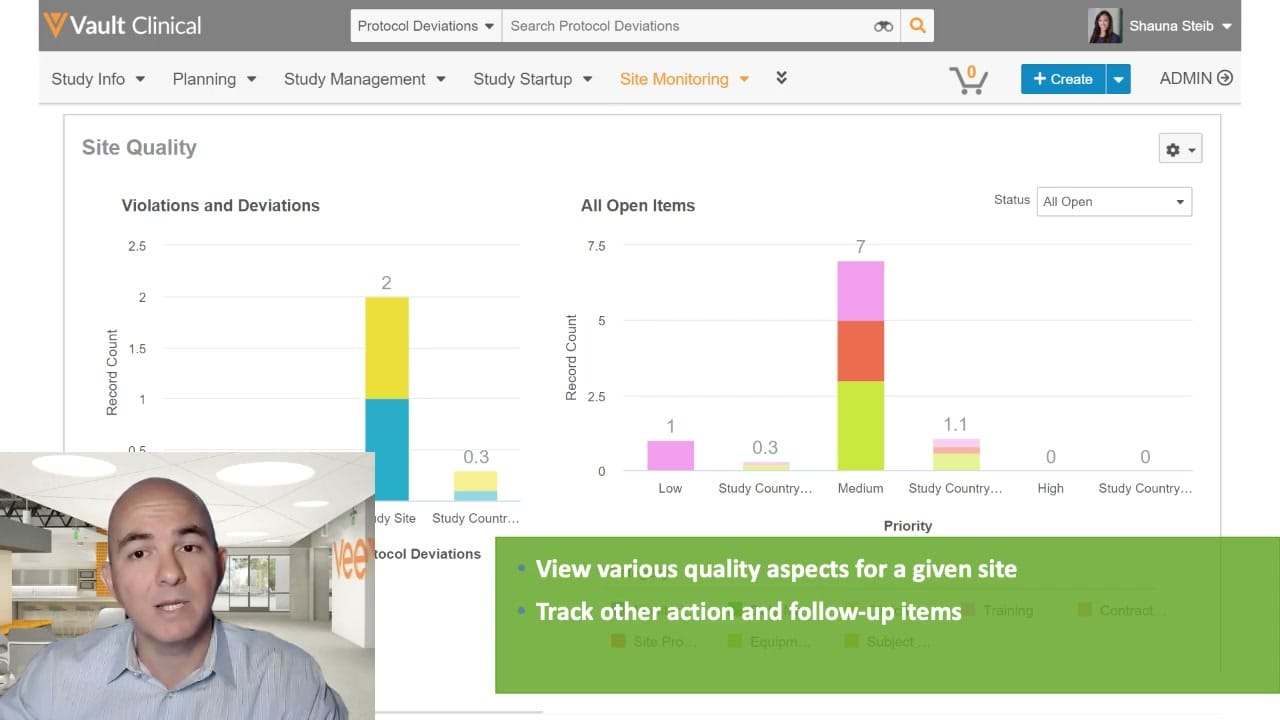
This interface reference shows the Site Quality dashboard within Veeva Vault Clinical, specifically configured for Site Monitoring. The screen displays two main analytical charts: "Violations and Deviations" and "All Open Items." These charts provide visual representations of record counts categorized by site and priority levels, such as low, medium, and high. A status filter dropdown is set to display open items. The top navigation bar includes options for Study Info, Planning, Study Management, Study Startup, and Site Monitoring, alongside a search bar configured for Protocol Deviations. The interface is shown with a presenter overlay in the lower-left corner and a green explanatory text banner in the lower-right corner, which highlights key capabilities like viewing quality aspects and tracking action items.
Visible interface elements
- Site Quality dashboard header with configuration settings icon.
- Violations and Deviations stacked bar chart displaying record counts.
- All Open Items bar chart categorized by priority levels including Low, Medium, and High.
- Status dropdown filter set to All Open.
- Global navigation bar highlighting Site Monitoring in orange.
- Search bar configured for Protocol Deviations next to the Vault Clinical logo.
- Presenter video overlay in the bottom-left corner and a green instructional text banner in the bottom-right corner.
- User profile name Shauna Steib and a Create button in the top header.
Interface details
The interface features a structured layout under the "Site Quality" header. On the left, the "Violations and Deviations" bar chart displays record counts on a vertical axis ranging from 0.5 to 2.5, with stacked colored segments indicating different categories. On the right, the "All Open Items" bar chart plots record counts from 0 to 7.5 against priority levels on the horizontal axis. A dropdown menu labeled "Status" is positioned above the right chart, currently showing "All Open" to filter the displayed data. The top global header contains the Vault Clinical logo, a search bar with a dropdown menu set to "Protocol Deviations," and a user profile for Shauna Steib. Below this, the primary navigation menu highlights "Site Monitoring" in orange. A "+ Create" button and an "ADMIN" link are visible on the far right of the navigation bar. A green promotional or instructional banner overlays the bottom-right quadrant of the dashboard, containing bulleted text regarding site quality and action item tracking, which partially obscures the chart legend.
Workflow context
In clinical trial management, monitoring site quality and tracking open issues are critical for maintaining study compliance and data integrity. This dashboard can support clinical operations users, such as clinical research associates or study managers, by providing a centralized view of deviations and open action items. By visualizing the distribution of issues across different priority levels, users could identify sites requiring immediate attention or additional training. The status filter allows users to focus specifically on outstanding tasks, which can help streamline follow-up activities. Although the displayed data is synthetic, the layout illustrates how a configured Vault CTMS environment can assist teams in prioritizing their monitoring efforts and managing protocol deviations. The interface provides direct access to site monitoring tools, helping users transition from high-level oversight to detailed issue resolution.
Source, version, and interpretation limits
The screenshot is sourced from an official Veeva hosted demo titled "Study Oversight: Track, Manage, and Resolve Issues," published around 2020. A notable limitation of this image is the presence of a presenter video overlay in the bottom-left corner and a green text banner in the bottom-right corner, both of which obscure parts of the underlying user interface, including chart legends and axis labels. Because this is a static screenshot of a demonstration environment, it does not represent real-time data, active system validation, or specific customer configurations. Actual user interfaces and available features may vary depending on the software release and individual organization settings.
Authoritative references
Use these primary sources to confirm current product positioning, terminology, and release-specific behavior.
- Study Oversight: Track, Manage, and Resolve Issues(Official Veeva hosted demo)
- Veeva CTMS product overview(Official Veeva product page)
- Veeva CTMS trial-management overview(Official Veeva resource)