
Veeva Nitro Consulting & Implementation
Unify your commercial data and accelerate insights with the life sciences data warehouse.
Veeva Nitro: The Data Warehouse for Life Sciences
Veeva Nitro is a cloud-based data warehouse and analytics platform built specifically for the pharmaceutical and life sciences industry. Introduced in 2018, Nitro addresses the limitations of traditional custom data warehouses—often plagued by high costs, long implementation cycles, inflexibility, and heavy maintenance burdens. It centralizes disparate commercial data sources (sales, marketing, CRM, third-party data) into a unified repository, accelerating time-to-insight.
IntuitionLabs helps you leverage the full power of Veeva Nitro through expert implementation, data integration, custom analytics development, and AI-powered enhancements. We transform your commercial data into actionable intelligence delivered at the point of execution.
Understanding Veeva Nitro Architecture

Built on AWS Redshift, Nitro provides a scalable, single-tenant data warehouse managed via a multi-tenant cloud service. It employs an ELT (Extract-Load-Transform) pipeline, leveraging Redshift's Massively Parallel Processing (MPP) for efficient data processing, and is designed as an “AI-ready” foundation for advanced analytics.
Key Components & Data Layers:
- STGStaging Layer: Raw data landing zone mirroring source formats.
- ODSOperational Data Store: Normalized, cleansed, and history-tracked data with effective dating (10-year history).
- DDSDimensional Data Store: Curated star schemas (facts & dimensions) optimized for analytics using Veeva's life sciences model.
- RPTReporting Views: `report_current` (latest snapshot) and `report_history` (full history) views for BI tools.
- MIX-Pages / MyInsights Layer: Data prepared for synchronization to Vault CRM X-Pages (or legacy Veeva CRM MyInsights) for offline field access.
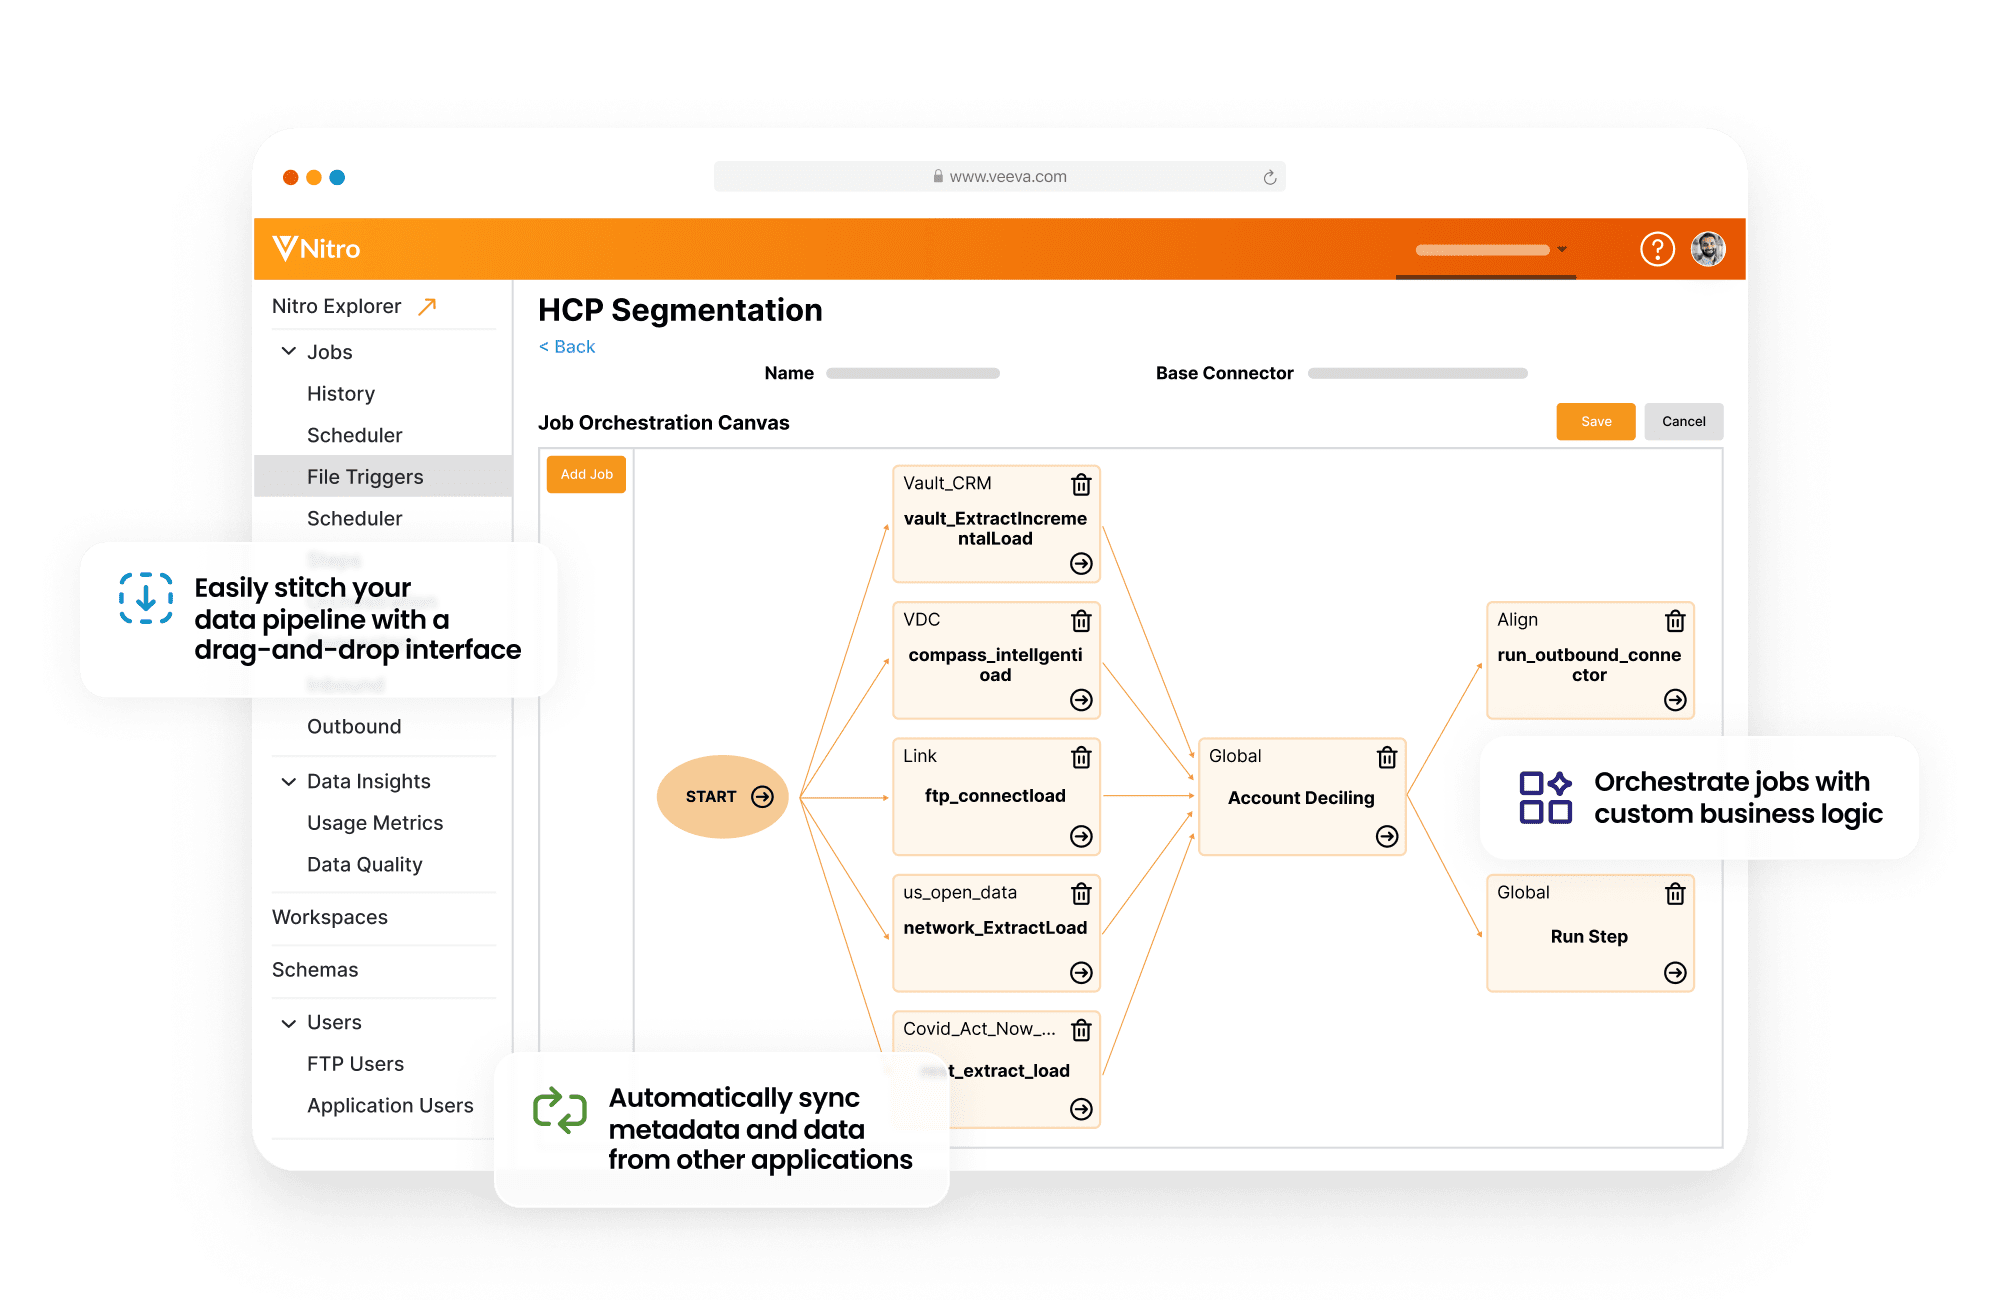
Nitro Jobs (YAML-defined tasks) orchestrate the ELT process, managed via Nitro Packages and the Admin Console.
Life Sciences Optimized Data Model
Historical Data Tracking
Governance and Extensibility
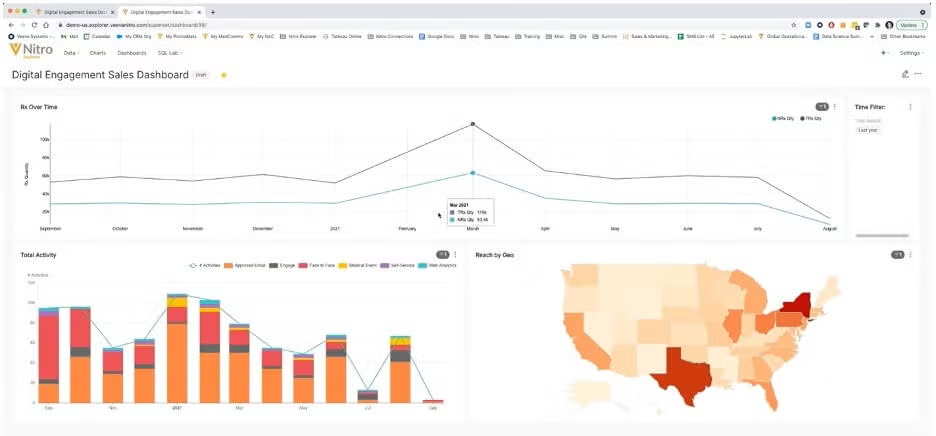
Analytics & Consumption Capabilities
Seamless Data Integration with Nitro Connectors

Connector Types:
- Intelligent Sync Connectors: Auto-adapting connectors for Vault CRM (and legacy Veeva CRM on Salesforce), Vault applications (PromoMats, MedComms), Align, Network, and Salesforce Marketing Cloud. They sync data *and* metadata changes.
- Industry Data Connectors: Out-of-the-box, Veeva-maintained connectors for IQVIA (Xponent, DDD), Symphony Health, Claims data (e.g., LexisNexis), Formulary data (e.g., DRG), Distribution (e.g., McKesson, Cardinal, ValueCentric), Digital Engagement (e.g., Doximity, Medscape, Epocrates), and KOL data (Veeva Link). Reduces customer maintenance burden.
- Custom Connectors: Define file-based ingest (SFTP) for proprietary or niche data sources, mapping them into Nitro's model.
- Outbound Integration: Standard SQL (JDBC/ODBC) access for BI tools (Tableau, Power BI), data science platforms (AWS SageMaker), or data export via SFTP/S3.
Common Veeva Nitro Use Cases
IntuitionLabs Veeva Nitro Services
Maximize the value of your commercial data with our specialized Nitro services
Nitro Implementation & Strategy
Custom Connector Development
Advanced Analytics & AI
Data Model Extension & Customization
X-Pages & MyInsights Dashboard Development
Nitro Health Check & Optimization
Veeva Nitro FAQs
Ready to Unlock the Power of Your Commercial Data with Veeva Nitro?
Contact IntuitionLabs to discuss how our Veeva Nitro expertise can accelerate your analytics journey and drive better business outcomes.
Book a Nitro Consultation