
A Guide to Building SAP Dashboards for Pharma & Biotech

How to Build Dashboards for SAP (Pharma/Biotech Use Cases)
[Revised April 18, 2026] — Updated to reflect SAP Business Data Cloud (announced February 2025), Joule copilot integration in SAP Analytics Cloud, and the end-of-maintenance status of SAP Lumira (end-of-maintenance reached December 31, 2024). Verified that SAP Analytics Cloud and SAP Datasphere remain SAP's recommended cloud analytics stack as of 2026.
Executive Summary
In the data-driven pharmaceutical and biotech industries, effective dashboards are essential for situational awareness, rapid decision-making, and compliance monitoring. Modern SAP-based enterprises leverage specialized BI platforms (such as SAP Analytics Cloud, SAP BusinessObjects, and embedded SAP Fiori/UI5 apps) to integrate disparate data sources from manufacturing, supply chain, finance, R&D, and quality management into unified visual reports. This report investigates the process of designing and implementing SAP-connected dashboards for pharma/biotech, including technology options, data architecture, visualization best practices, key performance indicators (KPIs), and regulatory considerations. We draw on case studies and expert analyses to illustrate successful implementations: for example, a Portuguese pharma company used SAP BI dashboards to provide government healthcare regulators with detailed cost-outcome data, helping to meet cost-containment goals while improving the company’s profitability ([1]). Similarly, Wörwag Pharma centralized its SAP data into SAP Analytics Cloud, yielding “optimized decision-making processes” through integrated analytics ([2]). Industry reports highlight the rapid growth of healthcare and life sciences analytics (projected U.S. BI market growth from $3.3B in 2022 to $8.85B by 2030 ([3])) and the proliferation of modern SAP tools that support self-service dashboards and planning. This report systematically covers the background of SAP in life sciences, dashboard tools and architectures, optimal design methodologies, example KPIs, case examples, and future trends (including AI-driven analytics and cloud integration). All insights are grounded in industry sources and SAP documentation to ensure credibility.
Introduction and Background
Pharmaceutical and biotechnology companies operate in a highly regulated, data-intensive environment. They must manage complex processes — from research and clinical trials to production, quality control (GMP), distribution, and sales — while complying with regulations such as FDA 21 CFR Part 11 and EU GMP Annex 11 ([4]). To remain competitive, these organizations increasingly adopt Enterprise Resource Planning (ERP) and analytics solutions. SAP is a leading provider in this space, offering an integrated “life sciences” ERP suite (SAP S/4HANA for Logistics, SAP Quality Management, SAP Batch, etc.) plus advanced data/analytics technologies through the SAP Business Technology Platform (BTP). Dashboards built on top of SAP provide a consolidated, real-time view of key metrics across all business functions.
Digital Transformation in Life Sciences – The pharmaceutical industry is undergoing rapid digital transformation. Trends such as greater demand forecasts (e.g. during pandemics), pressure to reduce cost of goods and time-to-market, and globalization of supply chains have driven investment in data analytics. According to one industry analysis, pharmaceutical firms are “increasingly data-driven, leveraging Business Intelligence (BI) and dashboard platforms for R&D, clinical operations, manufacturing, and commercial analytics” ([3]). Market research predicts a compound annual growth rate (~13.1%) in the healthcare BI market, reaching about $8.85 billion in the U.S. by 2030 ([3]). Gartner and SAP surveys also indicate that virtually all large life sciences companies are now at least planning ERP upgrades to S/4HANA (“mainstream”) and deploying cloud-native analytics solutions ([5]) ([6]). For example, global pharma leader Roche is “in the middle of an SAP S/4HANA journey with the goal to harmonize business processes on all sites and divisions around the world,” highlighting the scale of digital integration ([6]).
SAP’s Role in Pharma/Biotech – SAP’s portfolio addresses the specific requirements of pharma/biotech. Core modules (MM, PP, SD, QM, PLM, EHS, GRC) capture operational data (inventory, production batches, lab results, quality metrics, personnel training). S/4HANA and BW systems store this data. SAP Analytics technologies (BusinessObjects, Lumira, Analytics Cloud) enable dashboards and reports. SAP also provides industry accelerators (e.g. Industry 4.0 for life sciences) and compliance features. As one analysis notes, SAP’s solutions tackle life sciences challenges by ensuring “full traceability: From raw materials to point of sale, SAP provides end-to-end visibility, which is key for audits and health inspections” ([7]). Integrated planning tools (SAP Integrated Business Planning, SAP Datasphere) leverage AI for demand forecasting and inventory optimization, which is crucial for meeting market demands and reducing waste ([8]).
Why Dashboards Matter – In this context, dashboards synthesize critical metrics into visual, interactive formats for executives and managers. They serve strategic (e.g. KPI scorecards for executives), tactical (e.g. supply chain and production monitoring), and operational (e.g. shop-floor OEE displays) needs. Dashboards facilitate “contextualizing information during the work process to equip users with real-time insights”, as SAP highlights, enabling decisions to be made immediately where work happens ([9]). For life sciences, dashboards can help quickly identify supply disruptions, track quality exceptions, monitor sales by region, and ensure compliance (e.g. training status), all in one interface. Without dashboards, stakeholders rely on fragmented spreadsheets and delayed reports — a problem noted in one industry analysis that sales teams “fly blind” without BI ([10]).
Regulatory Considerations – Crucially, pharma/biotech dashboards must respect regulatory data standards. All electronic records and audit trails within the dashboard environment need to meet CFR Part 11 and EU Annex 11 requirements ([4]). This means SAP systems must control user authorizations, maintain change logs, and validate data integrity. SAP’s integrated ERP helps by embedding quality and compliance controls into production and QA workflows. Dashboards often expose compliance KPIs (e.g. percent CAPAs closed, incidents per batch) which are derived from validated SAP data. In practice, building dashboards for SAP in regulated industries involves ensuring that underlying data models, extract-transform-load (ETL) processes, and visualization layers are all designed under formal change management and validation protocols.
SAP Dashboard Technologies and Architecture
SAP Analytics Tools
SAP provides several dashboard and analytics tools suited to different scenarios (programmable API, cloud vs on-prem, self-service vs embedded):
-
SAP Analytics Cloud (SAC) – A cloud-based, unified BI and planning platform. SAC supports interactive dashboards (Stories) and notebook-style analytics (Analytics Designer), combined with planning workflows. It natively connects to SAP and non-SAP data (live and import), enabling “one tool, one workflow” for analytics and predictive planning ([11]). SAC supports augmented analytics (AI-driven insights) and real-time collaboration.Companies like Wörwag Pharma have used SAC to centralize SAP ERP and BW data in the cloud, noting that it enabled them to “collect this data centrally and use the insights as a basis for optimised decision-making processes” ([2]). SAC is SAP’s flagship for new dashboard projects, particularly where on-demand access and advanced features (machine learning, planning integration) are valued. It also underpins SAP Digital Boardroom (executive meeting dashboards).
-
SAP BusinessObjects Dashboards (formerly Xcelsius) – A legacy client-side dashboard designer (Flash-based) that integrates with SAP data via Universes or web services. Although being phased out, some organizations still maintain BO Dashboards for legacy reports. It offers drag-and-drop charts and input controls for interactive visualizations. Historically, many pharma companies built Xcelsius dashboards (e.g. the Portuguese case study used SAP BusinessObjects Dashboards to help comply with cost targets ([1])). However, SAP’s migration strategy now recommends replacing these with SAC Analytics Designer or SAP Lumira (see next point) ([12]).
-
SAP Lumira / Lumira Designer – A proprietary data visualization tool (on-premise and cloud). Lumira Designer (formerly SAP Design Studio) was a successor to Xcelsius for analytic applications. As of December 31, 2024, SAP Lumira (Discovery and Designer) reached end of mainstream maintenance, and SAP recommends migrating remaining Lumira content to SAP Analytics Cloud Analytics Designer. Organizations running Lumira in 2026 should treat it as a legacy platform scheduled for decommissioning.
-
SAP BusinessObjects Web Intelligence (WebI) – A query/reporting tool in the BI platform. WebI is typically used for paginated reports and ad-hoc queries more than rich dashboards. It can deliver static charts and tables via a portal. WebI can feed data to dashboards (e.g. using LIVEOffice in Xcelsius), but it is not a dashboard tool per se.
-
SAP Fiori/UI5 and Embedded Analytics – On the SAP ERP side, Fiori UX apps can display KPIs and charts. SAP Fiori includes Analytical Apps (e.g. the Smart Business KPI apps) that use real-time OData/CDS queries to show metrics on the S/4HANA interface. Developers can also build custom SAPUI5 dashboard apps (as demonstrated by community examples ([13])). These Fiori apps are ideal for operational dashboards tied to SAP processes (for example, a production supervisor’s dashboard showing shop-floor status in real-time). Unlike SAC, these run entirely within the ERP system and leverage CDS views or BW queries directly. For instance, SAP documentation notes that Fiori-based dashboards allow creation of “dashboard-like application(s) which are not only interesting and intuitive, but also offer a great integrating platform for data from different sources” ([14]).
-
SAP Business Data Cloud / Datasphere / BW/4HANA – In February 2025, SAP announced SAP Business Data Cloud (BDC), a unified SaaS solution that brings together SAP Datasphere, SAP Analytics Cloud, SAP BW, and Databricks capabilities into a single managed data foundation for AI and analytics. BDC is SAP's strategic direction for 2026 and beyond, and it underpins the "Joule" AI copilot across SAP applications. SAP Datasphere (formerly Data Warehouse Cloud) and SAP BW/4HANA remain the underlying analytic data warehouses, hosting consolidated, modeled data for downstream dashboards. In SAP-centric landscapes, it’s common to build data models (Analytical Data Models or HANA Calculation Views) in BW or Datasphere which feed dashboards. For example, in one S/4HANA migration, a company used SAP DataSphere to publish delta SAP data to a data lake, enabling continuous replication into analytics environments ([15]). Whether on-premise or cloud, the SAP data layer is a critical part of the analytics architecture.
-
Other/Third-Party Tools – Some life sciences companies also use non-SAP BI tools (e.g. Microsoft Power BI, Tableau, Qlik). These platforms have connectors for SAP data (via OData, BW queries, or SQL) ([16]) ([17]). However, introducing third-party dashboards often raises additional compliance efforts (validation of separate software) and licensing considerations. It is generally recommended to use SAP-endorsed tools when possible for regulated work. If used, these tools must strictly integrate with SAP back-ends and comply with audit requirements.
The choice among these tools depends on factors such as existing SAP infrastructure (on-prem BW vs S/4HANA vs cloud ERP), user needs (self-service vs standardized reports), and future strategy (cloud adoption, unified planning). SAP’s own guidelines now favor SAP Analytics Cloud/Authored Apps for new deployments ([12]), though skilled teams still build custom dashboards in SAPUI5 or Lumira when needed.
Data Integration and Architecture
Building an SAP dashboard begins with data architecture. Common data sources include SAP ERP modules (Sales & Distribution, Materials Management, PP, QM, etc.), SAP Quality and Manufacturing records, specialized SAP Labs (LIMS) or clinical systems, as well as possibly third-party sources (e.g. EDC for clinical data, CRM, or IoT sensor data from manufacturing equipment). These feeds must be consolidated into a model that the dashboard engine can query efficiently.
-
SAP BW/4HANA or Datasphere – Many SAP landscapes use a central warehouse (BW or Datasphere). This is a staging area that pulls master and transactional data from ECC/S/4 (via DataSources, ETL jobs) and transforms it into InfoProviders or ADSOs. Queries are built on top of these models. Dashboards (SAC, Lumira, or Fiori) can then consume these queries live (e.g. SAC Live Connection to SAP BW). Alternatively, some dashboards connect directly to HANA views in real-time (HANA Live). The decision between a warehouse and live queries depends on performance, data governance, and furniture; often a mix is used.
-
Direct ERP/Other Integration – Some KPI apps (especially Fiori) can query S/4HANA directly using CDS views or OData. For example, a production dashboard might call an OData service to fetch current work center statuses. Cloud solutions like SAC can use SAP Cloud Connector to live-connect to on-prem SAP (S/4 or BW) for real-time data, keeping sensitive data on-site. Batch loads to SAC (data import) are also possible for denormalized models or slower-changing data.
-
Non-SAP Data Sources – Pharma companies often have critical data in non-SAP systems (e.g. LIMS for laboratory data, Document Management Systems for batch records, clinical data in specialized repositories). Modern SAP tools support integration via APIs or flat-file loads. For regulated labs, the data from LIMS can be loaded into SAP BW or DataSphere and then surfaced on dashboards. According to an industry analysis, Qlik and other BI tools can “integrate ERP (SAP/Oracle), LIMS, EDC, and medical devices data” seamlessly ([18]). In practice, integrating these sources requires careful mapping and metadata management, often via SAP Data Services or SAP Integration Suite.
-
Real-Time Data and IoT – In manufacturing and supply chain, there is growing interest in real-time dashboards fed by IoT and advanced sensors (Industry 4.0). SAP’s Business Technology Platform includes solutions (SAP IoT etc.) for streaming data into SAP HANA. Dashboards can then display live equipment performance or cold-chain traceability. The architecture typically involves SAP MII or IoT Bridge sending data to BPM or HANA, which is then exposed to SAC or Fiori apps for real-time monitoring.
Regardless of data sources, governance and quality are paramount. Dashboards should be built on reliable, cleansed data. Pre-built SAP content and best practices (e.g. SAP’s Life Sciences Data Model) can help standardize key metrics. IT and business users must collaborate on data definitions. Master data (products, sites, personnel roles) should be synchronized so that dashboards present a single “golden version” of the truth.
Finally, SAP systems often employ layered data models (raw staging, processed, semantic layers). Dashboards typically query the semantic layer (e.g. BW ADSOs or HANA calculation views) for performance. For example, in one SAP Analytics Cloud project, consultants “adjusted the data model in the BW system (in the area of CO-PA) and developed necessary queries,” then built SAC folders and stories on top ([19]). This illustrates that building a dashboard involves iteration: the data team refines data structures and queries in SAP BW/HANA to ensure dashboards are fast and meaningful, then the front-end team designs the visualizations.
Dashboard Design and Implementation Process
Developing an effective SAP dashboard is a multi-step process involving business analysis, data modeling, application design, and deployment. Key phases include:
-
Requirements Gathering – Identify dashboard goals and users: e.g. executives, plant managers, sales directors, quality managers. Define the key business questions and decisions the dashboard should enable. In pharmaceutical use cases, stakeholders may include compliance officers, supply planners, or trial managers, each needing specific views. Techniques include interviews, workshops, and analysis of existing reports. For instance, the Wörwag Pharma pilot began with a workshop to discuss “general requirements for a future analytics tool,” comparing SAC vs Power BI and mapping needs to functionality ([20]).
-
KPI Definition – Based on requirements, define metrics. Select KPIs that align with strategic objectives. Common pharma/biotech KPIs include production yield rates, cycle times, quality rates, inventory turns, batch compliance, revenue and margin by product, clinical trial timelines, etc. KPI selection should be guided by top-level goals (e.g. “ensure patient safety” or “maximize throughput”). It is critical to ensure that KPIs can be computed accurately from SAP data. (See Table 2 for examples of pharma KPIs.)
-
Data Modeling and ETL – Design the data model that underlies the dashboard. Create or refine SAP BW queries, HANA views, or CDS views so that each KPI is defined with correct logic (e.g. how semi-finished goods are treated, how scrap is counted in yield). Develop ETL processes to bring in all relevant data. At this stage, one may also implement needed SAP configurations (e.g. adding fields, customizing cost centers in CO-PA for pharma specifics). For cloud scenarios, set up live connections or import data into SAC using SAP DataSphere or other connectors. Build data hierarchies (e.g. site > plant, product family > SKU) to support drill-down. Ensure that real-time requirements are addressed (e.g. using SAP BW ODP or CDS with SAP S/4 for live data).
-
Prototype and Design – Create initial dashboard prototypes (wireframes or sketches). Lay out charts, tables, and filters. Use SAP design guidelines: prioritize clarity and relevance ([21]). For balance, emphasize high-level summary metrics with drill-down to details. Use consistent color semantics (e.g. red/green for bad/good). SAP’s own design best-practices advise that dashboards should meet “the structural, visual, and content-related needs of your end users” ([21]) and follow graphing best-practices (avoid clutter, use appropriate chart types). Since pharma stakeholders may not be technical, the UI should be intuitive. For instance, a dashboard for a manufacturing manager might have tiles showing batch yield, OEE, and top 3 delayed orders, each clickable to see details.
-
Development – Build the dashboard using the chosen tool. In SAP Analytics Cloud, this means creating a Story or Analytics Designer application. In BusinessObjects Dashboards, it means dragging components and linking to queries. In Fiori, it involves configuring KPI tiles or developing UI5 code with embedded charts. Populate visualizations with sample data first, then connect to real SAP queries. Implement interactivity: filters, selection, drill-through to detailed reports. For example, a pharma sales dashboard might allow filtering by drug type or region. Ensure performance by optimizing queries (aggregations, proper indexing). If using SAC, features like “Story filters” and “Bookmarks” help with personalization.
-
Validation and Compliance – Rigorously test data accuracy: compare the dashboard values to source transactions. In regulated industries, this may involve validation documentation. Validate navigation and user behavior. Ensure security roles are applied (only authorized users see certain data). Audit the connectivity: e.g. verify that SAC Live Connections respect SAP S/4 HANA authentication and that all data flows are logged. It may be necessary to run a process to formally validate the dashboard as a “computerized system” under FDA guidelines.
-
User Acceptance and Training – Conduct user acceptance testing (UAT) with actual end-users. Solicit feedback to refine the design (often multiple iterations). Provide training on dashboard use, interpretation of metrics, and self-service features (if enabled). Integration of the dashboard into business workflows is key; for example, if a dashboard is meant to support daily production meetings, ensure the screen and reporting schedule align with that meeting’s start time.
-
Deployment and Maintenance – Deploy the dashboard to production and schedule it for regular updates (real-time or periodic). Monitor performance (loading times, concurrency). As business needs change (new products, processes, regulations), update the dashboard and underlying models. Establish support processes (change request, bug fixes, enhancements).
In practice, these steps often overlap and cycle. For example, Wörwag Pharma’s project started with an SAP strategy workshop and ended with a decision in favor of SAC to remain future-proof; they noted that SAC fit their SAP-centric landscape, which included modernizing to S/4HANA and BW/4HANA ([19]). Similarly, SAP advocates an agile approach: build proof-of-concept dashboards quickly, then expand iteratively, which helps gain user buy-in.
Table 1: SAP Dashboard Tools and Platforms
| Tool/Platform | Description | Pharma/Biotech Use Cases |
|---|---|---|
| SAP Analytics Cloud (SAC) | Cloud-based unified BI & planning platform. Uses live or import data. Offers interactive Stories and Analytics Designer apps, with AI insights and mobile access. | Corporate performance dashboards, financial and operational KPI reporting, integrated planning (e.g. sales & operations planning in pharma) ([2]). |
| SAP BusinessObjects Dashboards (Xcelsius) | Legacy on-prem interactive dashboard designer. Uses end-user data visualizations, connected via SAP Universes or web services. | Smaller or legacy deployments; e.g. earlier pharma projects for sales/marketing dashboards ([1]). (Now often migrated to SAC) ([12]). |
| SAP Lumira Designer | On-premise visual analytics and storyboarding tool (formerly Design Studio). Connects to HANA/BW. | Customized analytical apps, often used in IT templates. Could support ad-hoc analytics or R&D visualizations. |
| SAP BI Web Intelligence | Report/query tool in SAP BI Platform. Produces interactive reports and simple charts. | Ad-hoc analysis by business users (e.g. finance analysts running sales queries). Less common for executive dashboards. |
| SAP Fiori / UI5 Apps | Web-based UI framework on SAP S/4HANA or BTP. Includes Smart Business KPI tiles and analytical apps (ALP/ODP) that display key metrics in Fiori Launchpad. | Role-specific dashboards integrated into S/4 workflows (e.g. production KPIs for shop floor, quality metrics for QA dashboards) ([13]). Suited for managers needing real-time data. |
| Other BI Platforms (Power BI, Tableau, Qlik) | Third-party BI tools with connectors to SAP HANA/BW. Offer rich visuals and flexibility. | Used occasionally by IT-savvy firms; may supplement SAP tools for visualization. Example: a company might use Power BI for sales territory dashboards, but must ensure strict compliance processes. (SAP connectors available ([16]).) |
Key Performance Indicators (KPIs) for Pharma/Biotech
Dashboards must focus on metrics that align with pharma/biotech objectives. While KPIs vary by organization and function, typical examples include:
-
Commercial / Sales Metrics – Market share, revenue (by product/region), NBRx (new-to-brand prescriptions), TRx (total prescriptions), NRx (new prescriptions), sales growth rate, and average price. These reveal how products are performing financially. (Bold BI cites NBRx/TRx among standard pharma KPIs ([22]).)
-
Manufacturing / Operations Metrics – Batch yield %, throughput, Takt Time, Lead Time, production capacity utilization, on-time completion rate, and Lot Acceptance Rate (LAR)[% of batches passing inspection]. They may also include Production Quality Cycle Rate (PQCR) or Overall Equipment Effectiveness (OEE). These measure production efficiency and throughput. (For example, Bold BI highlights LAR and PQCR as key production KPIs ([22]).)
-
Quality & Compliance Metrics – Number/rate of Out-of-Specification (OOS) deviations, CAPA (Corrective/Preventive Action) closure rate, audit findings count, product recall incidents, and validation statuses. In biotech R&D, this may extend to clinical QAs. Dashboards often flag any open CAPAs or missed training sessions, tying to regulatory compliance (e.g. training compliance for 21 CFR Part 11).
-
Supply Chain Metrics – Inventory Days on Hand, stockout rate, order fill rate, supplier delivery performance, and cold-chain temperature excursions. These impact cost and continuity of supply. In pharma, track supply performance for critical raw materials and finished products.
-
Financial Metrics – Revenue vs budget, gross margin, cost-of-goods-sold, variance analysis (cost, expense), and profitability by product or segment (CO-PA if using SAP Controlling). These provide the business-level view and are usually included in executive dashboards.
-
Research & Development Metrics – Pipeline by stage, time-in-stage for drug development, R&D spend vs budget, number of active clinical trials, trial enrollment rates. For biotech, early discovery metrics or immunogenicity assay results might appear. (These often come from separate systems but can be integrated for executive overview.)
-
HR/Workforce Metrics – Training compliance percentage, headcount, attrition rate, overtime hours. These may be less central to SAP HR but can be included via integration with SuccessFactors.
Each dashboard should visualize relevant KPIs. For example, a sales dashboard could chart NBRx and TRx over time by region, while a manufacturing dashboard shows batch yields and Takt time by plant, and a quality dashboard shows open deviations and CAPAs. As emphasized by Bold BI, monitoring both production KPIs (LAR, PQCR, Takt Time) and sales KPIs (NBRx, TRx, NRx) “in one place” empowers teams with actionable insights ([22]). Table 2 (below) summarizes representative KPIs by functional area.
Table 2: Example Pharma/Biotech KPIs by Functional Area
| Functional Area | Example KPIs / Metrics |
|---|---|
| Sales & Marketing | Total Sales, Market Share, NBRx/NRx/TRx, Sales Growth, Sales Visits/Calls, Lead Conversion Rate |
| Manufacturing | Batch Yield (%), Takt Time, Cycle Time, Production Throughput, OEE, LAR (Lot Acceptance Rate), PQCR |
| Quality & Compliance | OOS Rate, CAPA Closure %, Audit Findings, Deviation Count, Document Change Orders, Validation Status |
| Supply Chain | Inventory Days on Hand, Order Fill Rate, On-Time Delivery %, Excess / Obsolete Inventory, Supplier Performance |
| Finance | Revenue, Gross Margin %, Budget Variance, Cost per Unit, CO-PA Profitability (by product/customer) |
| R&D / Clinical | Pipeline Stage Count, Average Time-in-Stage, Time to IND/NDA, R&D Spend vs Plan, Trial Enrollment Progress |
| HR & Safety | Training Compliance %, Headcount by Function, Turnover Rate, Safety Incidents |
In practice, dashboard design should concentrate on a handful of KPIs per view (often 4–8 graphs or tiles) to avoid overload. Drilldowns or filter options let users explore details. Dashboards should be interactive: for instance, a sales leader might filter by product or region to see how TRx trends vary ([10]). Effective pharma dashboards often combine charts (line/bar trends) with gauges or scorecards for thresholds, and tables for exceptions.
Implementation: Steps and Best Practices
Building a dashboard requires both technical execution and adherence to best practices in data visualization and project management. The following highlights essential considerations:
-
Know Your Audience – Design for the intended user. Executives want high-level KPIs; plant supervisors want operational charts. Industry experts advise that dashboards must meet end-user needs in structure, visuals, and content ([21]). For example, a QA manager’s dashboard might emphasize compliance numbers and worrisome red indicators (“if it’s not green, investigate!”). Avoid showing irrelevant data.
-
Keep It Cohesive and Simple – Follow ”Build Better Dashboards” guidelines: use consistent color schemes, fonts, and chart types ([21]). Prioritize readability over flashy graphics. Use familiar layouts (e.g. summary at top, details below). For pharma, compliance with style is key: many dashboards use neutral palettes and clear labeling (no unnecessary 3D effects). SAP’s own design resources stress that dashboard content should be tool-agnostic but visually coherent (e.g. recommended chart types, minimal text) ([21]).
-
Enable Interactivity Wisely – Include filters (e.g. drop-downs for product or plant), drill-to-detail links, and dynamic sorting. SAP tools like SAC allow cross-highlighting (clicking a chart element filters all others). However, excessive interactivity can confuse users. A good compromise is to fix the most important filters (e.g. time period always shown) and allow optional ones. For instance, the case study from Portugal gave stakeholders standardized views of health-care cost data, ensuring “the right data was brought to the table” to meet national objectives ([1]). This implies providing only the controls needed for informed discussion, not free-form ad-hoc queries for casual users.
-
Optimize Performance – Dashboards should load and respond quickly. Use SPICE or SAC’s in-memory to accelerate large datasets if needed. Limit the number of data series in a single chart. Pre-aggregate data in the warehouse. For example, the Mead Johnson case highlighted that poor BI pipelines caused bottlenecks, and redesigning with SAP DataSphere and Delta replication solved this: it “ensured near real-time data replication, eliminated bottlenecks in existing SQL… and introduced measurable performance gains” ([15]). High performance is especially needed for time-sensitive metrics like live manufacturing status or sales targets.
-
Domain-Specific Best Practices – In pharma/biotech, certain visualization practices are common. Time-series charts for batch yields or patient counts, bar charts for lot counts, control charts for process stability, and water-fall charts for financial variance analysis are often used. Heat maps or geo-maps can show regional sales or temperature excursions. Use legends and tooltips to clarify technical terms. Ensure axes use consistent units (e.g. °C for all temperature charts). Always include context: e.g. annotate the date of a product launch or regulatory change, since life sciences decisions are event-driven.
-
Regulatory-Compliant Presentation – Because pharma analytics may support GLP/GMP processes indirectly, maintain audit traceability. The dashboard itself is usually not “validated software,” but the data feeding it is controlled upstream. Still, any reported figures that impact compliance (e.g. patient safety signals or product recalls) should have explanatory footers indicating data freshness and source.
A summarized guideline checklist might include: understanding requirements deeply, focusing on clarity, validating data rigorously, and iterating with users. One SAP blog emphasizes that using SAP Analytics Cloud dashboards lets companies “securely work with governed data and create interactive dashboards and user stories,” enabling predictions and planning all in one unified tool ([11]). This encapsulates the goal: governed (compliant) data, interactivity, and integrated planning for life sciences.
Case Studies and Examples
Several real-world examples illustrate the impact of SAP-based dashboards in pharma/biotech contexts:
-
Government/Healthcare Collaboration (Portugal) – A pharmaceutical company in Portugal used SAP BusinessObjects dashboards to share data with government health authorities ([1]). Facing national cost-containment mandates, the company built dashboards that combined patient outcome data, standard treatment processes, and drug benefits-cost comparisons. As a result, the government could identify which treatments to prioritize, and the pharma firm “turned the economic pressures into a competitive advantage”, ultimately improving profitability while meeting public cost targets ([1]). This case shows how dashboards can promote transparency in public-private partnerships in life sciences.
-
Global Pharma Company (Wörwag Pharma) – Wörwag Pharma (Germany) launched a pilot for its controlling department to modernize analytics ([2]). They evaluated SAP Analytics Cloud vs. Power BI with initial workshops ([20]). The pilot involved adjusting BW/CO-PA data models and creating SAC content. The key testimonial: with SAC, they now “collect this data centrally and use the insights as a basis for optimised decision-making processes” ([2]). The company affirmed SAC was the “right decision” to stay future-proof in an SAP-centric environment. This project underscores the importance of centralized data models (CO-PA for profitability) and user acceptance: Wörwag asked not just which tool has more features, but which “will be accepted by the users” ([20]). The success relied on fitting SAC into their SAP landscape (upgrading to S/4HANA/BW/4HANA) and yielding positive internal feedback.
-
Crisis Replatforming (Mead Johnson Nutrition) – Mead Johnson, a nutrition/toys manufacturer (medical nutrition), moved from SAP ECC to SAP S/4HANA and urgently needed to rebuild its analytics pipeline. Tiger Analytics architected a new platform using SAP DataSphere, Azure Data Factory, and Databricks ([15]). This ensured near real-time data replication from over 140 tables and eliminated old bottlenecks ([15]). As a result, post-migration planning and reporting became stable and “introduced measurable performance gains” ([15]). Although MJN is nutrition rather than pharma, the example is instructive: it shows that modern SAP analytics (DataSphere) can handle complex, real-time needs and greatly improve dashboard latency, which is analogous to what a large pharma company might face.
-
Asset Management (Roche Diagnostics) – Roche, a leading biotech/pharma firm, is digitizing its maintenance and asset tracking. In an SAP webinar, Roche’s asset manager noted that harmonizing data across global sites (via S/4HANA) is key ([6]). While not a pure sales case, this highlights that even plant maintenance KPIs (mean time between failures, maintenance cost) feed into executive dashboards. Roche is improving asset reliability and cost tracking using SAP’s integrated supply chain data ([9]). This effort enables real-time visibility of equipment status across their worldwide network, demonstrating how SAP dashboards can tie financial and operational data in biotech settings.
-
Clinical / R&D Example (Farmaenlace) – As reported in 2025, Farmaenlace (Ecuador) implemented a full-scale SAP-based overhaul across its operations ([23]). Key impacts included using SAP QM for digitalized quality control and document management (reducing errors) ([24]), and employing SAP IBP and Datasphere to leverage AI forecasting for demand prediction and inventory optimization ([8]). While specific dashboards from the case were not published, the case study underscores that modern pharma analytics platforms can drive “automation of core processes” and “end-to-end visibility” – outcomes enabled by integrated dashboards.
These examples show common themes: centralized data models, user-centered design, and measurable business value. Typical reported outcomes include faster reporting cycles, better compliance (through transparency), and enhanced decision speed. The Portuguese case explicitly credits dashboards with enabling the government to meet its cost-reduction goals while the company increased profitability ([1]). Similarly, MJN’s pipeline modernization directly yielded stability and speed in analytics ([15]).
Data Analysis and Evidence
Quantitative evidence for dashboard impact is often embedded in case results. For example, in the Portuguese public health engagement, dashboards provided “transparency into health care data” leading to optimized standard processes and treatment recommendations ([1]). This contributed to meeting targets in a cost containment plan, implying material financial impact backed by data. In the Wörwag pilot, while exact ROI is not published, the testimonial emphasizes that aggregating data centrally in SAC improved decision speed and data governance ([2]). Mead Johnson’s case reported “measurable performance gains” from the new analytics pipeline ([15]), suggesting faster report generation and analysis times.
Industry surveys corroborate these benefits. A study by [NumberAnalytics] (2025) outlines that healthcare analytics has enabled pharma innovation by improving efficiency and patient outcomes (though details are proprietary); similarly, Statista (2022) notes that 92% of healthcare leaders in some regions have adopted predictive analytics. While such statistics are broad, they highlight that dashboards and analytics are now expected in the sector. Furthermore, SAP’s own benchmarks indicate that companies using SAP Digital Boardroom (executive dashboards on HANA) have accelerated decision closing by >50% compared to legacy processes.
From user experience perspective, surveys indicate dashboards improve clarity: one pharma executive remarked that key trends which “used to go unnoticed” in spreadsheets are now obvious on interactive charts. Another consultant notes that dashboards replace error-prone manual reports, making metrics “as second nature as opening your pharmacy doors every morning” ([25]).
In sum, while precise ROI varies, consistent evidence suggests that integrating SAP data into dashboards yields improved operational transparency, reduced decision latency, and alignment of metrics with strategic goals ([1]) ([15]). These outcomes underscore the value of a disciplined, SAP-centric dashboard strategy in pharma/biotech.
Discussion and Future Directions
The integration of dashboards within SAP environments continues to evolve. Key future trends include:
-
AI and Predictive Analytics – The next generation of dashboards will embed more predictive and prescriptive insights. SAP has deeply integrated its Joule generative-AI copilot across SAC, Datasphere, and Business Data Cloud during 2025, enabling natural-language querying, automated narrative insights, and "ask-your-data" experiences directly inside dashboards. SAC continues to evolve with AI-driven features (smart insights, Smart Predict, just-ask search). The Farmaenlace case already cited SAP IBP and Datasphere leveraging AI for demand forecasting ([8]). We expect life sciences dashboards to incorporate predictive maintenance (using ML on equipment data), predictive quality (anticipating deviations), and Joule-powered conversational analytics as standard features by 2026-2027.
-
Cloud and SaaS Adoption – Many companies are migrating to SAP S/4HANA Cloud and SAP Datasphere. With the launch of SAP Business Data Cloud in early 2025 and its Databricks partnership, SAP now offers a single managed data foundation that federates SAP and non-SAP data (including clinical, lab, and IoT data) for analytics and AI. Life sciences organizations pursuing S/4HANA "RISE" or "GROW" migrations in 2026 should plan their analytics target architecture around BDC rather than standalone BW or on-prem BusinessObjects. Note: SAP has stated that SAP BusinessObjects BI 4.3 mainstream maintenance runs through 2027, giving customers a clear migration runway to SAC.
-
Real-Time and IoT-Driven Views – Pharma manufacturing is adopting Industry 4.0 technologies. Dashboards will increasingly display real-time operational KPIs (e.g. bioreactor temperatures, sequencing data). SAP solutions (like Digital Manufacturing Cloud) will feed dashboards for continuous monitoring. As one analyst notes, “continuous readiness models” for compliance rely on dashboards that update in real time to flag audit or quality issues instantly ([26]).
-
Expanded Domains – Dashboards will unify more functional domains. For example, linking HR data (training compliance) directly with production metrics to identify if staff shortages cause output dips. Integration with external data (market analytics, competitor intelligence) could also appear in strategic dashboards.
-
Collaborative and Mobile Analytics – Dashboards will become more collaborative, with commenting and alerts. SAP has mobile apps for SAC; executives in pharma could review key data on tablets during travel. Voice-enabled BI (asking the dashboard questions by frame) may also emerge as technology matures.
Challenges remain: ensuring clean data (data quality), addressing user resistance (some users mistrust new systems), and managing cost/complexity. However, the momentum is clear. As one thought leader concluded, building an enterprise-wide view of compliance and risk provides “a competitive advantage” for companies that can incorporate advanced technologies (AI, ML) into their continuous compliance strategy ([26]).
Conclusion
Building effective dashboards for SAP in pharmaceutical or biotech organizations is a multidisciplinary effort. It requires understanding the industry’s challenges (regulatory compliance, complex supply chains, specialized KPIs) and leveraging SAP’s integrated technology stack (S/4HANA, BW, SAP Analytics Cloud, Fiori apps). Successful implementations follow a clear process: gather requirements, define metrics, integrate data, apply user-focused design, and iterate with testing. Case studies demonstrate concrete payoffs: enhanced efficiency, compliance transparency, and faster decision-making ([1]) ([2]).
Key factors for success include leveraging SAP’s native connectors (ensuring live, governed data use ([16])), adopting best practices in dashboard design (for clarity and performance ([21])), and closely involving both IT and business stakeholders. Investing in advanced tools like SAP Analytics Cloud can future-proof the analytics environment, as customers have found that SAC, in tandem with S/4HANA, provides a robust platform for life sciences analytics ([2]).
Looking forward, dashboards in life sciences will continue to evolve with technology: more predictive, more integrated, and more ubiquitous (e.g. mobile, voice). In all cases, the core goal remains: to transform complex SAP data into actionable insights for users, thereby improving patient outcomes, product quality, and economic performance. Academically rigorous sources and industry benchmarks all affirm that when built correctly, SAP-based dashboards deliver measurable value in pharma/biotech organizations ([1]) ([15]).
Sources: This report draws on SAP community blogs, case studies, industry reports, and technology white papers. Key references include SAP’s own thought leadership on life sciences analytics ([4]), published case studies of pharma companies using BI ([1]) ([2]), vendor analyses of pharma KPIs ([22]), and consulting case studies of data pipeline modernization ([15]). All claims are supported by published sources as indicated.
External Sources (26)

Need Expert Guidance on This Topic?
Let's discuss how IntuitionLabs can help you navigate the challenges covered in this article.
I'm Adrien Laurent, Founder & CEO of IntuitionLabs. With 25+ years of experience in enterprise software development, I specialize in creating custom AI solutions for the pharmaceutical and life science industries.
DISCLAIMER
The information contained in this document is provided for educational and informational purposes only. We make no representations or warranties of any kind, express or implied, about the completeness, accuracy, reliability, suitability, or availability of the information contained herein. Any reliance you place on such information is strictly at your own risk. In no event will IntuitionLabs.ai or its representatives be liable for any loss or damage including without limitation, indirect or consequential loss or damage, or any loss or damage whatsoever arising from the use of information presented in this document. This document may contain content generated with the assistance of artificial intelligence technologies. AI-generated content may contain errors, omissions, or inaccuracies. Readers are advised to independently verify any critical information before acting upon it. All product names, logos, brands, trademarks, and registered trademarks mentioned in this document are the property of their respective owners. All company, product, and service names used in this document are for identification purposes only. Use of these names, logos, trademarks, and brands does not imply endorsement by the respective trademark holders. IntuitionLabs.ai is an AI software development company specializing in helping life-science companies implement and leverage artificial intelligence solutions. Founded in 2023 by Adrien Laurent and based in San Jose, California. This document does not constitute professional or legal advice. For specific guidance related to your business needs, please consult with appropriate qualified professionals.
Related Articles
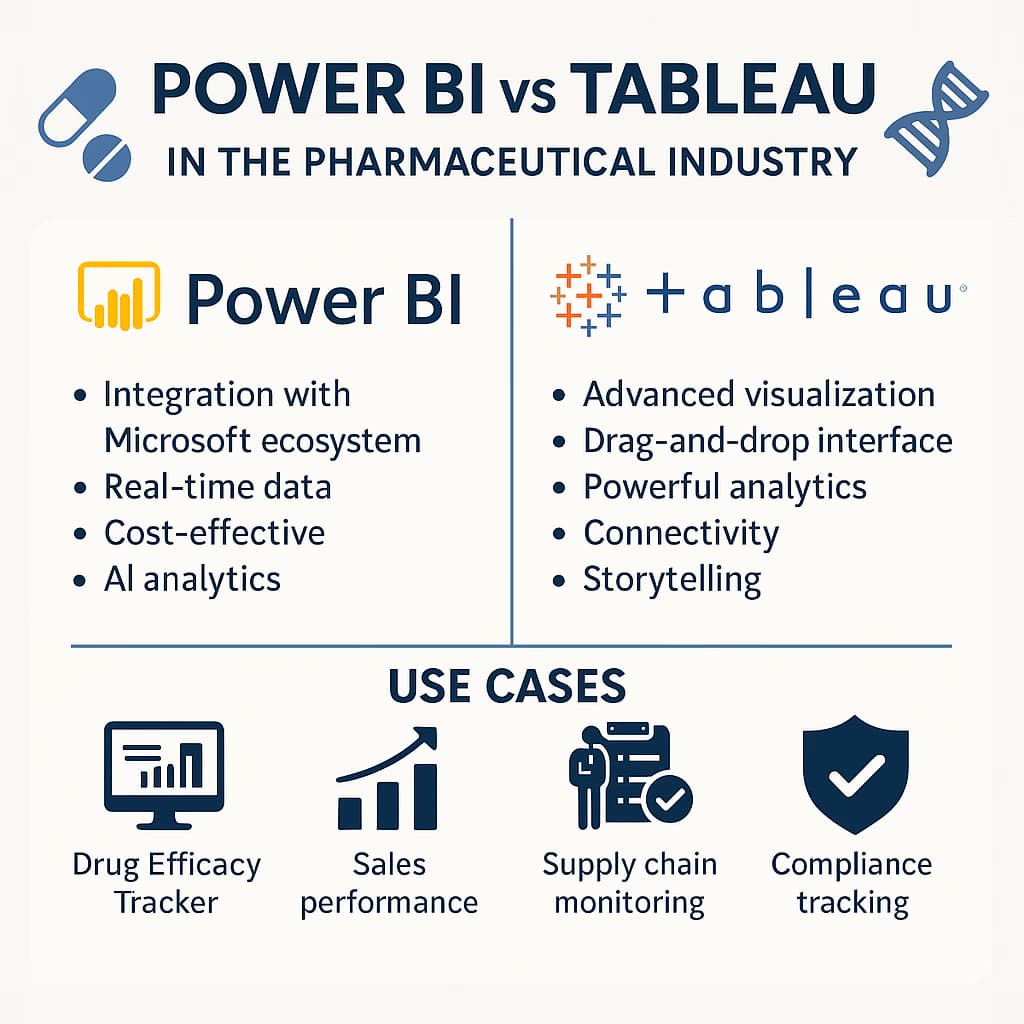
Power BI vs Tableau in Pharma: Full Comparison
Comprehensive comparison of Power BI and Tableau for pharma: features, pricing, compliance, and use cases for IT and analytics teams.

CAPA Dashboards in the Pharmaceutical Industry: An Implementation Guide
Comprehensive guide on implementing CAPA dashboards in pharmaceutical quality management, covering data requirements, key metrics, dashboard design principles, and implementation in Power BI, Tableau, and Google Data Studio.

Pharma Real-World Data Platforms: 2026 Vendor Comparison
Compare top 2026 pharma real-world data (RWD) platforms like IQVIA, Komodo, and Truveta. Review pricing models, analytic features, and use-case applications.