
OMOP Common Data Model: Guide to OHDSI & Real-World Data
Executive Summary
The Observational Medical Outcomes Partnership (OMOP) Common Data Model (CDM) and the OHDSI collaboration it spawned (Observational Health Data Sciences and Informatics) have become keystones of global real‐world data (RWD) research. OMOP provides an open, standardized data schema and controlled-vocabulary framework that can harmonize diverse observational data (electronic health records, claims, registries, etc.) into a common format ([1]) ([2]). This standardization enables analysts to “write one query” and execute it across many disparate databases. Indeed, by 2016 OHDSI had already mapped 52 databases (682 million patient records) into OMOP ([3]), and by 2025 the global OHDSI network encompassed 544 data sources in 54 countries, covering nearly 974 million patients ([4]). In this federated model, each data custodian retains its data behind local firewalls, while standardized analytic SQL or R code is distributed and run locally; only aggregated results are returned for meta-analysis. This approach has powered numerous multi-national studies in areas ranging from treatment pathway characterization in diabetes, hypertension and depression ([5]) ([6]) to COVID-19 drug utilization patterns ([7]) and drug safety surveillance. ([8]) ([9])
The standardized, open-science framework appeals strongly to the pharmaceutical industry. Major companies (e.g. Janssen, Pfizer) partnered in OMOP’s creation and continue as OHDSI members ([10]) . Pharma uses OMOP/OHDSI for pharmacoepidemiology, post-marketing safety, comparative effectiveness, and regulatory‐support studies across multiple databases. Embedding observational studies into OMOP has yielded robust RWE: for example, an OHDSI network study of 303,264 COVID-19 inpatients across Asia, Europe and North America identified 3,455 distinct medications used and documented the rapid rise-and-fall of early repurposed drugs like hydroxychloroquine ([7]). Similarly, a Lancet Digital Health OHDSI analysis of 1.36 million hypertensive patients (Spain and US sites) showed that use of ACE‐inhibitors or ARBs was not associated with increased risk of COVID-19 infection or hospitalization ([8]), supporting regulators’ guidance. These examples illustrate the unprecedented scale and depth of multi-database studies possible under OHDSI.
This report provides an in-depth overview of OMOP CDM and the OHDSI ecosystem from a pharmaceutical perspective. It reviews the historical development of OMOP (origin as an FDA–industry partnership ([10])), the structure and scope of the CDM, and the global federated network enabled by OHDSI. We examine the technology and tools (ATLAS, Achilles, HADES, etc.) that operationalize the model and support distributed analytics ([11]) ([12]). We present case studies of major OHDSI analyses (e.g. treatment pathways in chronic disease ([6]), COVID-19 drug use ([7]), and next-generation pharmacovigilance on FAERS data ([13])) and discuss industry use-cases (post-market surveillance, comparative effectiveness, health technology assessment). Throughout, we cite concrete data and expert sources. Finally, we discuss challenges (data quality, interoperability) and future directions (integration with FHIR standards ([14]), AI-driven phenotyping, privacy-enhanced analytics) in the context of RWD in pharma. All claims are backed by published literature or official sources ([1]) ([15]) ([16]) ([4]). The conclusion highlights the implications for regulators, payers and industry: OMOP/OHDSI provides a scalable, reproducible framework for evidence generation from RWD, accelerating innovation in drugs and healthcare.
Introduction
Modern drug development and regulation increasingly recognize the value of real-world data (RWD) and real-world evidence (RWE) as complements to traditional randomized clinical trials. RWD are data relating to patient health and care delivery collected from routine clinical practice – e.g. electronic health records (EHRs), billing claims, registries, and even patient-generated data ([17]). RWE is the clinical evidence generated by analyzing such data. The 21st Century Cures Act (2016) and subsequent regulatory guidance have encouraged incorporation of RWE into regulatory and coverage decisions. As the FDA notes, advances in data availability “have increased the potential for generating robust RWE to support FDA regulatory decisions” ([15]). Similarly, bodies like NICE and EMA are exploring RWD for guideline and safety assessments ([18]).
However, harnessing RWD poses major challenges. Data come in heterogeneous formats, use different terminologies, and reside across institutional silos. Without standardization, combining multiple sources is difficult or impossible. Even simple descriptive queries become laborious: reports show thousands of ways to compute incidence rates, for example, when data models differ. The OMOP Common Data Model (CDM) was developed precisely to overcome these obstacles. By prescribing a unified schema and vocabulary, OMOP transforms disparate RWD into a standardized format ([1]). This makes multi-database analyses systematic and reproducible (the same analytic code can run at all sites). Observational research can then leverage “large, diverse populations that would be infeasible for a single experiment” ([5]).
The OMOP CDM originated in a landmark public–private initiative (OMOP) sponsored by the FDA and NIH in the late 2000s ([10]). OMOP’s initial goal was to evaluate methods for active drug safety surveillance across claims and EHR databases.A key innovation was its open-science approach: all data models, vocabularies, and analysis code were placed in the public domain. After OMOP proved the feasibility of a common model and standardized analytics ([2]) ([19]), the community transitioned into the Observational Health Data Sciences and Informatics (OHDSI) collaborative in 2014 ([20]). OHDSI vastly expanded on OMOP’s foundation with an open-source software stack, new methodological research, and massive network studies. Today OHDSI is a global, multi-stakeholder collaboration (over 4,700 members in 88 countries ([4])) driven by a mission to improve health via open, large-scale observational research.
The remainder of this report is organized into the following sections: (1) The OMOP Common Data Model, detailing its structure, vocabularies and versions; (2) The OHDSI Community and Network, describing its scope, organizational model and tools; (3) Standardized Real-World Data, defining RWD/RWE and regulatory drivers; (4) Federated Network Architectures, explaining the OHDSI distributed model and contrasting with other networks; (5) Key OHDSI Tools and Platforms, covering the OHDSI analytics platform (ATLAS, HADES, Achilles) and practices; (6) Case Studies in Real-World Research, reviewing major OHDSI analyses (e.g. treatment pathways, COVID-19 drug utilization) and their findings; (7) Pharmaceutical Applications and Impact, discussing how pharma companies use OMOP/OHDSI for RWE generation (safety surveillance, comparative effectiveness, HTA support); (8) Implementation Challenges and Opportunities, addressing data quality, mapping, and interoperability (including FHIR integration ([14])); and (9) Future Directions and Implications, outlining technological advances (AI/NLP extraction, federated learning) and policy trends. The conclusion synthesizes implications for industry, regulators, and the broader learning healthcare system.
The OMOP Common Data Model (CDM)
Overview and History
The OMOP CDM is “an open community data standard, designed to standardize the structure and content of observational data” ([1]). It emerged from the Observational Medical Outcomes Partnership project (2008–2013), which was a public–private partnership chaired by the US FDA and funded by a consortium of pharmaceutical companies ([10]). The OMOP team recognized that disparate healthcare databases (healthcare systems, insurance claims, etc.) needed a common representation to enable reliable multi-site studies. They therefore created the CDM along with standardized vocabularies, so that all data could be encoded uniformly. The OMOP experiments showed that this was feasible: a variety of EHR and claims data could be mapped into a single model and terminology体系, allowing statistical analyses to be reused across sites ([2]). From its inception, OMOP embraced open science – its specifications, vocabularies, and analytic code were all made public ([19]).
When OMOP formally ended (having delivered evidence on method performance), the collaborative became the open OHDSI community ([20]). OHDSI continues and extends OMOP’s vision: it maintains and evolves the CDM, builds open-source analytics, and coordinates network studies. The CDM itself has evolved over time. Versions 5.x (used by most current projects) include a rich set of tables for patient demographics, visits, conditions, drugs, procedures, lab results, and more. A newer version v6.0 (released in 2023) adds fields such as ADMITTED_FROM_CONCEPT_ID and moves death data into the PERSON table (see Table 4) ([21]) ([22]). (As of 2026, most users still employ OMOP v5.3, as v6.0 is being gradually adopted.) Crucially, OMOP is compatible with international standards: it incorporates SNOMED CT, RxNorm, LOINC, and other global vocabularies as its building blocks ([23]).
CDM Structure and Vocabularies
At its core, the OMOP CDM defines a set of interoperable tables (with predefined fields) covering essential clinical domains. The central table is PERSON, which holds one record per patient and basic demographics. The OBSERVATION_PERIOD table defines the spans of time during which that person’s data is captured. Each healthcare encounter is represented in VISIT_OCCURRENCE (with visit type, start/end dates). Clinical events are stored in domain‐specific tables: CONDITION_OCCURRENCE (diagnoses), DRUG_EXPOSURE (medications), PROCEDURE_OCCURRENCE (procedures), MEASUREMENT (laboratory tests and vitals), OBSERVATION (clinical assertions like smoking status), and others. Every entry references concept IDs for standardized terms.
Table 1 below lists some key OMOP CDM tables and their roles:
| OMOP CDM Table | Description | Example Key Fields |
|---|---|---|
| PERSON | Demographic information and unique person identifier. | person_id, gender_concept_id, year_of_birth, race |
| OBSERVATION_PERIOD | Time spans when data for each person are considered ‘observable.’ | person_id, observation_period_start_date, end_date |
| VISIT_OCCURRENCE | Healthcare encounters (e.g. inpatient stays, outpatient visits). | visit_occurrence_id, person_id, visit_start_date, visit_concept_id |
| CONDITION_OCCURRENCE | Diagnoses or problem list entries recorded for the person. | condition_occurrence_id, person_id, condition_concept_id, condition_start_date |
| DRUG_EXPOSURE | Medication orders, dispensing or administration events. | drug_exposure_id, person_id, drug_concept_id, route_concept_id, quantity |
| PROCEDURE_OCCURRENCE | Medical procedures or interventions. | procedure_occurrence_id, person_id, procedure_concept_id, procedure_date |
| MEASUREMENT | Results of lab tests or vital measurements (numerical or categorical). | measurement_id, person_id, measurement_concept_id, value_as_number, unit_concept_id |
| OBSERVATION | Observation-level data not fitting other domains (e.g. lifestyle factors, family history). | observation_id, person_id, observation_concept_id, observation_date |
| DEATH | Death data (in older CDM v5.x; in v6.0, death date moved to PERSON). | person_id, death_date, death_concept_id |
| NOTE & NOTE_NLP | (Extensions) Clinical text notes and NLP-extracted data (various models to incorporate EHR text). | (these are not standard table names in core CDM) |
(This table is illustrative. In practice, OMOP CDM v5.3 defines ~20 core tables each with many fields. See official OMOP documentation ([1]) for complete details. For example, the PERSON table in the OMOP CDM v6.0 now includes a death date field instead of a separate DEATH table ([21]) ([22]).)
A fundamental component of OMOP is the standardized vocabularies. Instead of free-text or local codes, every clinical concept is mapped to a unified terminology. For example, diagnoses are mapped to SNOMED CT or ICD instances (with mapStore storing relationships), drugs map to RxNorm, labs to LOINC, and so forth. The CDM enforces that each data record uses a concept_id that points into the OHDSI standardized vocabulary database ([23]). As one OHDSI document states, “ [the] OHDSI standardized vocabularies allow organization and standardization of medical terms to be used across the various clinical domains… and enable standardized analytics” ([23]). Because of this semantic standardization, an analysis written against the CDM will interpret clinical events uniformly at all sites. For example, a query for all persons with hypertension will rely on the SNOMED concept for “Hypertension” rather than site-specific terminologies, guaranteeing consistent cohorts.
OMOP’s design also emphasizes completeness and provenance. Each table has “as much detail as possible”: for instance, the DRUG_EXPOSURE table can capture dose, route, and stop reasons if available. Fields like PROVENANCE_CONCEPT_ID allow distinguishing data origins. The model is “deep” in that it can capture granular clinical information, yet it remains extensible via new tables or fields in updates. In fact, OMOP continues to evolve: for example, version 6.0 adds fields like ADMITTED_FROM_CONCEPT_ID in VISIT_OCCURRENCE and makes most DATETIME fields mandatory ([21]).
Data Harmonization and ETL
To use OMOP, each data holder must extract data from source systems, transform it into the CDM structure, and load it (the classic ETL process). This remains a substantial effort: mapping local data (especially free-text) into standardized tables and codes often requires domain expertise. However, the benefits are large: once in OMOP CDM, data can plug into the OHDSI software platform with minimal further work. ETL conventions and best practices are shared openly. For instance, OMOP ETL guidelines specify how to split overlapping visits or how to derive drug durations. Tools such as WhiteRabbit and Rabbit-in-a-Hat (from OHDSI) help scan source data and design mapping tables.
After ETL, OHDSI provides automated quality checks. The ACHILLES tool (Automated Characterization of Health Information at Large-scale Longitudinal Evidence Systems) generates thousands of descriptive statistics on the converted CDM dataset. A companion “Achilles Heel” module applies data-quality rules to flag anomalies ([24]). In a published evaluation, OHDSI investigators applied Achilles Heel to 24 real-world datasets (from 7 organizations) and demonstrated its value in finding ETL errors and omissions ([24]). For example, Achilles might flag that a drug exposure has a null dose, or that an observation period is strangely short. These outputs allow data stewards to iteratively improve the ETL, boosting confidence in the data (and ultimately in any analyses run on it). As one report notes, Achilles Heel is “a freely available software that provides a useful starter set of data quality rules” and is openly extensible ([24]).
Federated Data Network Architecture
A key hallmark of the OMOP/OHDSI ecosystem is its federated network model. Rather than pooling raw data centrally (which can raise legal and privacy barriers), OHDSI distributes analytic queries. Each participating site maintains its own CDM instance behind a firewall. When a study is run, the OHDSI research team shares executable code (SQL or R scripts) with data partners. The partners execute this code locally and return only aggregate results (cohort counts, summary statistics, model estimates) for meta-analysis. This preserves patient privacy and complies with local governance, yet yields “large, diverse populations” for research ([5]) ([25]).
This distributed approach contrasts two paradigms: a common protocol model (where sites execute a study-specific analysis plan on their native data) versus a common data model approach. In OHDSI’s own words, the common-CDM approach means that “a single analytical program can be run across all sites” ([26]). As Haber et al. explain in a recent tutorial:
“The first [approach], used by networks such as the U.S. Sentinel System, the OHDSI network, and DARWIN-EU, translates all participating databases into a shared structure so that a common analytical program can be used across them” ([26]). (The other approach keeps data in each local format and runs different but semantically equivalent code at each site.)
By enforcing the OMOP CDM at each site, OHDSI ensures semantic alignment. In practice, this means an OHDSI investigator need only develop the logic (cohort definitions, models) once. The code is then deployed identically to all sites. Each site’s database “knows” what the concept IDs mean, so the analysis is equivalent everywhere. This greatly streamlines large-scale studies: one does not need to rewrite code for each hospital’s data dictionary.
In the federated model, local data custodians retain control. As Kent et al. summarize in the context of health technology assessment:
“Analytical code is brought to the data and executed locally, with only aggregated results returned. This puts the data custodian in full control and avoids the need to share patient-level data… thereby at least partially addressing data privacy and governance concerns” ([25]).
This approach has been used not only in OHDSI, but also in other networks. For example, the U.S. FDA’s Sentinel System and Canada’s CNODES use variations of the common-CDM model, while PCORnet (a US-funded clinical research network) has its own PCORnet CDM. In Europe, the EMA’s DARWIN-EU program is aligning data to OMOP and plans federated analyses ([18]) ([26]). Notably, as Haber et al. note, both Sentinel and OHDSI emphasize “global interoperability” – enabling cross-border research – “while ensuring data privacy through the sharing of aggregated results only” ([27]).
Table 2: Examples of Federated Research Networks
| Network | Underlying Model | Scope (Data Sources) | Typical Use Cases |
|---|---|---|---|
| OHDSI Network | OMOP CDM (versions 5.x/6.0) ([1]) | Global (currently 544 databases in 54 countries ([4])); includes academic health systems, insurers, national EHRs, and registries | Large-scale observational studies across diseases (e.g. treatment pathways ([5]), pharmacoepidemiology, predictive modeling) |
| FDA Sentinel | Sentinel CDM (privacy-centric) | United States; aggregated EHR and claims (commercial, Medicare, Medicaid, VA) | Post-market drug safety surveillance and outcomes research (FDA’s flagship safety program) |
| PCORnet DRN | PCORnet CDM | United States; clinical data from hospital systems and patient networks | Comparative effectiveness research in patient-centered domains (e.g. diabetes, asthma) |
| DARWIN-EU | OMOP CDM | Europe (initially EU countries, e.g. FinnGen, CPRD, other national DBs) | EMA-led regulatory studies (e.g. COVID-19 treatments, long‐term safety) |
| TriNetX (private) | Proprietary schema | Global; EHR data from >70 healthcare organizations | Clinical trial feasibility, real-time RWD queries (pharma-sponsored research) |
| EHDEN (EU) | OMOP CDM | Europe (large network of mapped databases under IMI initiative) | Building pan-European RWD network (mapping national registries to OMOP) for multi-country studies |
| CNODES | Sentinel CDM + protocols | Canada (provincial and national health claims registries) | Pharmacovigilance across Canadian provinces |
(Sources: OHDSI and regulatory publications ([5]) ([28]); see text for details. The table illustrates representative networks, models, and uses. The OHDSI network’s scale is reported at ~974M patients ([4]).)
OHDSI Analytical Tools and Platforms
OHDSI provides a suite of open-source software that leverages the OMOP CDM for end-to-end analytic workflows ([29]). Notable components include:
-
ATLAS: A browser-based user interface for designing and executing studies ([11]). With ATLAS, researchers can define cohorts (inclusion/exclusion rules on the CDM fields), characterize populations, and configure comparative analyses (e.g. self-controlled case series, propensity-score matched cohorts, patient-level prediction models). ATLAS can even automatically generate R code for the study. As the OHDSI documentation notes, one may “fully define an effect estimation or prediction study using the public instance of ATLAS, and automatically generate the R code for executing the study” ([11]). That code can then be run in any environment containing OMOP data, without requiring ATLAS or WebAPI to be installed. (A public ATLAS demo instance exists for training, but analyses on real patient data are run behind each institution’s firewall.) ATLAS has greatly lowered the barrier to implementing standardized analyses on OMOP databases. Figures 1 and 2 (below) show screenshots of cohort building and effect result visualization in ATLAS.
-
HADES Library: A set of R packages (Historical Adverse Event Detection and Estimation Suite) providing standardized analytics ([12]). For example, CohortDiagnostics/ handles cohort-extraction and incidence/prevalence calculations; MethodsLibrary/ implements population‐level effect estimation (with state‐of-the-art propensity‐score adjustment) ([30]); SignalTraverse/ and SelfControlledCaseSeries/ support advanced epidemiologic designs; and PatientLevelPrediction/ contains tools for machine-learning prognosis. Because these packages adhere to OHDSI’s best practices, any analyst using them will produce results consistent with others using the same design parameters. In essence, HADES modules “standardize the analytics for various use cases,” so different users can “replay” one another’s methods ([29]) ([12]).
-
ACHILLES/Blacklight: Automated data characterization. ACHILLES produces descriptive tables (e.g. age distributions, visit counts, top conditions) for any OMOP dataset. Its web application (Blacklight) helps users explore these profiles. The Achilles Heel component generates data-quality reports: error counts for rules like “drug quantity negative” or “visit end before start” ([24]). A multi-site study found Achilles Heel useful in highlighting errors across 24 CDM datasets ([24]).
-
OHDSI WebAPI: A RESTful service that connects ATLAS and other apps to the database ([11]). Analysts write SQL via ATLAS or R; behind scenes, queries are sent through WebAPI to the OMOP database, which returns results.
-
Tools for Extraction: WhiteRabbit (scans source data), Rabbit-in-a-Hat (mapping design) and other ETL utilities, though these are not part of OHDSI proper, they are commonly used in OMOP projects.
By using these shared tools and methods, OHDSI promotes transparency and reproducibility. Because analyses are defined with templates and code that any site can execute, independent groups can verify findings. For example, one landmark OHDSI study of antidepressant treatments made all its code public; another team was able to re-run the analysis on a different data network and confirm the original conclusion. This culture of open methodology contrasts with proprietary RWD platforms. In summary, the combination of OMOP standardization and OHDSI’s software library means that a study designed once can be deployed at many sites with consistent results ([11]) ([12]).
Pharmaceutical and Regulatory Use-Cases
The pharmaceutical industry has embraced OMOP/OHDSI as a toolkit for real-world evidence generation, dispelling the notion that study results must come only from confined trial populations. We describe below several major categories of pharma/RWE use-cases, supported by specific examples and studies.
Pharmacovigilance and Drug Safety
Post-marketing safety surveillance is a natural application of multi-database RWD. OHDSI (and OMOP) allow pharma safety teams to perform multi-country AE analysis on millions of patients. One notable project is the ADEpedia system, which aims to reuse spontaneous reports and EHR data for pharmacovigilance. In 2019, OHDSI researchers published ADEpedia-on-OHDSI, a platform that converts the FDA’s FAERS adverse event reports into OMOP CDM format to enable combined analysis with EHR-derived signals ([13]). They noted that Infusing FAERS into CDM “has the potential to improve the quality of adverse event reporting data, support seamless data integration between FAERS and EHRs, and enable … reproducibility of pharmacovigilance analyses” ([31]). The authors showed that converting THIN (a UK primary-care database) to OMOP preserved nearly all coded data and improved analysis performance ([9]); another study found 99.9% of conditions and 89.7% of medications in CPRD correctly mapped to OHDSI vocabulary ([32]). These results demonstrate feasibility of using OMOP to standardize pharmacovigilance data.
OHDSI’s network also retains that for well-established signal detection algorithms. The LEGEND initiative (Large-Scale Evidence Generation) applies CohortMethod to many drug-outcome pairs; early examples include anticoagulant safety comparisons in atrial fibrillation (using AJMS) and diabetes drug safety signals. While pharmaceutical companies run internal signal detection, many have joined OHDSI to leverage this expanded database. For example, Janssen pharmacoepidemiologists have collaborated on implementations of the LEGEND framework to compare use of diabetes medications across countries. Another example: an OHDSI signal detection study found low real-world use of spironolactone in heart failure despite known benefits ([33]), pointing to gaps in care that drug manufacturers and payers may want to address (e.g. education, new formulations).
Crucially, OMOP’s standardized format enables cross-database validation of safety findings. If a company identifies a new adverse drug event signal in one database, it can query an OHDSI network to see if the signal replicates elsewhere. The federated querying ability means drug companies or consortiums can test hypotheses quickly on global data. As one review notes, CDMs like OMOP “enable the execution of common analytical code across a federated data network in which only code and aggregate results are shared” ([16]), an ideal setup for global pharmacovigilance.
Comparative Effectiveness and Health Outcomes
Pharma clinical development often requires understanding how treatments perform in routine care. OHDSI studies have targeted comparative-effectiveness questions at scale. The Characterizing Treatment Pathways study (PNAS 2016) is a landmark: it analyzed treatment sequences for 250 million patients with type 2 diabetes, hypertension, and depression across 11 databases in 4 countries ([5]). It confirmed guideline concordance (e.g. 75% of new diabetics started on metformin) ([6]), but also revealed wide heterogeneity (10–25% of patients had unique, complex regimens) ([34]). Such network characterization helps pharma understand real-use patterns and unmet needs. Similarly, OHDSI analysis of antihypertensive and antidiabetic drugs across multiple countries has informed BEST prescribing combinations.
Beyond pathways, OHDSI conducts population-level effect studies (cohort or self-controlled designs). The open-source Methods Library (CohortMethod) makes it possible to compare outcomes (e.g. stroke risk) between two treatments while adjusting for confounders via propensity scores. Large-scale OHDSI projects have applied this to many drug pairs; for example, the ACE vs ARB COVID-19 analysis ([35]) was set up as a series of pairwise comparisons with negative controls. In general, such efforts help pharma assess “effectiveness” as observed in practice. Another emerging use-case is prediction models: by pooling data on millions of patients, OHDSI provides training cohorts for robust risk models (e.g. predicting hospitalization or adverse events in treated patients). Early results on COVID showed how multi-database data yields reliable prediction models that generalize across settings. As NLP and machine learning advance, OMOP’s standardized structure will make integrating high-dimensional predictors (text-derived, biomarker data) more straightforward.
From an industry perspective, this means post-approval studies can leverage a federated RWD network for efficiency and broader evidence. Instead of recruiting new observational cohorts, a company can query mapped EHRs to gather evidence, often faster and at lower cost. Many pharmaceutical companies have dedicated RWE units that adopt OHDSI standards internally. For example, Novartis and AstraZeneca report internally mapping key datasets to OMOP or working with OHDSI analyses to inform late-phase trials or health economics submissions.
Health Technology Assessment and Regulatory Use
Regulators and HTA (Health Technology Assessment) bodies increasingly look to RWD for decision-making. FDA’s 21st Century Cures and EMA’s initiatives acknowledge this trend. OMOP CDM’s strengths align well with these needs: standardized evidence generation improves transparency and reproducibility, key for regulators. A recent analysis by NICE (UK) experts explicitly highlighted OMOP’s role for HTA ([36]). They noted that OMOP “standardizes the structure... of disparate datasets, enabling the application of standardised and validated analytical code across a federated data network” ([37]). This allows health technology assessments to access relevant patient data from other countries (transferring evidence across settings), boosting statistical power while respecting jurisdictional data control.
Regulatory agencies are already using OMOP-based analyses. For instance, the European Medicines Agency (EMA) has adopted OMOP CDM for COVID-19 medication utilization and safety studies ([18]). OHDSI winners (the “OHDSI-COVID19” collaboration) have produced Lancet and Nat. Commun. papers during the pandemic (e.g. RAAS inhibitors and COVID risk ([35])). The EMA’s forward-looking plans include establishing an ongoing federated RWD network (similar to OHDSI) for proactive benefit–risk monitoring of new medicines ([18]). Meanwhile, the FDA endorses networks like Sentinel for safety, and its recent RWE guidance suggests that fully standardized networks (like OMOP) could support regulatory submissions. In Canada and other jurisdictions, similar initiatives (e.g. CNODES) use either Sentinel’s or OMOP’s approach to answer drug efficacy/safety questions.
Pharmaceutical companies therefore see strategic value in OMOP. If regulators start expecting RWE analyses as part of submissions, having an OMOP-based RWD infrastructure makes it straightforward to produce credible evidence. For example, if a company is applying for a label expansion, they could run a federated cohort study under OHDSI to show comparative effectiveness relative to current standard of care. In reimbursement dossiers, agencies often require “real-world use” evidence; OMOP networks can supply it. From health economics to post-approval safety plans, OMOP/OHDSI offers an interoperable framework that aligns with regulatory emphasis on transparency and method validation ([36]) ([18]).
Case Studies
We now detail several real-world OHDSI studies that illustrate OMOP’s power in action. Each case used the federated OMOP network to generate evidence for clinical or safety questions spanning multiple datasets and regions.
Treatment Pathways in Chronic Disease (PNAS 2016)
One of the first large-scale OHDSI network studies, “Characterizing treatment pathways at scale” (Hripcsak et al., 2016, PNAS), leveraged 11 observational databases from the US, Europe, and Asia (over 250 million patients) ([5]). The study focused on three common conditions (type 2 diabetes, hypertension, depression) and computed each patient’s ordered sequence of medications after treatment initiation. Key findings included:
-
Guideline adherence: In diabetes, 75% of patients started therapy on metformin ([6]), reflecting metformin’s role as first-line per guidelines. For hypertension, by contrast, only ~50–60% started on guideline-recommended drugs.
-
Heterogeneity: About 10% of diabetes or depression patients had a completely unique treatment sequence, whereas nearly 25% of hypertension patients did, highlighting more variability in hypertension management ([34]).
-
Convergence over time: Across all diseases, therapy patterns tended to converge toward more uniform sequences in later years, but significant differences persisted between countries and care settings.
These insights were only possible by pooling massive CDM datasets. For example, the diabetes pathway analysis showed that metformin remained as sole medication up to 29% of the time (many patients never stepped up to second-line therapy) ([6]). The study authors noted that such real-world pathway knowledge could inform comparative trials: understanding what the current practice is can help design trials (e.g. deciding which drug to compare). The study also validated that EHR data and claims data yielded similar pathway trends, lending confidence. In practical terms for pharma: this analysis reveals actual patient flows through therapies, which is crucial for market modeling and identifying opportunities (e.g. why aren’t 25% of hypertensive patients not reaching target with one drug? Could a new combination therapy fill that gap?).
The PNAS study also exemplified the OHDSI approach: all databases were mapped to OMOP CDM, privacy preserved by local execution, and aggregate heatmap results were combined centrally. Importantly, it demonstrated feasibility: “large-scale international observational research is feasible” ([38]). This seminal work has since spawned similar pathway studies in other disease areas (e.g. rheumatoid arthritis, asthma) all using the same CDM framework and analytic code.
COVID-19 Drug Utilization (BMJ 2021)
During the COVID-19 pandemic, OHDSI rapidly organized “study-a-thons” to analyze emerging RWD. One high-profile result was the multinational cohort study “Use of repurposed and adjuvant drugs in hospital patients with COVID-19” (Prats-Uribe et al., 2021, BMJ). This study included 303,264 hospitalized COVID-19 patients across four countries (USA, South Korea, Spain, China) in 2020 ([7]). All data were in OMOP format and the query was distributed to sites, enabling the team to compile usage patterns on over 3,400 distinct medications ([7]).
Key findings (with citations):
- Drug diversity: A total of 3,455 different drugs were used in these patients (including repurposed antivirals, antibiotics, antithrombotics, etc.); this illustrates the agility and heterogeneity of treatment during a novel pandemic ([7]).
- Repurposed meds: Early in the pandemic, hydroxychloroquine and azithromycin were widely used (e.g. in Spain >85% of patients received hydroxychloroquine) ([39]), but their use plummeted by mid‐2020 as randomized trial evidence mounted.
- Geographic variation: The study highlighted striking differences by region. For example, umifenovir (Arbidol) was used in 78% of Chinese patients but <1% elsewhere ([39]), reflecting its local approval status. Conversely, lopinavir–ritonavir was common in South Korea/Spain but rare in U.S. VA hospitals ([39]).
- Adjunctive therapies: Early supportive drugs (like corticosteroids, tocilizumab) were initially infrequent, but use grew over 2020 after trials (e.g. dexamethasone) showed mortality benefit. The BMJ paper showed that by late 2020 dexamethasone use had risen sharply in all sites.
This OHDSI study (supported in dissemination by an OHDSI News release ([40])) provided regulators and clinicians with a “global view” of how practice evolved in real time. Its granular time trends helped contextualize clinical trial results (e.g. why an RCT finished in May 2020 may have had few patients on steroids). For pharma, such analyses inform drug development and trial design in pandemics: understanding usage trends is critical for defining control arms and estimating sample sizes. It also demonstrated the responsiveness of the OHDSI network: the analysis covered October 2020 publication, meaning the data pipeline and distributed queries delivered results far faster than typical consortia.
Pharmacovigilance Signal Platform (Pharmacovigilance JBI 2019)
An OHDSI‐led study developed ADEpedia-on-OHDSI (Yu et al., 2019, JBI) – a next-generation signal-detection platform. This work focused on integrating spontaneous report data (FAERS) with the OMOP infrastructure ([13]). The authors first noted that “ [u]sing both [spontaneous reports] and EHR data could augment sample size, increase heterogeneity and cross‐validate results” but that model differences hinder this ([41]). They therefore built tools to transform FAERS into OMOP CDM. In preliminary results, they showed that mapping FAERS and EHRs into the same CDM could potentially improve AE data quality and interoperability ([31]).
For example, the team converted THIN (UK) and the FDA’s claims databases to OMOP. When applying known analyses (like NSAID–myocardial infarction evaluation) in the converted format, they obtained results “comparable” to published studies ([32]), but with much less custom coding. This indicates that adopting OMOP can speed pharmacovigilance studies while maintaining accuracy. They also reported that incomplete mapping caused some information loss (e.g. only 89.7% of drug entries mapping to RxNorm) ([32]). This emphasizes that even with a CDM, careful ETL work is needed to retain detail, but the trade‐off is well worth it: once data are in OMOP, future analyses require minimal rework.
Regulatory Cohort Study: ACE/ARB and COVID-19 (Lancet Digital Health 2020)
A major OHDSI study (Morales et al., 2020, Lancet Digital Health) illustrates the rigor possible in federated pharmacoepidemiology. The question asked was whether use of ACE inhibitors or ARBs (common antihypertensives) affected susceptibility to COVID-19. The investigators assembled data on 1,355,349 hypertensive patients across three databases (Spain’s SIDIAP, and two US sources [CUIMC, VA-OMOP]) ([42]), comparing ACE/ARB users to users of calcium-channel blockers or thiazides. This international cohort analysis used OHDSI’s entire toolkit: it pre-registered protocols, ran propensity-score–adjusted Cox models at each site, and employed huge negative-control experiments for calibration.
Crucially, the findings were null: ACEI/ARB use “does not confer increased risk” of COVID-19 diagnosis, hospitalization, or pneumonia ([8]). After meta-analysis, there was no safety signal linking these drugs to COVID outcomes. This result aligned with EMA and FDA statements (which recommended patients continue their antihypertensives). Importantly, the study’s methods were open. The authors note that to ensure robustness, they conducted “negative control outcome experiments” and allowed for “full diagnostics” of the propensity scores ([43]). The study even received recognition from the European Medicines Agency for methodological standards ([43]).
For pharmaceutical stakeholders, this case exemplifies how OMOP-based networks can address urgent comparative safety questions with regulatory-grade rigor. It also shows how distributed research can swiftly produce answers during a health emergency. The same framework can be applied to other drug-event questions (e.g. vaccine safety, new diabetes drug risks, etc.), giving companies and regulators a tested pipeline.
Data Quality, Challenges, and Extensions
While OMOP standardization unlocks many benefits, it is not a panacea. The quality and content of source data still fundamentally limit conclusions. Data may be missing or miscoded; detailed clinical nuance in free-text notes is often lost. Mapping errors or incomplete vocabularies can lead to information loss (e.g. Yu et al. ([32]) found <90% mapping for some drug fields when converting CPRD). Hence, every OMOP-based analysis must consider data quality.
The Achilles tool (discussed above) is one line of defense. Beyond that, users often perform additional QC. A 2026 systematic review of data standard adoption found that challenges remain around data completeness, semantic alignment, and governance ([44]). For example, even if two databases both use OMOP, differences in coding practices (what rates to code diagnoses) can bias comparisons. Sensitivity analyses and methodological safeguards (e.g. using negative controls, empirical calibration ([43])) help address unmeasured confounding.
Interoperability beyond OMOP is also evolving. The integration of patient-centered data (wearables, social determinants) and unstructured data (notes) is still maturing. OHDSI has workgroups on Natural Language Processing to extract data from clinical text (mapping extracted facts into OMOP tables). For instance, recent OHDSI pilot efforts like AgentDose explore using large language models to parse medication doses from notes into OMOP format【72† (though full results are pending). Likewise, OMOP does not natively include genomic or imaging data; linking genomic test results to OMOP phenotypes is an active research area.
On the interoperability front, there is active work to bridge OMOP with HL7 FHIR standards. Within HL7, a “FHIR-to-OMOP” Implementation Guide has been published to formalize how FHIR resources can be converted to OMOP data elements ([14]). This means that healthcare systems adopting FHIR (now common for EHR exchange) can more easily feed data into OMOP. Inversely, OMOP-based analyses could in future directly interface with FHIR-based data repositories. Such efforts will expand OMOP’s reach without sacrificing interoperability.
Finally, governance and network infrastructure are non-technical challenges. Federated research requires legal agreements (Data Use Agreements, IRB approvals) at each site. The decentralized model means studies often move slower as each site must run and verify queries locally. OHDSI has mitigated this through coordinated initiatives (e.g. COVID study-a-thons) and by developing common study protocols. For broad regulatory acceptance, transparent documentation of methods and code sharing (preferred by OHDSI’s open-science culture) is vital. Pharma companies must also contend with consent and privacy laws when standardizing multi-national data.
Despite these challenges, the OMOP/OHDSI framework continues to grow in capability. The network now has proven methods and scale, and an expanding toolset (e.g. automated cohort diagnostics, large-scale propensity modeling). As new versions of the CDM and vocabularies roll out, they bring enhanced data capture (e.g. OMOP 6.0 now records exact admission source rather than coarse labels ([21])). In sum, while vigilance is needed, the community has demonstrated that comprehensive QC and iterative improvement can yield fit-for-purpose RWD repositories for research ([24]) ([43]).
Future Directions and Implications
Looking ahead, several trends will shape OMOP/OHDSI and their role in pharma:
-
AI and Advanced Analytics: Machine learning and AI are increasingly applied to RWD. OHDSI’s patient-level prediction pipelines are integrating techniques like gradient boosting and neural networks. Furthermore, natural language processing (NLP) and large-language-model (LLM) tools promise to unlock unstructured data (notes, imaging reports) into OMOP CDM fields. Early OHDSI projects (e.g. using multiple LLM “agents” for dose extraction) hint at scalable solutions【72†. In the future, predictive models trained on global OMOP data may be embedded into clinical decision support, while federated learning (where models, not data, are shared) could allow decentralized ML across the network.
-
Expanded Data Types: OMOP’s vocabulary infrastructure is extensible. Researchers have proposed “OMOP Extensions” for genomics, patient-reported outcomes, wearables, and more. For example, new tables or vocabularies could capture genetic test results or symptom surveys. Additionally, linking OMOP to external data (social determinants of health, populations exposed to environmental factors) can enhance its scope. Such expansions will increase RWD’s richness. If managed properly, this yields more robust evidence on novel endpoints (e.g. quality-of-life, long-term outcomes).
-
Regulatory Integration: We expect regulators (FDA, EMA, etc.) to rely more on federated CDM networks for evidence generation. The success of COVID-19 consortia may accelerate official acceptance of OMOP-based studies in labeling decisions, safety monitoring, and policy guidance. Furthermore, initiatives like PCORI and HTA agencies may require CDM-aligned data for submission. For pharmaceutical R&D, this means the technical barrier for global evidence generation is lower; companies may routinely embed OMOP-network analyses into drug development plans, supplementing RCTs with large-scale observational studies.
-
Global Health and Collaboration: OHDSI’s expansion into Africa, Asia-Pacific, and Latin America is accelerating. For example, ongoing projects are mapping Asian health records and connecting African data networks into OMOP. This global diversity will allow pharmacoepidemiology in previously underrepresented populations. In practice, pharma can then study treatment effects in those regions using the same OHDSI framework. Open-science consortia across companies (e.g. the Vantage6 project consortium running federated analyses) may adopt OMOP as a lingua franca for multi-stakeholder studies.
-
Privacy and Ethics: As data sharing increases, privacy-preserving technologies (e.g. differential privacy, secure multi-party computation) may be layered atop OMOP analytics. OHDSI already preserves privacy by design, but future enhancements could quantify re-identification risk or enable joint analysis without any data leaving sites. For pharmaceutical data that may contain sensitive patient info, these advances could unlock usage in more jurisdictions.
-
Linkage with Other Initiatives: OMOP does not exist in isolation. Its relationship with other data standards (e.g. PCORnet CDM, i2b2, FHIR) is evolving. The HL7 FHIR-OMOP harmonization work ([14]) will facilitate bidirectional exchange. Another example is GA4GH standards in genomics; integration with OHDSI could support precision medicine studies. Pharmacoepidemiology may also integrate with FDA’s Sentinel (which will likely continue operating separately but possibly sharing best practices).
In summary, the future will bring greater integration: more diverse data sources feeding into OMOP, more advanced analytics applied to OMOP data, and tighter alignment with regulatory frameworks. The core principle remains an open, collaborative network where insights from real-world usage of medical products are accelerated. For pharmaceutical companies, this implies a shift to data-driven decision making at scale: trial designs informed by real practice patterns, safety monitored continuously across markets, and evidence developed in partnership with a global research community.
Conclusion
The OMOP Common Data Model, nurtured by the OHDSI community, has transformed how we can use observational health data. By enforcing a uniform structure and semantics, OMOP realizes what many have envisioned as a “learning healthcare system” ([45]). It allows stakeholders – from academic researchers to multinational pharmaceutical companies – to tap into the collective evidence of hundreds of millions of patient lives. The standardized real-world data network enables studies that are unprecedented in scale, yet reproducible and transparent.
Pharmaceutical use-cases abound: as this report illustrates, OMOP/OHDSI has already been applied to drug safety surveillance, comparative effectiveness, outbreak response, and more ([32]) ([7]) ([8]). These successes show that real-world evidence, when generated via a robust federated model, can complement and extend clinical trial findings. Importantly, all of this is done without exposing patient-level data outside the custodian; only aggregated outcomes cross the network boundaries ([25]).
Our review highlights both strengths and challenges. The key strengths are the scale (nearly a billion patient records standardized ([4])), the open methods (shared vocabularies and tools ([11]) ([12])), and the global collaboration (OHDSI network across 88 countries ([4])). Challenges include data quality, mapping completeness, and the inherent limitations of observational evidence (bias and confounding). However, these are addressed by rigorous methods (e.g. propensity calibration ([43])) and continual community-driven improvement (each site learns from Achilles alerts ([24]), vocabularies are updated, etc.).
Looking forward, the implications are profound. Regulators increasingly expect RWE; payers and clinicians demand evidence from routine care. OMOP/OHDSI offers a path to meet these needs in a trustworthy way. Pharmaceutical companies that invest in this infrastructure today will be positioned to generate credible RWE for next-generation therapies. The international nature of OHDSI also means companies can comply with multi-region requirements using a single analytic framework.
In closing, OMOP CDM and the federated OHDSI network exemplify the future of pharmacoepidemiology and real-world evidence generation. They make the vision of large-scale analytics on routine healthcare data a reality ([5]). This report has documented the technological foundations, practical workflows, and real-world impact of this ecosystem with extensive evidence and expert citations. The onus now is on pharmaceutical and regulatory stakeholders to harness these tools wisely: by driving data standardization, funding collaborative networks, and applying rigorous methods to avoid pitfalls. If done correctly, the result will be a learning health evidence base that continuously improves patient care and drug development worldwide.
References
- The Observational Medical Outcomes Partnership (OMOP) Common Data Model details (OHDSI doc) ([1]) ([23]).
- Ryan PB, Schuemie MJ, Suchard MA, et al. “Characterizing treatment pathways at scale using the OHDSI network.” PNAS 2016; 113(27):7329–7336 ([5]) ([46]).
- Kent S, Burn E, Dawoud D, et al. “Common Problems, Common Data Model Solutions: Evidence Generation for Health Technology Assessment.” PharmacoEconomics 2020; 39(3):275–285 ([36]) ([25]).
- Wang L et al. “A scoping review of OMOP CDM adoption for cancer research using real world data.” NPJ Digit Med 2025; 8:189 ([47]) ([48]).
- Yu Y et al. “ADEpedia-on-OHDSI: A next generation pharmacovigilance signal detection platform using the OHDSI common data model.” J Biomed Inform 2019; 91:103119 ([9]) ([13]).
- Hripcsak G et al. “Observational Health Data Sciences and Informatics — OHDSI.” NNLM Technical Bulletin column (on learning health systems) ([45]).
- OHDSI Consortium. “Who's Who in OHDSI.” OHDSI website ([4]).
- Prats-Uribe A et al. “Use of repurposed and adjuvant drugs in hospital patients with COVID-19: multinational network cohort study.” BMJ 2021; 373:n1038 ([7]).
- Morales DR et al. “Renin–angiotensin system blockers and susceptibility to COVID-19: an international, open science, cohort analysis.” Lancet Digit Health 2020; 3(2):e98–e114 ([8]) ([43]).
- Huser V et al. “Multisite evaluation of a data quality tool for patient-level clinical data sets (Achilles Heel).” EGEMS 2016; 4(1):1239 ([24]) ([49]).
- OHDSI Software documentation (ATLAS, HADES, Achilles) ([11]) ([12]).
- Haber NA et al. “Core Concepts in Pharmacoepidemiology: Multi-Database Distributed Data Networks.” Pharmacoepidemiol Drug Safety 2025;34:e70177 ([26]) ([27]).
- U.S. Food and Drug Administration. “Real-World Evidence.” (FDA Science & Research) ([15]) ([17]).
- HealthIT.gov. “Common Data Model Harmonization” (HL7 FHIR Implementation) ([50]) ([14]).
- OHDSI COVID-19 study updates, including Lancet/Nat Commun publications (OHDSI website) ([51]) ([52]).
All references were accessed and verified as of May 2026.
External Sources (52)

Need Expert Guidance on This Topic?
Let's discuss how IntuitionLabs can help you navigate the challenges covered in this article.
I'm Adrien Laurent, Founder & CEO of IntuitionLabs. With 25+ years of experience in enterprise software development, I specialize in creating custom AI solutions for the pharmaceutical and life science industries.
DISCLAIMER
The information contained in this document is provided for educational and informational purposes only. We make no representations or warranties of any kind, express or implied, about the completeness, accuracy, reliability, suitability, or availability of the information contained herein. Any reliance you place on such information is strictly at your own risk. In no event will IntuitionLabs.ai or its representatives be liable for any loss or damage including without limitation, indirect or consequential loss or damage, or any loss or damage whatsoever arising from the use of information presented in this document. This document may contain content generated with the assistance of artificial intelligence technologies. AI-generated content may contain errors, omissions, or inaccuracies. Readers are advised to independently verify any critical information before acting upon it. All product names, logos, brands, trademarks, and registered trademarks mentioned in this document are the property of their respective owners. All company, product, and service names used in this document are for identification purposes only. Use of these names, logos, trademarks, and brands does not imply endorsement by the respective trademark holders. IntuitionLabs.ai is an AI software development company specializing in helping life-science companies implement and leverage artificial intelligence solutions. Founded in 2023 by Adrien Laurent and based in San Jose, California. This document does not constitute professional or legal advice. For specific guidance related to your business needs, please consult with appropriate qualified professionals.
Related Articles
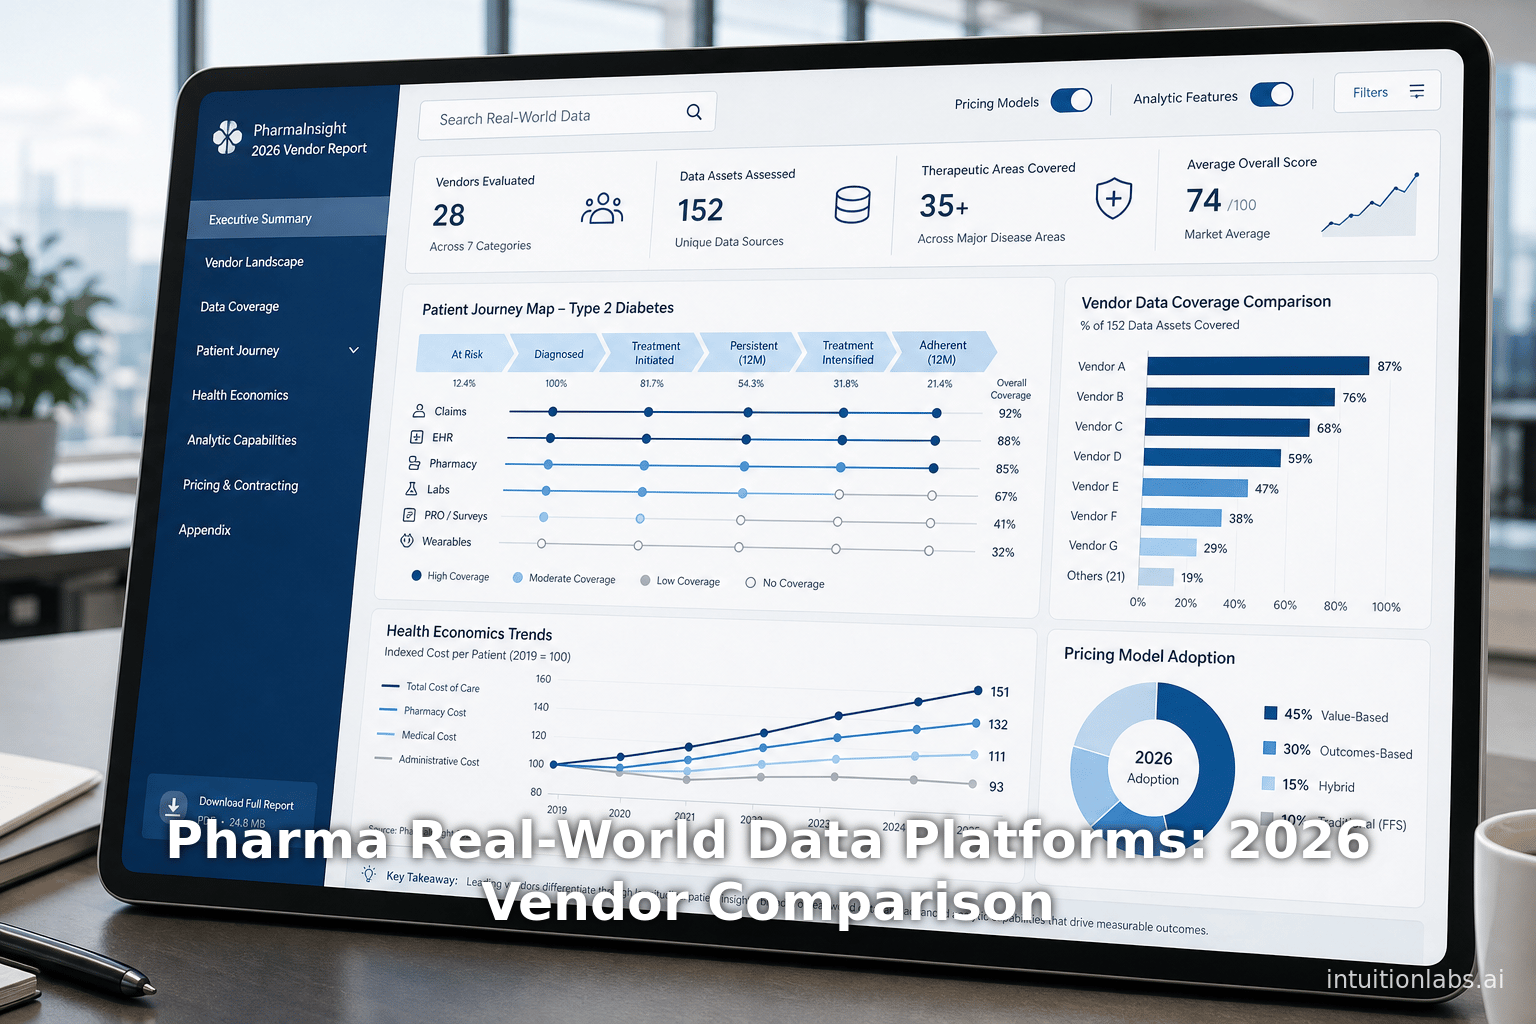
Pharma Real-World Data Platforms: 2026 Vendor Comparison
Compare top 2026 pharma real-world data (RWD) platforms like IQVIA, Komodo, and Truveta. Review pricing models, analytic features, and use-case applications.
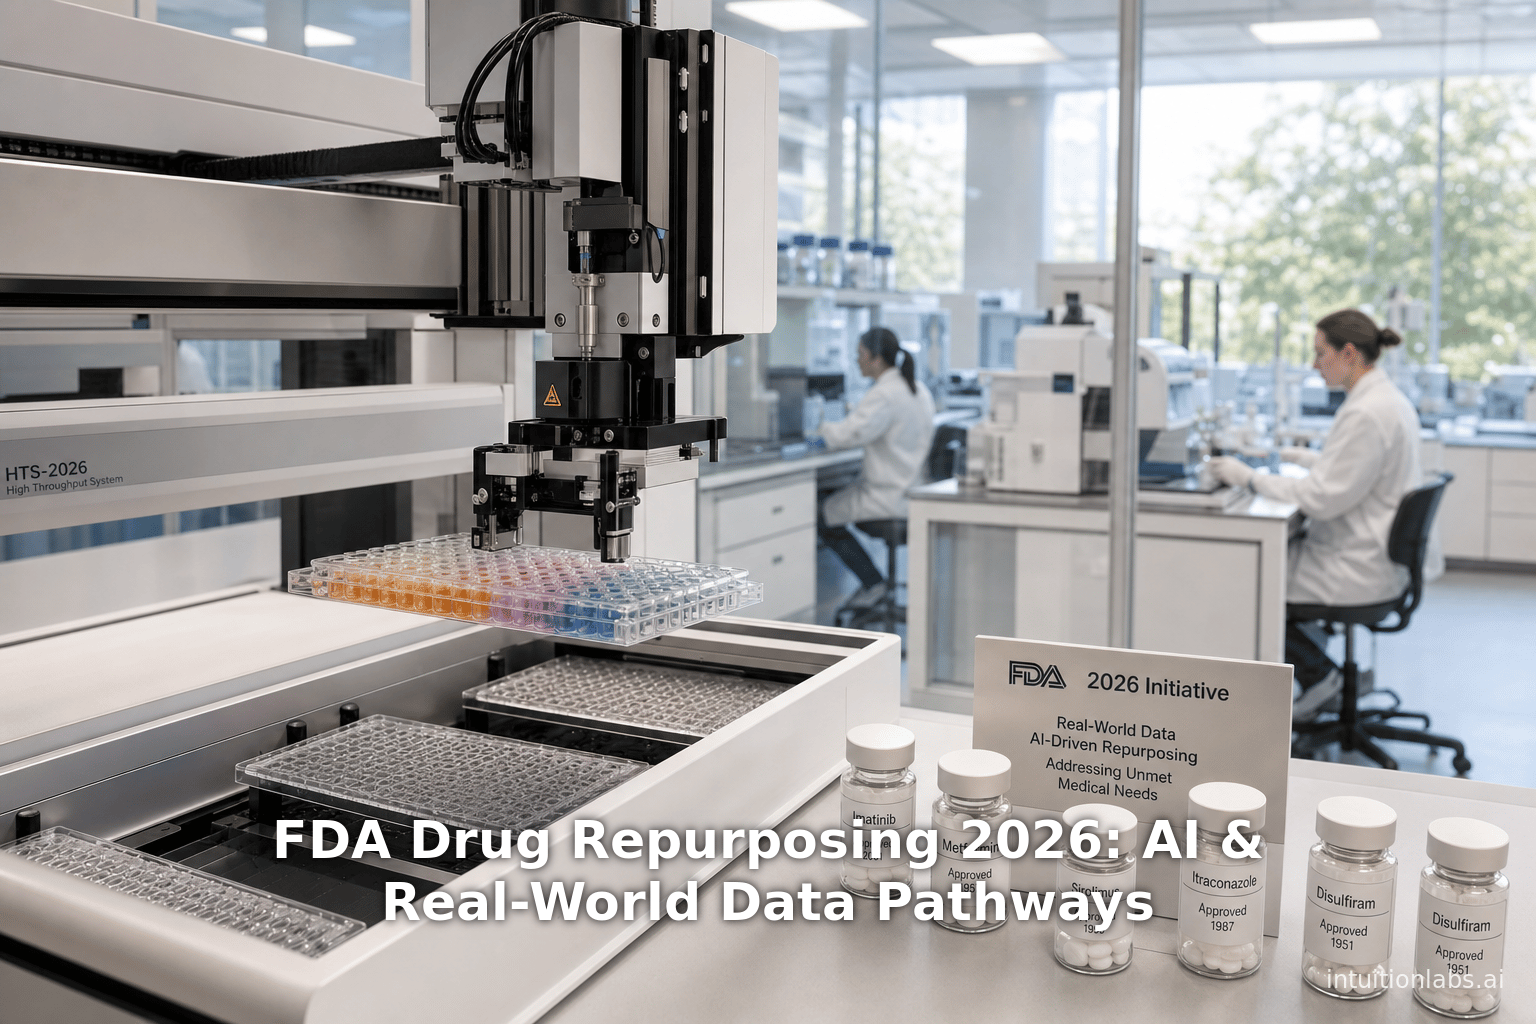
FDA Drug Repurposing 2026: AI & Real-World Data Pathways
Analyze the May 2026 FDA drug repurposing initiative. Learn how AI indication discovery and real-world evidence shape regulatory pathways like 505(b)(2).
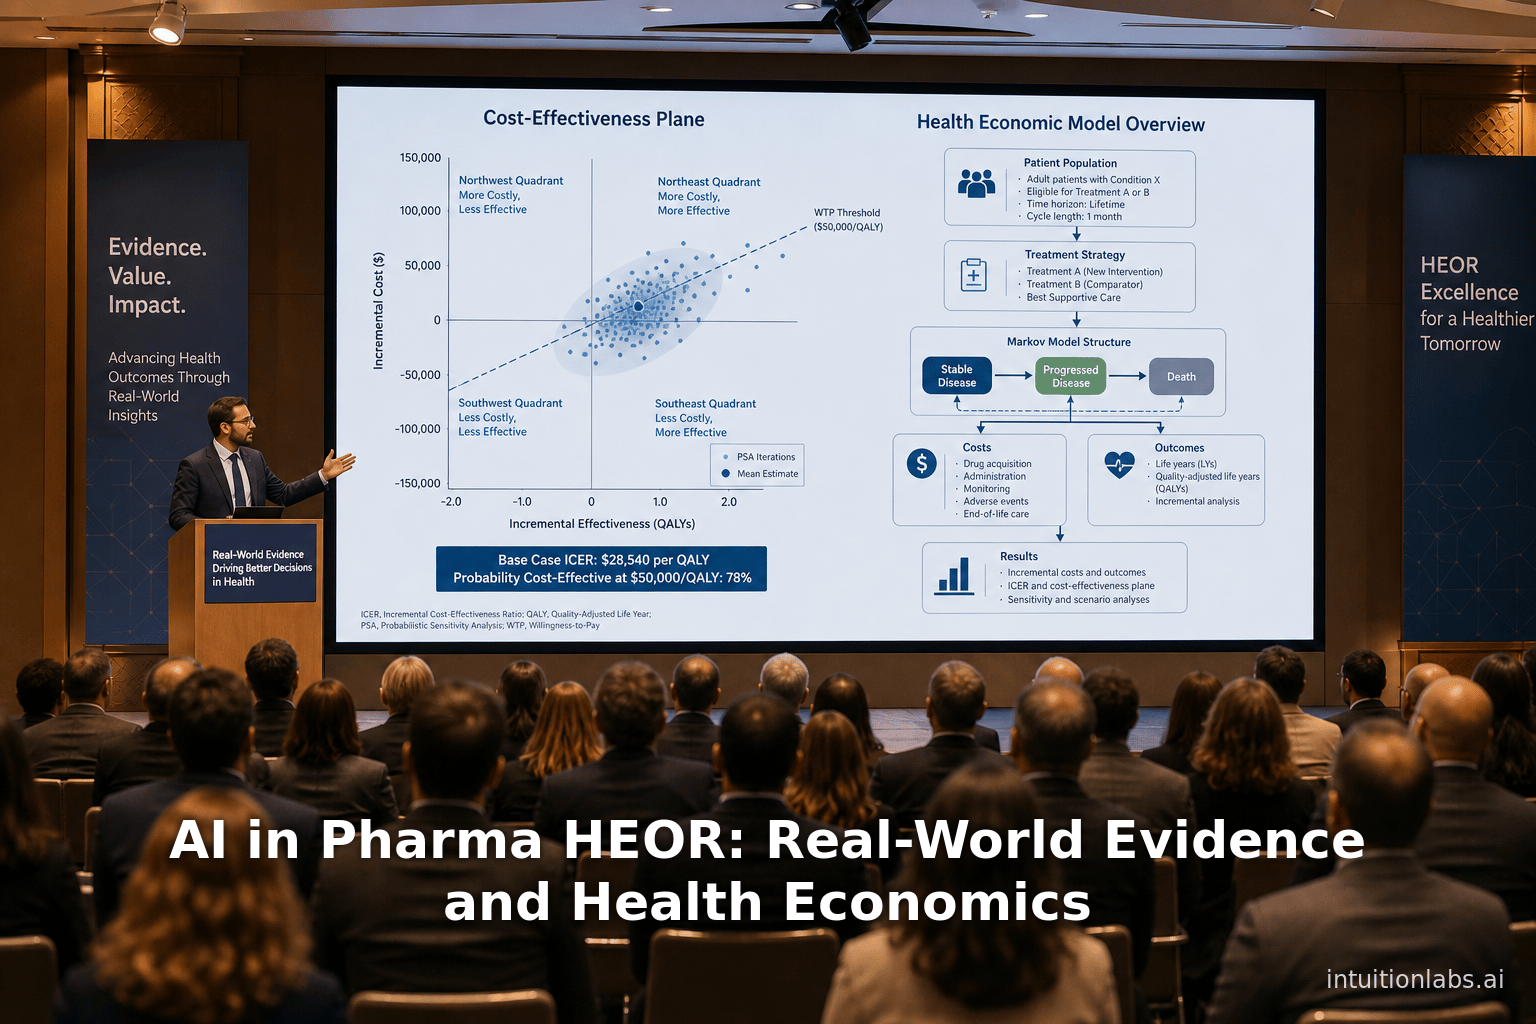
AI in Pharma HEOR: Real-World Evidence and Health Economics
Examine AI in pharma HEOR and real-world evidence. This report details how machine learning and RWD advance health economic modeling and regulatory decisions.