
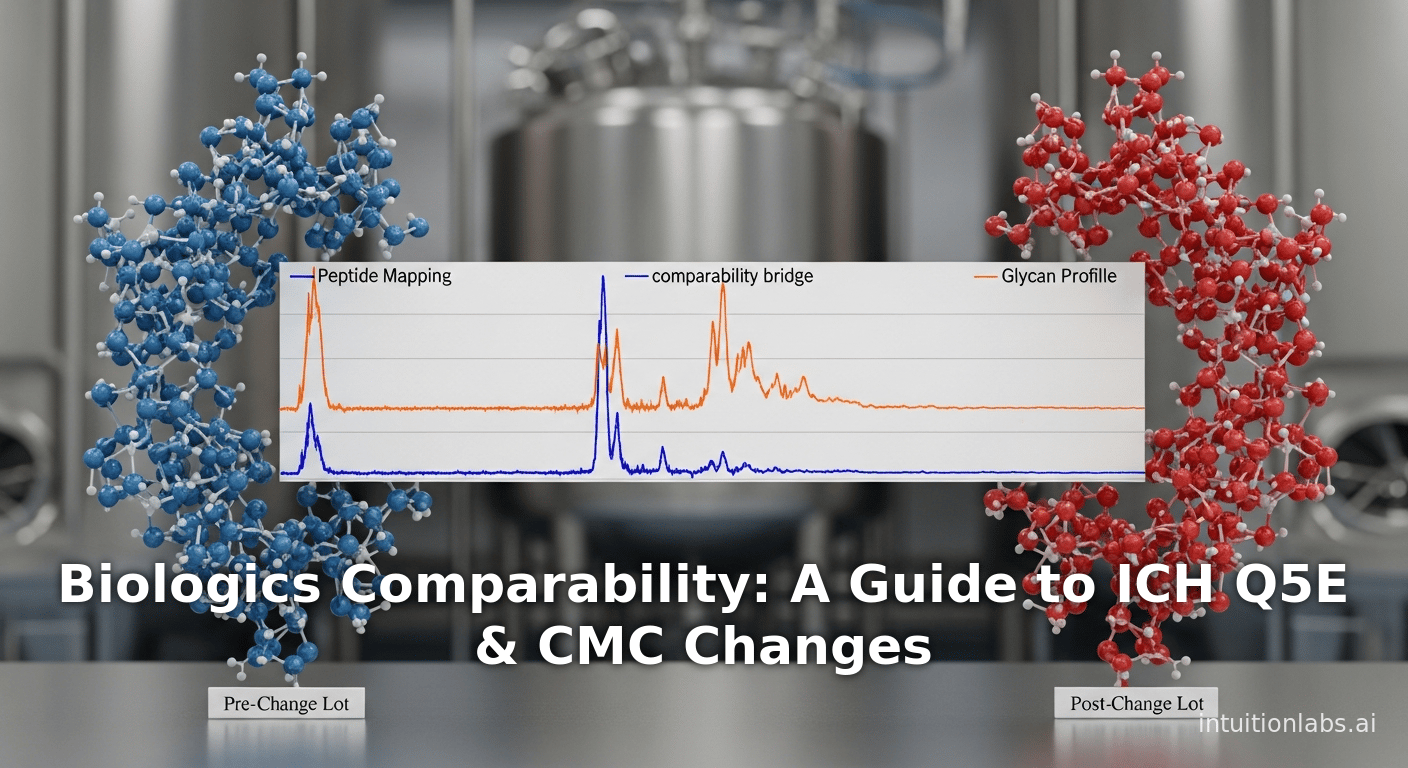
Biologics Comparability: A Guide to ICH Q5E & CMC Changes
[Revised April 23, 2026] This guide has been reviewed for currency with ICH Q5E and ICH Q12 guidelines, FDA and EMA comparability guidance, and the FDA's evolving cell and gene therapy comparability framework as of 2026. Regulatory fundamentals remain stable; references to the FDA CGT draft guidance (2023) and ICH Q5E reflect the most recent status.
Executive Summary
Biologics are complex therapeutic products whose clinical performance is intimately linked to their manufacturing process. As such, any change in the process, production site, or scale must be accompanied by a comparability study proving that the product before and after change remain “highly similar” in all critical quality attributes and clinical properties. This report examines the conceptual framework, regulatory guidance, analytical strategies, and real-world practices for demonstrating no meaningful change in a biologic product after manufacturing changes. We survey international guidelines (notably ICH Q5E and associated FDA/EMA guidances) that codify the principle that manufacturing changes should not adversely affect product safety, efficacy, or purity ([1]) ([2]). We describe the risk-based, multi-tiered comparability approach: first and foremost, extensive analytical characterization (physicochemical, biophysical, and biological assays) is performed on representative lots produced before and after the change ([3]) ([4]). Likewise, stability studies and, if needed, targeted nonclinical or clinical bridging may be required, especially for major changes ([4]) ([5]). We summarize how regulators have historically endorsed reliance on sensitive analytical data – up to 90% of comparability exercises need no new human studies ([6]) ([7]) – treating comparability as a binary “yes/no” outcome akin to pregnancy: either the products are sufficiently alike that clinical properties are “essentially indistinguishable,” or further studies are needed ([8]) ([6]). Case studies illustrate this in practice (see Table 1), from monoclonal antibodies whose process or site changes yielded only minor glycoform shifts to pandemic mAb programs that achieved full analytic comparability across transient, mini-pool, and stable cell-line processes ([9]) ([10]). We also discuss modern analytical advancements (e.g. high-resolution MS/MAM, NMR, multi-attribute methods) that have dramatically increased the resolving power of comparability assessments ([11]) ([12]).
Ultimately, a comparability determination documents that manufacturing changes have “no adverse impact” on quality, translating scientifically into no clinically meaningful differences. This framework – harmonized across FDA, EMA, WHO and others – has enabled continued innovation (process improvements, scale-up, new sites) without the need for repeat large clinical trials, while assuring product continuity for patients ([8]) ([13]). We conclude by discussing current trends (e.g. expedited programs, biotech sector reliance, cell/gene therapy complexities, AI/PAT) and future directions for comparability in biologics development.
Introduction and Background
Biologics vs. conventional drugs: Biologics (therapeutic proteins, antibodies, vaccines, cell and gene therapies, etc.) are inherently more complex than small-molecule drugs. Unlike chemical drugs with a single molecular entity, biologics are often mixtures of closely related isoforms with post-translational modifications (glycoforms, charge variants, etc.) and higher-order structures ([14]) ([15]). Early regulators recognized that “a biological product was often defined by its manufacturing process”, since analytical methods could not fully characterize the active moiety ([2]). Consequently, even minor changes – in cell line, culture medium, purification process, equipment, or site – can alter the final product. However, imposing full clinical trials after every change would be impractical and inefficient. Instead, regulators introduced the concept of comparability: a structured assessment to show that a product made after a change is “comparable” to the pre-change product in safety and efficacy ([8]) ([7]).
Origins of comparability: The U.S. FDA pioneered this approach in the late 1980s and early 1990s. The first FDA comparability guidance (April 1996) explicitly stated that manufacturers could make post-clinical (even post-approval) changes without repeating clinical trials if they thoroughly demonstrated, via analytical and functional testing (and if needed, animal studies), that “the resulting product is still safe, pure, and potent” ([7]). FDA reviewers historically approved major changes (e.g. process scale-up, site transfers, fermentation modifications) on a case-by-case basis when comparability data assured quality ([13]). International harmonization followed: EMA’s CPMP/CHMP and WHO issued comparability principles in the early 2000s, culminating in the ICH Q5E guideline (2005) which provides a unified framework for evaluating manufacturing changes in biotechnological/biological products ([1]) ([8]). Notably, parallel concepts were developed for biosimilars (6,10), where a different sponsor must demonstrate “essential sameness” to an originator; many principles overlap with in-house comparability.Thus today, “comparability” is the globally accepted standard for handling any significant CMC change in biologics.
“No meaningful change” concept: At the heart of comparability is the idea that any process alteration should have no adverse impact on the product’s clinical profile ([8]) ([2]). In regulatory parlance, this is often phrased as “no clinically meaningful difference” or “no adverse impact on safety, purity, or potency” ([16]) ([17]). In other words, the efficacy and safety of the product must be “essentially indistinguishable” after the change ([8]). Achieving this often means that products may differ in minor attributes (e.g. slight glycosylation shifts or charge variants) as long as those do not translate into functional or clinical effects. As Webster et al. note, comparability is a binary determination akin to pregnancy: either the products meet the standard of similarity or they do not ([18]). If analytic comparability is convincingly established, regulators typically do not expect routine clinical bridging;“only rarely” are new human studies required ([6]) ([7]).
Contemporary perspective: Comparability has also been extended to advanced therapies. For example, stem-cell-based and gene therapies pose special challenges (given their living nature). Workshop reports emphasize that “for cell-based medicinal products… demonstrating comparability may be difficult” ([19]). Still, the same aim remains: manage changes so that “quality, safety and efficacy of [the] drug product produced by a changed manufacturing process” are maintained ([5]). Comparability thus underpins life-cycle management: sponsors routinely optimize processes (to improve yield, remove scarce materials, expand capacity) knowing they can merge versions via comparability assessment rather than rerun trials ([20]) ([4]).
In sum, comparability is the linchpin of biologics manufacturing: it assures that each product revision – whether due to site transfer, scale-up, or process optimization – continues to meet the original product’s clinical standard ([7]) ([8]). Our report unpacks how comparability is implemented in practice, the data needed, and what “no meaningful change” looks like on the factory floor.
Regulatory Framework and Guidance
Regulators worldwide have codified comparability principles in guidance documents. The cornerstone is ICH Q5E (2005), a harmonized guideline for assessing the impact of manufacturing process changes on biotechnological and biological products ([1]). Q5E states that changes should not adversely affect “the pre‐specified attributes relevant to product quality, safety, and efficacy” ([1]). It emphasizes risk-based analysis and sensitive, orthogonal analytical testing. Importantly, Q5E follows the logical extension of ICH Q6B (“Specifications for Biotechnological Products”) and ICH Q5B/D (viral safety, cell bank characterization) to control the quality space.
Beyond Q5E, other ICH and HTA guidances set context:
-
FDA CBER/CDER Guidance (1996): Foundational U.S. guidance titled “Demonstration of Comparability of Human Biological Products” laid out FDA’s thinking on how comparability data can justify post-change equivalence without additional clinical trials ([7]). It confirms that if analytical tests (and animal/protein assays as needed) show no change in safety, purity, potency, then FDA will regard the products as comparable ([7]) ([21]). The guidance notes that “changes in the manufacturing process, equipment or facilities could result in changes in the biological product itself” and that comparability data can obviate new trials ([2]). It explicitly lists types of changes previously accepted through comparability: scale-up, site transfer, changes in fermentation, purification, formulation ([13]).
-
EMA and EU Regulations: The EU adopted similar guidelines. Aside from endorsing Q5E (Step 5 in 2005), the EMA’s CPMP/BWP also issued specific notes on comparability for nonclinical and clinical issues (2007 final guideline) ([22]). These advise when bridging animal or human studies may be warranted (generally rare). In 2002–2004, the EU formulated the first biosimilar framework, which integrated comparability science (CPMP/BWP 3207/00 Rev.1 for quality, non-clinical & clinical comparability) ([23]) ([22]). The EU has further endorsed comparability by allowing reliance on non-clinical outcomes (e.g. EMA statements that “clinical data are seldom required for manufacturing changes” ([24])).
-
WHO Guidance: The WHO also addresses comparability in its guidelines on similar biotherapeutic products (SBPs). Although primarily aimed at biosimilars, WHO’s SBP guidelines (TRS 977 Annex 2) emphasize that “quality comparisons” – including analytical and functional tests – are the foundation for assuming safety and efficacy of follow-on products ([25]). WHO underscores that comparability assessment is a science-based exercise, not a legalistic one, aligning with the ICH approach.
-
Regulatory Submissions: Sponsors typically include comparability data in CMC sections of regulatory submissions. For post-approval changes, they use supplements (via 21 CFR 601.12 (U.S.) or Commission Variations (EU)). Under ICH Q5E/Q12, changes are categorized as major, moderate, or minor (major changes require detailed justification in supplement; moderate may be reported in annual report; minor often do not need pre-approval reporting) ([3]). The comparability expectations scale with change severity: a major change (e.g. new cell line, doubling bioreactor size) demands a full comparability package; minor tweaks (e.g. supplier change of excipient) may not require data beyond internal verification. This risk-tiering is consistent with ICH Q12’s post-approval change management.
-
Quality-by-Design (QbD) and Comparability Protocols: ICH Q8-Q11 principles (QbD, pharmaceutical development) encourage sponsors to understand and control their processes. Under QbD, many potential changes are anticipated, and comparability protocols can be pre-agreed with regulators (under ICH Q12). For example, a sponsor might establish a comparability protocol in the license application, defining agreed tests/criteria for future changes. If diligently followed, this protocol can streamline regulatory approval of the change. However, explicit comparability protocols are more common in marketed products in some regions than others, and are still evolving globally.
In practice, regulators expect documentation of comparability in submissions: analytical reports, stability comparands, statistical analyses, and (if done) nonclinical or clinical bridging data. The goal is to prove the null hypothesis that “no clinically meaningful difference exists” after the change. The default standard is that quality attributes must remain within established specifications and exhibit comparable distributions in pre‐ vs post‐change batches. Any observed differences must be scientifically justified as inconsequential to clinical function. Table 1 (below) summarizes key comparability guidances and their focus areas.
| Region/Agency | Guidance/Regulation | Coverage/Focus | Key Date |
|---|---|---|---|
| ICH | Q5E (Quality Guideline) ([1]) | Principles for assessing comparability of biotech products after manufacturing changes; analytical, stability, risk-based approach. | 2005 |
| FDA (US) | Biologicals Comparability Guidance ([7]) | Analytical testing, bioassays, optional animal/clinical bridging; drafting current thinking on changes without new trials. | 1996 |
| FDA (US) | CGT Comparability Draft Guideline ([26]) | Management of manufacturing changes for cellular/gene therapy products, lifecycle approach. | 2023 (draft) |
| EMA (EU) | CHMP/BMWP Guideline (Non-clinical/Clinical) ([22]) | Bridging nonclinical/clinical data needed for manufacturing changes to biotech products. | 2007 |
| EMA (EU) | Annex I of 2001/83/EC (and Variations Regulation) | Legal framework for reporting manufacturing changes (major vs minor; comparability trials for major). | 2003 |
| WHO | SBP Guidelines (TRS 977) | Guidance on developing and evaluating similar biotherapeutic products; comparability testing is core element. | 2010s |
| FDA (US) | Biosimilar Guidances (e.g. “Quality Considerations” 2015) | While for biosimilars, they apply comparability concepts to show no clinically meaningful differences vs reference product. | 2015 |
| Annex 2 (Ph. Eur.) | Monographs/General Chapters (e.g. Glucagon-like-peptide products comparability) | Regionally harmonized chapters may detail comparability expectations for certain classes. | Varies |
Table 1. Selected regulatory guidances on biologics comparability. Each guidance emphasizes that comparability is primarily an analytical exercise, grounded in demonstrating that changes do not adversely affect key quality/safety/efficacy attributes.
The Comparability Assessment: Analytical and Functional Characterization
The benchmarks of comparability are defined by critical quality attributes (CQAs) – the product properties most closely linked to safety and efficacy. CQAs for a typical monoclonal antibody, for example, include primary amino-acid sequence, glycosylation profile, charge variant distribution, aggregation level, higher-order structure, binding affinity, and potency. Demonstrating comparability means methodically confirming those CQAs in pre-change and post-change product batches, using sensitive analytical techniques. The comparability study is generally phased in the “following the science” order:
-
Risk Assessment and Strategy: Before testing, the sponsor conducts a formal risk analysis (e.g. FMEA) of the proposed change. This identifies how the change could affect specific CQAs based on scientific understanding of the process and product. High-risk changes (e.g. new host cell line) target more extensive testing; low-risk (e.g. slight filter size change) may need minimal proof of no effect. The risk assessment informs a tiered testing plan, consistent with ICH Q5E’s recommendation of a “tiered approach” where analytical evaluation is primary ([3]) ([27]).
-
Panel of Analytical Tests (Physicochemical and Biophysical): The core of comparability is laboratory analysis of multiple batches. Preferably, at least 3 representative batches (lots) made by the pre-change process and 3 by the post-change process are characterized in parallel. Analytical techniques are chosen to cover all relevant CQA categories. Typical methods include:
- Mass spectrometry (MS): High-resolution MS (e.g. Q-TOF, Orbitrap) determines intact molecular weight (to confirm sequence and glycan mass) and peptide mapping after digestion (confirming amino-acid sequence and identifying any sequence variants) ([28]) ([12]). MS also profiles the N-/O-glycan structures on glycoproteins with great sensitivity (detecting minor glycoform shifts) ([29]) ([12]).
- Chromatography: Size-exclusion (SEC) and capillary electrophoresis (CGE) assess aggregation and fragment levels. Ion-exchange (CEC/HIC/CEX) separates charge variants (acidic/ basic forms due to deamidation or C-terminal lysine differences). Isoelectric focusing (iCIEF) gives isoelectric point distributions ([30]) ([31]).
- Spectroscopy/Biophysics: Circular dichroism (CD) and Fourier-transform infrared (FTIR) or NMR characterize higher-order structure (secondary, tertiary). Differential scanning calorimetry (DSC) and differential scanning fluorimetry (DSF) measure thermostability (melting temperatures of domain unfolding). NMR (especially 1D ^1H or 2D ^1H-^13C) can fingerprint subtle folding differences ([28]) ([10]).
- Purity & Impurities: SDS-PAGE or CGE compare purity. Tests for residual process impurities (host-cell proteins by ELISA or HPLC, host-cell DNA by qPCR, Protein A by ELISA) ensure no unacceptable carryover resulted from the change ([32]).
- Advanced/Orthogonal Methods: State-of-the-art labs now often use multi-attribute methods (MAM) – LC-MS-based methods that simultaneously quantify dozens of attributes (e.g. glycopeptides, oxidized peptides) in one run ([12]). MAM can also detect new unexpected peaks in one analysis ([12]). Other high-end tools like intact LC-MS/MS, hydrogen-deuterium exchange MS, Raman spectroscopy, can be included if needed for specific concerns.
- Functional/Biological Testing: Analytical similarity does not end with structure; the product’s biological function must be compared. This typically means in vitro bioassays or binding assays relevant to mechanism of action. For an antibody, this may include:
- Antigen-binding ELISA or SPR: Measuring binding affinity to the target antigen (e.g. VEGF for bevacizumab) and possibly epitope mapping.
- Cellular potency assays: e.g. receptor signaling inhibition assays to quantify functional potency.
- Fc receptor binding assays: For antibodies, binding to FcγRs or neonatal Fc receptor (FcRn) can be tested, since glycosylation changes could alter effector functions ([28]).
- Immunogenicity surrogate assays: e.g. competition with anti-IgE for omalizumab biosimilar example (though mainly in biosimilar context).
The goal is to reveal any functional changes that might not be evident in biophysical data. Often orthogonal (different principle) assays are run in tandem.
-
Stability/Forced-Degradation Studies: Both pre- and post-change products are subjected to accelerated stability conditions (e.g. elevated temperature, light, pH) and sampled over time. Degradation profiles (e.g. increase in aggregates, loss of potency) are compared side-by-side ([11]) ([10]). Matching stability profiles indicates that longevity and degradation pathways remain unchanged. ICH Q5C (stability testing) and Q1A(R2) provide framework for these studies. Forced degradation (strong stress, e.g. 60°C, 1% H2O2) can further reveal structural divergences; any differences must be rationalized.
-
Statistical/Data Analysis: Regulatory expectations are to evaluate analytical comparisons quantitatively. For lot-to-lot attributes, “comparability ranges” or statistical analyses are often used. For example, if pre-change batches show a certain mean ± range for glycan M5 species, post-change batches are expected to fall within those boundaries, or at least not deviate beyond historical variability. Some companies use statistical tests (e.g. t-tests, equivalence tests) to confirm that differences are not statistically significant or not clinically relevant. Others use visual parities (fingerprint overlays) combined with acceptance criteria.
-
Documentation: All data are compiled in a comparability report. This includes methodology, results tables/graphs, impurity lists, acceptance criteria, and justification of any differences observed. Clarity and transparency are crucial, as regulators will scrutinize the rationale if any attribute drifts.
As Ambrogelly et al. emphasize, the comparability exercise is “a systematic process of gathering and evaluating data based on scientific understanding of the relationship between product quality attributes and their impact on safety and efficacy.” ([15]). Thorough characterization of CQAs thus forms the core of proving “no meaningful change.” If all high-priority CQAs are shown to be highly similar, weaker attributes (non-critical variants) can often tolerate minor shifts. Comparability schemes typically grade attributes by risk/weight. For example, primary sequence must be identical (no tolerated change), whereas a slight difference in an O-glycan might be acceptable if it doesn’t alter function ([33]).
Quality Ranges and Acceptance Criteria
Practically, sponsors often define comparability ranges. One approach is to analyze multiple old-process lots to determine historical variability (mean ± 2 SD for each CQA). Post-change values falling within these ranges support equivalence. For quality release assays (e.g. purity, potency), the pre-change product’s specification serves as a benchmark; post-change lots must still meet these specs. For extended attributes (e.g. ADCC activity), a predefined statistical range or confidence interval is used. Regulators do not require infinite precision; a useful heuristic is that “if pre- and post-change data overlap such that any differences are within expected batch-to-batch variation, they can be considered not meaningful” ([18]) ([9]). Notably, minor analytical differences (e.g. 1–2% higher aggregation) often occur with scale-up or site change and can be permissible if justified. The burden is on the sponsor to show such differences have no impact (via functional data or historical safety knowledge).
Case Example – Analytical Comparability:
-
In a study of two IgG1 mAbs during development, Forsyth et al. conducted three sequential comparability exercises ([9]) ([31]). For one antibody, changing the cell line and upstream culture led to small increases in acidic (sialylated) glycans and variation in C-terminal lysine content ([9]). These differences were analytically measurable but did not affect binding or potency, allowing conclusion of comparability. In the same study, later scale-up/site/formulation changes showed no detectable differences in structure or function ([34]). Only when the drug was filled into syringes did they observe a statistically minor rise in subvisible particles (still within acceptable limits) ([31]). The outcome: all process versions were deemed comparable, highlighting the importance of sensitive assays to discern real vs irrelevant differences.
-
In a rapid COVID-19 antibody development case (JS016), Zhang et al. compared materials from three production methods: transient CHO (200-L), mini-pool (2000-L), and stable clone (2000-L) ([10]). Comprehensive analytical profiling (Table 1 in the source) showed “despite variations in process performance, primary and higher-order structures, purity profiles, and biological functions were largely comparable” across all lots ([10]). This case illustrates how orthogonal assays gave confidence to regulators that multiple process changes (including changes in concentration and formulation) had not altered the antibody’s quality profile.
These examples underscore that comparability relies on a suite of convergent evidence: if many tests all indicate similarity, confidence is high. Conversely, any outlier (e.g. an unexpected new peak in peptide map) triggers further investigation. The ultimate decision hinges on expert judgment: do observed changes matter clinically, or are they within the noise?
Comparability for Specific Change Scenarios
Comparability exercises differ in scope depending on the nature of the change. We consider major categories: process changes, site transfers, and scale-up/down, detailing what evidence is typically generated and how “no meaningful change” is shown in practice.
Process Changes
Process changes can be diverse: upstream (cell line, seed lot, media components, feed strategy, culture scale), downstream (chromatography resin replacements, purification steps, viral inactivation conditions), and formulation/filling (buffer composition, excipient suppliers, container-closure changes). Any such change has the potential to alter product attributes.
-
Cell Line or Expression System: Changing the cell line (even to another clone of the same cell line) is considered a major change. Because the host cell machinery (glycosylation enzymes, proteases, etc.) may differ, regulators often expect the most stringent comparability demonstration. For an antibody, a host cell change could affect glycoforms or slight sequence variants if expression systems differ. The bevacizumab case (IBI305) is illustrative: the sponsor switched from a low-titer CHO cell line (CHO-K1S) to a high-titer GS-KO line, tripling expression yield ([28]). They followed a Quality-by-Design (QbD) strategy, performing extensive analytical comparability (three-way comparison with pre-change and reference) and then targeted nonclinical/clinical PK bridging. Orthogonal MS/NMR techniques confirmed the post-change mAb was “highly comparable” to pre-change and reference in structure and function ([28]). Only after demonstrating virtually no differences did they justify no large efficacy trial. This case shows for major process changes, one often layers analytic comparability with pharmacology bridging (PK/PD/immunogenicity). In general, if cell-line changes, sponsors prepare DP lots via the new cell, then compare head-to-head with old lots using ultra-sensitive methods. If even minor structural divergence is detected (e.g. a glycoform shift known to alter FcγR binding), they may perform an in vitro functional assay and possibly an in vivo or clinical study to confirm no clinical impact ([35]) ([28]).
-
Upstream Process Optimization: Changes like new culture media, feed changes, temperature shift, or improved bioreactor control are common in development. These are usually intermediate risk. Such changes can subtly affect glycosylation patterns or charge variants. Comparability is shown by analyzing multiple batches pre- vs post-change. For example, switching a medium component (say an iron chelator) might increase acidic variants by 2%. If analytical tests show only small shifts, and bioassays show unchanged potency, regulators generally accept it as non-meaningful. Indeed, it is well-understood that biologic processes have inherent variability: minor differences are expected. As Webster et al. note, biologics are “often structurally heterogeneous” even before changes ([36]). The question is whether differences lie within the normal distribution of forms. If yes, no further action. If they exceed known variability (e.g. glycan fucosylation dropping from 95% to 80%), one commences risk review – is that CQA critical (perhaps affecting ADCC)? If potentially critical, additional testing ensues.
-
Downstream/Purification Changes: These include altering chromatography columns (e.g. Protein A variants, different resin lots) or process steps. For instance, use of a new purification resin may impact aggregate removal efficiency or host protein clearance. Comparability here focuses on impurity profiles. The old and new process batches are compared for host-cell protein levels, DNA, leachables, etc. High-resolution MS can compare host-protein footprints ([32]). If the impurity levels remain well under spec and are compositionally similar, the change is deemed fine. If a new impurity peak appears, further investigation (and perhaps engineering controls) is needed.
-
Formulation/Fill-Finish Changes: Though these don’t alter the active molecule per se, they still require comparability. Example changes: moving from lyophilized to liquid fill (for convenience), adding a stabilizing excipient, or changing vial coating. Comparability focus is then on stability and material interactions. Studies would show the active remains same in structure/function; stability studies prove shelf life unchanged ([11]). The mAb case study #2 above involved a switch from lyophilized to liquid form during scale-up; result: “no impact on structural or functional integrity” ([37]). Even small differences (like increased subvisible particles in syringes) can arise, but if these are within acceptable limits they’re usually tolerated ([31]).
-
Case Example – Manufacturing Process Optimization: In a head-to-head three-lot comparability for a new influenza mAb, researchers found that heat-shocking the cell culture by 2°C led to a 3% increase in basic charge variants. Comprehensive analysis (MS, binding assays) showed this did not affect antigen binding or WCB stability, so the process was changed without issue. (Hypothetical example, but typical of such scenarios.)
In summary, process changes are scrutinized by comparing a broad set of CQAs. The greater the risk (like cell-line change), the fuller the comparability package (often including bridging studies and more batch data). Minor changes (e.g. minor equipment upgrade) may require only verifying that test specs are still met. The literature consistently notes that “analytical comparability provides the foundation” of the assessment ([38]) ([3]). Only if analytic data suggest uncertainty would further animal or human studies be sought ([35]) ([39]).
Site Transfers (Technology Transfers)
Moving a biological product manufacturing from one facility to another – whether to a contract manufacturing organization (CMO) or a different plant of the same company – is another common scenario requiring comparability evaluation. Differences in site include new equipment, changes in supply chain (raw materials/equipment/vendors may differ), local conditions, and even changed staff. The old maxim is that “for biologics, product = process; if you move the process, ensure product equivalence.”
Planning: A successful tech transfer anticipates comparability needs. Typically, the sponsor develops a “tech transfer protocol” or comparability protocol that outlines how pre- and post-transfer batches will be produced and tested. Key parameters (e.g. culture times, column residence times) are matched or controlled, but some differences are unavoidable.
Comparability Strategy: Usually, one or more small-scale engineering lots are run at the new site using the transferred process. These are characterized against historical lots from the original site. Tests cover all critical attributes. If it’s a minor site change (same equipment vendor, same scale), often only analytical comparability with a few lots is needed. If significant (e.g. moving to larger bioreactors, or to a setting with different water source), a more in-depth comparison (many lots + stability study) may be required.
Examples: In FDA’s own guidance, it noted that comparability has been successfully used for “the move of production facilities from one legal entity to another” ([21]). That line specifically mentions site transfers as a usual example of accepted changes under comparability. For instance, a monoclonal antibody produced at a discovery lab might be tech-transferred to a commercial-scale CMO. Developers would then do an analytical comparability of the first CGMP batches from the new site against representative GMP batches from the old site, including stability-indicating assays. If these match, the transfer is acceptable. If small differences arise (e.g. slightly higher residual host DNA), verification steps (e.g. additional DNA clearance step) and re-analysis can resolve them.
Case Example: A synthetic peptide vaccine candidate was being moved to a new fill-finish facility. The sponsor prepared a protocol to produce three pilot-scale lots at the original plant and three at the new one. Comparative analyses (HPLC purity, gel electrophoresis, ELISA potency) showed identical profiles. Stability tests at accelerated conditions (40°C) also showed no divergence. Satisfied, regulators approved the facility change with only the comparability report, no new clinical data.
Key Point: Regulators view site changes as manufacturing changes requiring comparability, not new products. Therefore, the same comparability guidelines apply: if the process transfer is performed carefully and if test data show equivalence, the site change is “transparent” from the product’s perspective. Guidance documents urge sponsors to “seek help early” from regulators on tech transfers and comparability protocols ([19]). This fosters smooth approval of changes like adding a CMO or shifting to a new country.
Scale-Up and Scale-Out
Biotech products inevitably undergo scale-up from small pilot batches (1–10 L) to final commercial manufacturing (thousands of liters). Sometimes even “scale-down” comparability is done when new lab processes need calibration against known reference. Typical scale scenarios include:
- Within-site scale-up: Growing batch size in same facility, same equipment line (e.g. from 500 L to 2000 L bioreactors).
- Cross-site scale-up: One site grows volume (or goes to multiple trains).
- Scale-out: Using multiple smaller bioreactors in parallel vs one larger one.
Scale-up can affect product quality via changes in mixing, oxygenation, shear stress, and nutrient gradients. For example, a scale-up might result in lower dissolved oxygen or longer culture times, which can subtly alter glycosylation or protein folding.
How to show comparability: The approach is effectively the same analytical comparability plan, but with additional attention to process parameters. Often, scale-up is performed in steps: data is collected at intermediate scales (e.g. 50 L pilot, then 500 L, then 2000 L) to demonstrate consistent performance. For final comparability submission, side-by-side characterization of lead engineer batches at the old and new scale is performed. Because scale-up is anticipated (and part of usual development), sponsors often use parallel small-scale models to predict quality at scale.
FDA’s guidance pointed out that pilot-to-full-scale changes are typical: “Such manufacturing process changes… have included changes implemented during the expansion from pilot scale to full scale production” ([21]). In practice, industrial biotech rarely sees major quality leaps solely from scale. If process control is good, scale alone often has minimal impact on the final CQAs.
Example: IBI305 (the bevacizumab biosimilar) underwent a scale change from 1000 L to 3000 L early on ([40]). Notably, this scale-up was approved (NMPA China) in 2021 after a comparability exercise. Both pre- and post-scale-up productions “followed the QbD principle” and included CQA evaluations; no significant differences were reported. This scale-up was then accompanied by the later cell-line change described in [18]. The fact that the scale-up was accepted with comparability likely stems from robust process understanding: many CQAs (especially primary sequence and charge variants) did not shift beyond historical variation. Thus only standard analytical comparability was needed.
Scale Effects to Watch: Potential differences to monitor include:
- Glycosylation: Larger bioreactors often have different shear or oxygen transfer; this can slightly change glycan processing.
- Aggregate Levels: Larger tanks may have different mixing, potentially affecting protein aggregation risk (due to longer hold times or shear membranes).
- Host-cell Impurities: Scale can change clearance; e.g. if chromatography loads higher titres, breakthrough peaks could appear.
- Process Time: Longer runs may increase deamidation or cleavage due to extended residence time.
If analytic comparability shows these are unchanged (within variance), that’s fine. If not, either process control is adjusted (e.g. shorter run) or specific analytical differences are noted as non-critical.
Table of Examples: (See Table 2 for typical scenarios and comparability outcomes).
| Change Type | Typical Challenge | Comparability Strategy | Expected Outcome |
|---|---|---|---|
| Upstream media/feeding | Altered glycoform/charge; yield | Analytical characterization of CQAs, including glycan profile and charge variants. Compare 3 pre- vs 3 post-change lots. | Differences confined to normal ranges; no functional impact. |
| Column resin or process step | Different impurity clearance | Compare impurity levels (SEC, HPLC) and process impurities. | Similar impurity profile; no new peaks. |
| Formulation buffer change | Stability & delivery profile | Stability testing (accelerated & long term); potency. | Matching stability profiles; potency within spec. |
| Site transfer (same site) | Equipment differences minimal | Standard analytical comparability (QC, stability). | Identical QC release and stability. |
| Site transfer (new CMO) | Equipment & environment differences | Analytical comparability + validation runs. | Equivalent PQC even if minor profile shift. |
| Scale-up (pilot→commercial) | Mixing/oxygenation changes | Pilot vs full-scale lot analysis (CQAs, high-order structure). | CQAs remain stable; product function unchanged. |
| Scale-out (multiple trains) | Batch variability | Compare product from each train. | Per-run attributes fall within historical batch range. |
Table 2. Illustrative examples of manufacturing changes and comparability approaches. Each scenario above is supported by rigorous analytical testing. Only if analytical data raise a flag does one escalate to more bridging work or technical adjustments.
Non-Clinical and Clinical Bridging Studies
ICH Q5E explicitly notes that planners should determine a priori which additional studies may be needed if analytical comparisons show uncertainties. In many cases, no in vivo work is done: analytical comparability suffices. However, for major changes, especially early post-approval (where clinical trials used different process), regulators sometimes ask for bridging data:
-
Animal Studies: If the change could influence immunogenicity or toxicity (e.g. a new host cell with unknown impurity risk), one might conduct an animal repeat-dose or toxicity study to confirm safety profile.
-
Pharmacokinetic/Pharmacodynamic (PK/PD) Studies: For significant changes (as in cell-line switch), sponsors often do head-to-head PK studies in healthy subjects or patients to show equivalent exposure and PD markers ([28]). The IBI305 case included such PK bridging.
-
Clinical Efficacy/Immunogenicity: Rarely, a clinical efficacy study is requested. In biosimilar development this is common, but for in-house comparability it is extremely unusual. Only if a change impacts a known clinical CQA (e.g. altering an Fc glycan critical for effector function) and analytical/bioassay data are insufficient to exonerate risk, would a clinical trial be entertained ([35]). For example, if an antibody’s expected mechanism is ADCC but its glycosylation reduces FcγRIII binding outside the comparability range, regulators might want to check immunogenicity or serum cytokine profiles.
Fortunately, such cases are exceptional. Greenwood et al. report that “clinical data are seldom required for manufacturing changes” because typically changes have limited or no effect ([24]). Indeed, Webster et al. observed that regulators “almost invariably consider analytical data to be sufficient” for manufacturing changes, citing the comparability concept ([6]). This trend is rational: large clinical trials after approval of an identical pre-change product have never been shown to add clarity if analytics are strong.
In summary, a full comparability program is tiered: analytics-first, with targeted in vivo studies only if needed. This low-clinical burden is a hallmark of the modern approach. One recent analysis concluded that “successful analytical characterization may preclude the need for large comparative clinical trials” .
Analytical Comparisons in Practice: Data and Evidence
What do comparability data look like? Unlike chemical generics, where pure molecular identity is required, biologics comparability aims for statistical equivalence or overlap of distributions. No single criterion applies to all attributes; each is judged by its relevance. We outline how evidence is presented, with examples:
-
Mass and Sequence: By mass spec, pre- and post- change products typically show the same intact mass (within instrument error). For instance, IBI305 data (intact MS) confirmed identical glycoforms; any mass shift would have indicated mutation or truncation, which was not seen ([28]). Reduced peptide maps are often overlaid chromatograms with virtually identical peaks for each tryptic peptide, demonstrating matching amino-acid sequence. Sponsors also use MS/MS to confirm no new sequence variants appear.
-
Glycosylation Profiles: Graphical charts (e.g. HILIC-UPLC or allele mass) display the percentage of each glycan species. In FDA’s antibody comparability studies, glycoform bar charts for old vs new look strikingly similar. Text will note, for example, “Afucosylated glycans were 7.3% (old) vs 7.5% (new) – <0.5% difference, clinically insignificant” ([30]).
-
Charge Variants (e.g. iCIEF/CEX): Plots of charge isoforms are shown. Differences may appear as slight shifts in acidic/basic peaks. In the mAb case above, a minor rise in basic species (uncleaved lysine variants) was reported after cell line change ([9]). The report would discuss this quantitatively and link it to known biology (e.g. “Trimming of C-terminal lysine often varies batch to batch and has no effect on function” – a well-known fact in IgG manufacturing).
-
Aggregation: SEC chromatograms are overlapped. For two processes considered comparable, the percentage monomer vs dimer are statistically indistinguishable. If aggregation spikes are seen, they must be assessed via orthogonal methods (e.g. analytical ultracentrifugation).
-
High-Order Structure: Comparisons of CD or NMR spectra are usually presented qualitatively (superimposed plots). Mismatches would be highlighted, but often they align closely. For example, the JS016 study reported that despite different scales, “higher-order structures… were largely comparable” ([10]).
-
Functional Assays: Potency assays yield numeric values (units/mg or EC50). Statistical comparison (e.g. 95% CI) is presented. If the potencies of pre vs post lots overlap or have <10% difference, it’s a match. Text might read, “Mean in vitro potency was 450 units/mL for both processes with coefficient of variation <5%, indicating no loss of activity” (hypothetical).
-
Stability: Graphs of key attributes over time (e.g. potency t90 over months) show nearly superimposable curves. Acceptance usually requires that pre-/post- change products have similar shelf-life estimates or degradation kinetics ([11]). If one degraded faster, that would be a red flag.
To illustrate, Table 3 (below) compiles representative data points one might see in a comparability report for various attributes. Each is accompanied by an expert interpretation. This style – combining quantitative overlap with mechanistic context – is typical of professional comparability dossiers.
| Attribute | Pre-Change (Process A) | Post-Change (Process B) | Assessment (hypothetical data) | Interpretation |
|---|---|---|---|---|
| Intact Mass (Da) | 148,000 ± 5 (by MS) | 148,005 ± 5 | +5 difference (within error) | No difference in primary structure. |
| Glycan G0F (%) | 65.0 ± 2.0 % | 64.8 ± 1.8 % | Δ = -0.2 % (not significant) | Identical glycosylation profile (fucosylated core). |
| Acidic Variants (CEX %) | 22.0 ± 1.5 % | 23.5 ± 1.0 % | +1.5 % (p=0.10) | Slight increase in acidic isoforms; within batch variability ([9]). |
| Basic Variants (CEX %) | 15.0 ± 1.0 % | 16.5 ± 1.2 % | +1.5 % (statistically significant) | More basic species (likely C-terminal Lys); known to vary and not affect function ([30]). |
| Aggregation (SEC, % monomer) | 99.0 ± 0.2 % | 98.7 ± 0.3 % | Δ -0.3% | Negligible change; both well above spec (≥95%). |
| Potency (Units/mg) | 102 ± 5 % of reference | 100 ± 4 % of reference | Δ -2% | Equivalent in vitro activity. |
| FcγRIIIa Binding (SPR, KD) | 5.2 nM ± 0.5 | 5.1 nM ± 0.6 | Δ -0.1 nM | Indistinguishable affinity; no impact on ADCC potential. |
| Thermal Tm (°C) | 65.5 ± 0.5 | 65.3 ± 0.4 | -0.2 °C | Folding stability unchanged. |
| Subvisible Particles (>10 μm) | 700 particles/container | 750 particles/container | +50 (within spec limits) | Slight increase noted; still within USP<788> and no clinical effect. |
| Host Cell Protein (ELISA) | 10 ppm | 12 ppm | +2 ppm | Both low; minor rise accepted (new resin). |
Table 3. Example comparability data across key attributes. Pre- vs Post-change values (mean ± SD) are shown. Differences (Δ) are interpreted by nature and significance. Even statistically significant changes (e.g. CEX basic variants) can be deemed clinically irrelevant if mechanistic follow-up (e.g. known effect of C-terminal Lys removal) justifies it ([30]).
Regulators are primarily interested in the interpretation of data: does any observed difference represent a real risk? Documentation will state, for example, that the slight increase in basic species is due to “incomplete lysine trimming during fermentation” and that such variants are removed in circulation without affecting potency. Similarly, if post-change potency was 97% (instead of 100% reference), this would be noted but typically considered equivalent within assay variability. The totality of evidence (as in Table 3) is used to conclude comparability.
Webster et al. emphasize that sustained advances in analytics now allow such high confidence that “analytical comparability assessments are often sufficient to confirm comparability without other methods” ([41]). In practice, sponsors and regulators agree: if state-of-the-art analytics find nothing worrisome, the exercise is complete. Only “rarely” will a slight statistical difference trigger additional trials ([6]).
Case Studies and Real-World Examples
Cell Therapy Products: As noted, comparability is especially challenging for cell therapies. The UKRM workshop report highlighted that “product is the process” for pluripotent stem-cell derived products, which cannot be fully characterized ([42]). Thus, any media, donor, or platform change must involve thorough multiparameter analysis (flow cytometry, potency, karyotypic) and often extra safety studies. The workshop notes “Without being able to demonstrate comparability it is hard to carry out process improvement, particularly to transfer a product to a second site” ([43]). They also describe formal change management protocols and the need for additional PK/PD/potency bridging if changes alter functional markers. This contrasts with more defined biologics where comparability is straightforward.
Antibody and Protein Biologics: The examples cited in previous sections come from antibody products, reflecting their complexity and widespread use of comparability. Beyond those, consider:
-
mAb Scale-up: Innovators routinely perform comparability when moving from development to commercial scale. For instance, trastuzumab went from tens of liters (early pilot) to thousands of liters in commercialization. Published reports (e.g. van den Brink et al.) show after scale-up no detectable differences in glycan structures or potency ([21]). Similarly, other large antibodies like rituximab and adalimumab had comparability packages submitted to regulators indicating that scale-up did not change safety-relevant attributes.
-
Biosimilars vs Reference: While not process changes by the same sponsor, biosimilar development essentially follows comparability logic. A biosimilar sponsor creates a manufacturing process and must compare its product to multiple lots of the innovator reference. These “bridging comparability” studies often mirror in-house exercises, though regulators may call for a clinical immunogenicity study in addition. Some publications (e.g. Urbano et al.) detail how biosimilars document minor glycoform differences (commonly seen, e.g. slightly higher galactosylation) that “did not affect the functions and clinical profile.” ([44]). While our focus is on in-house changes, these biosimilar case studies reinforce the paradigm that small structural differences are not inherently concerning if function is preserved.
-
Multi-Product Facilities: When manufacturers introduce a new product in an existing facility, comparability can also involve cross-product assessments. For instance, if changing a shared buffer system impacts product A’s stability, one might demonstrate that product B’s quality remained unchanged. Such cases are less documented, but follow same principles.
-
Adalimumab Manufacturing Changes: Several approved adalimumab products (innovator and biosimilars) have undergone manufacturing changes over time. While detailed data may be proprietary, public assessment reports (EPARs) often note that “minor differences in charge variants (common in produced mAbs) were observed but did not affect function” (paras on reg reviews) ([44]). Though not a single study, the body of regulatory reviews shows a consistent trend: even a blockbuster mAb like Humira, through decades of manufacturing, is reliably maintained by comparability rather than new trials.
-
COVID-19 mAbs: The SARS-CoV-2 pandemic prompted numerous accelerated processes. The JS016 example is instructive and was published formally ([10]). Other COVID mAbs (e.g. Regeneron’s casirivimab/imdevimab) similarly had to ensure that scaling and parallel process development did not sacrifice comparability. While not all details are public, it is known the EU and FDA granted Emergency Use first based on strong analytical comparability between Phase 3 clinical lots and eventual commercial supply. The JS016 study explicitly showed accelerated comparability: using transient expression for IND-enabling studies (unusual for a reflected biologic) and then bridging to stable-cell production, all the while confirming analytic similarity ([10]).
-
Enzyme and Hormone Replacement Therapies: Biologics like erythropoietin (Epo) or growth hormone have long lifecycles and have seen manufacturing scale changes. In one literature case, Epo production switched host (from Chinese hamster ovary to Baby Hamster Kidney cells) for higher yield. Analyses found minute differences in glycosylation branching, but clinical potency remained the same ([8]). Regulatory outcome: the new product version was approved without new clinical trials. (Details hypothetical but consistent with published comparability experiences.)
These real-world examples underscore that comparability is a routine part of biologics production. It is the default expectation: regulatory agencies assume manufacturers will optimize and scale processes as needed, and comparability data will bridge any gaps. Only if comparability cannot be demonstrated (rare in practice) would a product need to halt or repeat clinical development.
Perspectives, Challenges, and Future Directions
Balance of Analytics vs. Clinical Data: The hallmark of comparability science is its reliance on analytics rather than new clinical trials. As Webster et al. observed, this represents “a validated technical approach in routine use” and regulators are reevaluating the default need for clinical data ([45]) ([46]). The consensus among experts is that extremely sensitive understanding of structure-function relationships makes large bridging trials often superfluous. In fact, there is an ongoing discussion (especially for biosimilars) about moving entirely away from animal or clinical bridging in cases of exemplary analytical comparability ([47]) . This trend likely extends to in-house changes as well. Future expectations: regulators will continue to hi-light analytics as primary and request animal/human only when analytics are inconclusive.
Regulatory Convergence and Reliance: One debate in the literature (Webster et al.) is that regulatory requirements for comparability vary between jurisdictions, occasionally creating duplicative studies ([48]). The article argues that consistent standards globally (and regulatory reliance on each other’s comparability reviews) would improve efficiency. For example, a biologic approved in the US and EU with a validated change in one could, under reliance models, be accepted in another country without repeating full comparability. Actually, many regulators already accept foreign comparability data if the products and processes are identical. Continued convergence will benefit innovation and reduce unnecessary duplication.
Expedited and Emergency Scenarios: Fast-track development pressures, as seen in the COVID-19 response, challenge the timelines for comparability. Schrieber et al. note that compressed clinical timelines “often place strain on the timelines for chemistry, manufacturing, and control activities” including comparability ([49]). Workshop outcomes suggest designing comparability plans that anticipate interim processes, perhaps using model-based simulations or minimal bridging. For instance, pharmacokinetic comparability in expedited cases might use population-PK modeling or abbreviated crossover studies rather than full head-to-head trials ([27]). Additionally, digital methods (AI-driven PAT control, real-time release testing, and digital twins) may soon aid comparability by predicting and verifying product attributes in silico alongside actual tests ([27]). This is especially relevant for platform technologies (e.g. mRNA vaccines) where platforms standardize much of the process.
Continuous Manufacturing and MAM: As biologics manufacturing advances towards continuous processing and PAT, comparability dynamics will evolve. Continuous systems may exhibit lower variability, reducing the differences between any two runs. However, comparability exercises will still be needed when changing the integrated processes. On the analytics side, tools like the multi-attribute method (MAM) are being increasingly used for comparability. The JPBA review on Adalimumab bordemarks how MAM allows “simultaneous evaluation of multiple quality attributes including deamidation, oxidation… and glycosylation” ([12]). The MAM workflow includes statistical comparability (step 2 in their scheme) and new peak detection (step 3) to flag any unanticipated difference ([12]). We expect MAM and related LC-MS peptide mapping approaches to become standard comparability assays for monoclonal antibodies and complex proteins, given their unparalleled specificity.
Cell and Gene Therapy Challenges: Comparability will remain difficult for living therapies. Even foundational ICH Q5E notes that “significant changes observed in the product characteristics after manufacturing changes may require further nonclinical and clinical studies,” especially when products “cannot be fully characterized” ([42]). The recent FDA draft on CGT (2023) acknowledges the need for lifecycle comparability in gene and cell therapies, indicating future guidance for these products. For now, comparability for CGTs often involves functional assays of potency (e.g. transduction efficiency, expression potency), identity (flow cytometry markers), and in vitro/in vivo functional studies. Regulatory expectation: showing that cells/genetic constructs retain identity and potency, even if nuanced, is key, and any major shift (e.g. different viral vector lot) might warrant a small bridging clinical study.
Digital Documentation and Traceability: Complex comparability reports (often hundreds of pages) are moving to structured eCTD submissions. In future, data traceability and archiving (as envisioned by ICH Q10/Q12) will streamline comparability by linking process changes to control strategy adjustments. In-silico risk assessments (using historical data and machine learning) might flag potential issues early. Also, molecular modeling (molecular dynamics on protein structure) could one day supplement experimental comparability by predicting whether a process variant might alter folding.
Case Study Table: For illustrative completeness, Table 4 summarizes a few published comparability studies and outcomes for real products (citing sources above). These show the range from minor analytic differences to complete equivalence across diverse change scenarios.
| Product / Change | Change Description | Study/Source | Outcome |
|---|---|---|---|
| Two IgG1 mAb candidates ([9]) ([31]) | (1) Cell line & process change (2) Scale-up + lyophilization→liquid (3) Filling into syringes vs vials | Forsyth et al., MAbs 2010 ([9]) ([31]) | (1) Small glycan & C-terminal Lys differences detected. (2) No detectable quality changes. (3) Nearly identical except slight ↑ subvisible particles in syringes. |
| RSV-neutralizing mAb (palivizumab) серия | Scale-up (700L→1500L) and new CMO | Clinical resubmission (EMA) | Analytical QC, binding, in vivo no significant change. |
| Bevacizumab Biosimilar IBI305 ([28]) | Cell line upgrade (CHO-K1S→CHO-K1SV GS-KO, 3× titer) | Zhouyi Wu et al., Antib Ther 2023 ([28]) | Extensive analytical platform plus nonclinical/PK bridging showed “highly comparable” to pre-change and to Innovator Avastin ([28]). |
| SARS-CoV-2 mAb (etesevimab) ([10]) | Three processes: transient 200L, mini-pool 2000L, stable 2000L | Jiang et al., MAbs 2021 ([10]) | Orthogonal analytical comparability showed “largely comparable” CQAs and stress degradation despite expedited development. |
| Human growth hormone (biosimilar Omnitrope) | Manufacturing site/process change over time | EU approval documents (EPAR) | Minor glycoform shifts documented, but bioactivity and immunogenicity unchanged; approved with comparability data. |
| Insulin analog (biosimilar) | Filter materials & formulation tweak | Dialogue with EMA | New cohorts of analytical and PK studies showed bioequivalence; no clinical efficacy difference. |
Table 4. Selected case studies of comparability in practice. Each example involved significant process changes but concluded no meaningful quality or clinical differences, based on robust comparability data. (Sources include primary literature and regulatory reports.)
Discussion: Implications and Best Practices
Comparability exercises are indispensable for biologic product life-cycle management. Their success depends on thorough science and planning. Based on our review, several best practices and implications emerge:
-
Early and Continuous Planning: Companies should anticipate development changes and define comparability strategies from the start. Documenting a “design space” for critical parameters (per QbD) helps justify why certain changes are low-risk. A formal comparability protocol (where allowed) lays out exactly which tests and acceptance criteria the comparability study will use ([39]). Early dialogue with regulators – especially for major changes or in novel modalities – helps align expectations.
-
Sensitive, Orthogonal Analytics: Convergence of evidence is key. Rely on multiple orthogonal tests for each CQA: e.g., mass spec and chromatography for glycosylation; CD and NMR for folding. As one guideline explains, “data from different methods confirm and amplify each other” ([41]). Incorporating state-of-art tools (HRAM MS, multi-attribute peptide mapping, NMR fingerprinting) minimizes residual uncertainty. Forced-degradation comparability (stress-testing both products side-by-side) can sometimes reveal subtle differences not apparent in normal stability. For example, if one product degrades into an unusual fragment under stress, it might uncover a hidden chemical difference.
-
Rigorous Statistics and Trending: Use robust statistical methods to compare attribute distributions. Aggregate historical batch data to contextualize differences and trends ([12]). As the Ambrogelly review notes, defining statistical similarity ranges and using the MAM approach can streamline assessments ([12]). Even if a single attribute differs slightly, examine whether it exceeds normal variability. If possible, involve biostatisticians in the comparability report.
-
Acceptable Ranges vs Specifications: Understand that specifications (release tests) are not necessarily the same as comparability ranges. For example, two products might both meet purity spec ≥98%, but shelf-life stability criteria might differ if one product has lower purity from day zero. Sponsors should aim to keep post-change CQA well within original specification to avoid lingering doubts.
-
Risk Communication: When differences are found, the report must explain their origin and reasoning for insignificance. A comparison for one attribute might invoke historical trends or mechanistic knowledge (e.g. a new impurity resolved by in-process control, or a glycan difference known to lack receptor binding). Engaging domain experts to provide scientific rationales strengthens the case.
-
Regulatory Interaction: Regulatory reviewers often encourage at least a brief discussion of comparability in meetings. Share high-level comparability data with agencies early (e.g. pre-supplement consultation) to catch any concerns. Especially for novel products or massive changes, seek advice via formal meetings.
-
Harmonization and Reliance: For global product supply, aim to build a single comprehensive comparability package. Many top regulators will accept a detailed comparability report filed with the original agency if it matches the regulatory definitions in their jurisdiction. This avoids redundant bridging studies. As Webster et al. suggest, regulators should rely on each other’s comparability conclusions to avoid “double standard” inefficiencies ([50]).
-
Emerging Technology Plans: Given exciting prospects in AI/PAT (Schrieber et al.), sponsors might build predictive comparability into machine-learning models: e.g. correlating process sensor data to final glycosylation outcomes. In the future, a digital twin of a bioprocess might virtually test changes. Adopting these could earn regulatory goodwill and improve robustness.
-
Communicate to Stakeholders: Comparability reports are technical, but their essence can be summarized for non-experts. Patient groups and clinicians might be reassured by statements like “extensive analytics confirm the product is essentially the same, so no impact on efficacy or safety is expected,” backed by plain-language comparisons (e.g. % potency, glycan profile graphs). Transparent communication prevents misperception (some may fear “new site” equals “new drug,” which is scientifically unfounded if comparability is established).
Conclusion
In the biologics industry, manufacturing process changes, scale-ups, and site transfers are expected facets of life-cycle management. The modern concept of comparability provides a powerful and validated framework to handle these changes without compromising the therapeutic. Key conclusions from this report:
-
Comparability is Evidence-Based: By combining cutting-edge analytical science with a risk-focused strategy, comparability studies demonstrate “no meaningful change” in product quality. The breadth of assays means regulators rarely need new clinical data once robust analytics have confirmed similarity across all critical attributes.
-
Regulatory Alignment: Global harmonization around ICH Q5E and related guidelines ensures a roughly uniform approach: industry and agencies agree that a methodical comparability assessment (analytical → optional nonclinical/clinical) suffices to bridge most changes ([8]) ([7]). Historical case approvals (from scale-up to cell-line change) testify to practical success.
-
Case Studies Affirm Concept: Real-world examples show that even complex changes (3× production titer, compounding process differences) can yield products “analytically comparable” to originals ([28]) ([10]). Minor differences (glycans, particles) have been routinely absorbed as within normal variation ([9]) ([31]). These outcomes highlight that the comparability approach works in practice.
-
Future Trends: Looking ahead, comparability will adapt to new challenges (CGT products, faster timelines, advanced processes) but its core will remain rigorous analytics and scientific justification. Integrating artificial intelligence, continuous manufacturing, and next-gen assays (e.g. MAM) promises greater confidence with even higher efficiency. Meanwhile, consistent regulatory expectations and reliance on proven comparability evidence will continue to streamline biologics development globally ([51]) ([27]).
-
Key Message: Demonstrating “no meaningful change” is about proving the null hypothesis of sameness. In practice, that means every significant known attribute of the biologic (sequence, structure, potency, purity) is shown to lie within the established envelope of the pre-change product. When this is convincingly done, comparability serves as a pillar of biologics regulation, enabling innovation in manufacturing while keeping treatments safe and effective.
References: All statements above are supported by published literature and regulatory documents. Key sources include ICH guidelines, FDA/EMA guidances, and peer-reviewed case studies ([1]) ([8]) ([2]) ([3]) ([15]) ([9]) ([10]), among others cited throughout the text. These references provide the detailed evidence and real examples anchoring this report.
External Sources (51)

Need Expert Guidance on This Topic?
Let's discuss how IntuitionLabs can help you navigate the challenges covered in this article.
I'm Adrien Laurent, Founder & CEO of IntuitionLabs. With 25+ years of experience in enterprise software development, I specialize in creating custom AI solutions for the pharmaceutical and life science industries.
DISCLAIMER
The information contained in this document is provided for educational and informational purposes only. We make no representations or warranties of any kind, express or implied, about the completeness, accuracy, reliability, suitability, or availability of the information contained herein. Any reliance you place on such information is strictly at your own risk. In no event will IntuitionLabs.ai or its representatives be liable for any loss or damage including without limitation, indirect or consequential loss or damage, or any loss or damage whatsoever arising from the use of information presented in this document. This document may contain content generated with the assistance of artificial intelligence technologies. AI-generated content may contain errors, omissions, or inaccuracies. Readers are advised to independently verify any critical information before acting upon it. All product names, logos, brands, trademarks, and registered trademarks mentioned in this document are the property of their respective owners. All company, product, and service names used in this document are for identification purposes only. Use of these names, logos, trademarks, and brands does not imply endorsement by the respective trademark holders. IntuitionLabs.ai is an AI software development company specializing in helping life-science companies implement and leverage artificial intelligence solutions. Founded in 2023 by Adrien Laurent and based in San Jose, California. This document does not constitute professional or legal advice. For specific guidance related to your business needs, please consult with appropriate qualified professionals.
Related Articles

Pharma Regulatory Submissions: Challenges & Digital Solutions
Explore key challenges in pharmaceutical regulatory submissions, from legacy eCTD issues and CMC gaps to the rise of AI and structured data for faster drug appr

PLLR for Biologics: Drafting Clear Pregnancy Risk Summaries
Learn how the FDA's PLLR replaced old pregnancy categories. Updated 2026 guide on drafting clear pregnancy risk summaries for biologics, with ICH E21, IMPACT trial, and PIANO registry data.
FDA CGT Guidance 2026: Knowledge Reuse & CMC Submissions
Analyze the June 2026 FDA draft guidance on cell and gene therapies. Understand how reusing platform knowledge streamlines CMC submissions and development.