
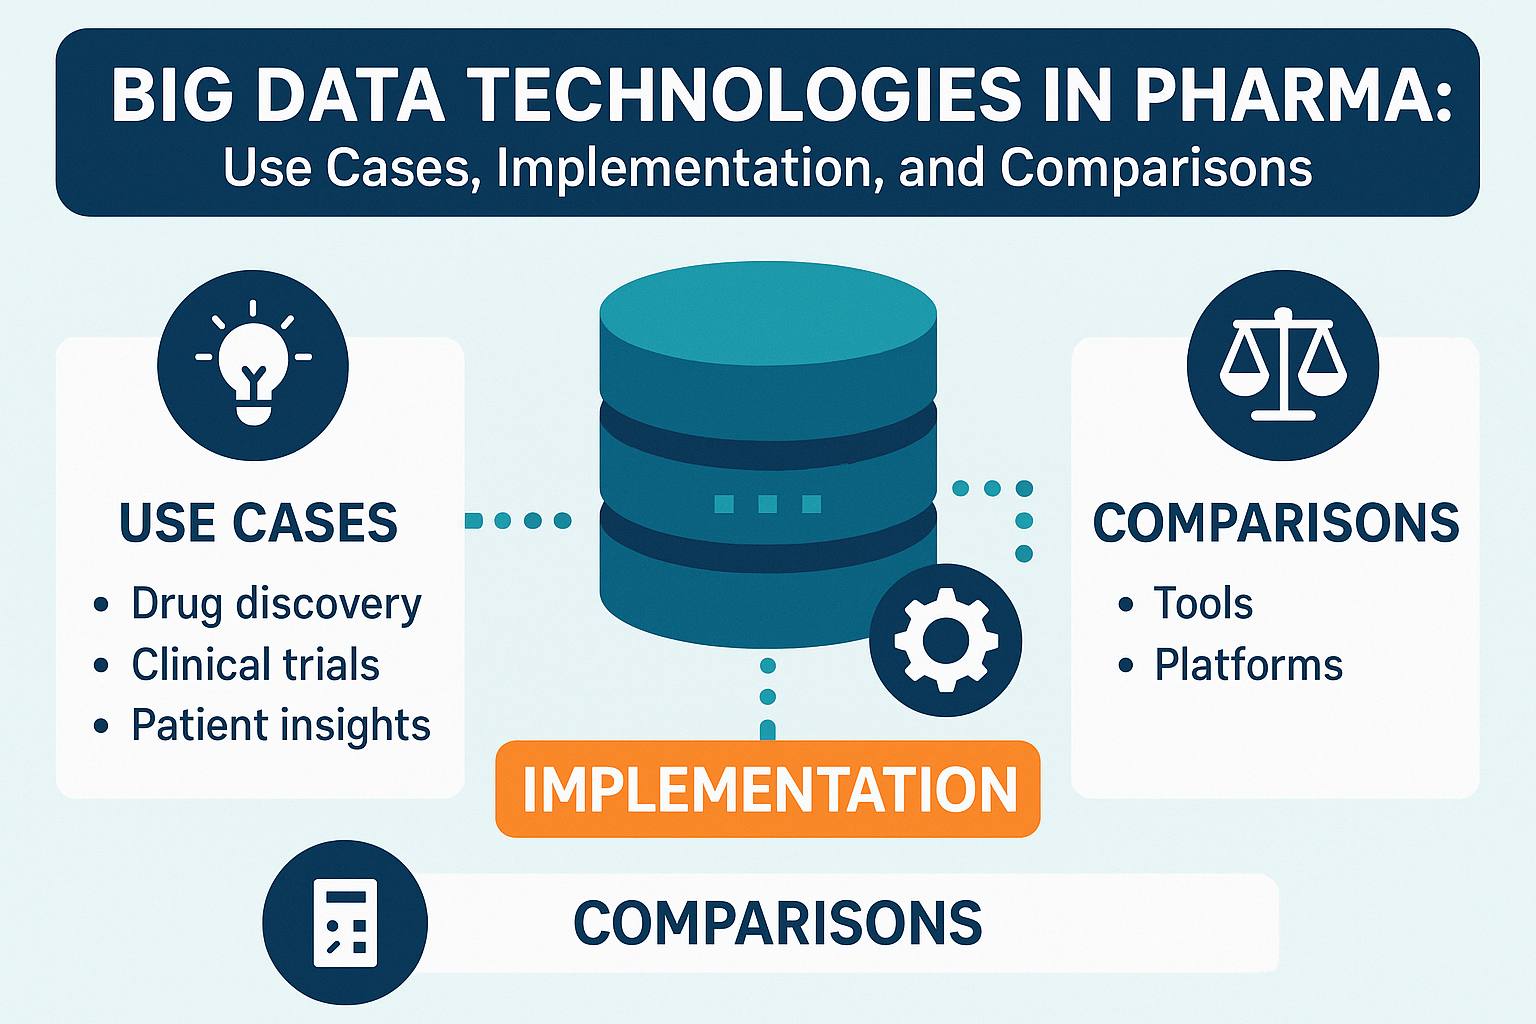
Big Data Technologies in Pharma: Use Cases, Implementation, and Comparisons
[Revised May 7, 2026]
Big Data Technologies in Pharma: Use Cases, Implementation, and Comparisons
The pharmaceutical industry generates vast and diverse datasets – from genomic sequences and clinical trial results to regulatory documents, safety reports, and supply chain logs. Data engineers in pharma must choose appropriate big data technologies to store, process, and analyze this information at scale. This report explores key technologies – Hadoop (HDFS, Hive, HBase), Apache Spark 4.x, Cassandra, MongoDB, Snowflake, AWS Redshift, Azure Synapse Analytics, Azure Data Lake, Google BigQuery, Neo4j, TigerGraph, Veeva Vault, Informatica, DNAnexus, and Illumina BaseSpace – and how they are applied across major use cases. Each section focuses on a specific use case (e.g., genomics, clinical trials, regulatory management, pharmacovigilance, manufacturing and supply chain, sales and marketing analytics), detailing the technologies commonly used, their technical implementation, distinguishing features, and concrete examples. Comparisons are provided in tables for attributes like scalability, cost, performance, integration ease, compliance, and adoption, to help data engineers evaluate solutions.
Industry Context (2025-2026): The global commercial pharmaceutical analytics market was valued at USD 5.16 billion in 2024 and is projected to reach USD 18.49 billion by 2031. More than 85% of biopharma executives intend to increase investment in data, AI, and digital tools in 2025-2026, aiming to reduce drug development costs and timelines. The pharmaceutical cloud computing market is expected to reach $21.5 billion by 2025, with companies like AstraZeneca having migrated over 85% of their computational workloads to the cloud. As of Q2 2026, Veeva AI Agents (announced October 2025, with commercial-application availability beginning December 2025) are now in production deployment across multiple top-20 biopharma, with the Safety & Quality wave generally available in April 2026 and the Clinical Operations, Regulatory, and Medical wave on track for August 2026. Agentic AI – grounded in life-sciences-specific data via Model Context Protocol (MCP) servers from Snowflake, Databricks, and Informatica – has become the dominant pattern for new pharma data platform initiatives in 2026.
Genomics Data Analysis and Bioinformatics Pipelines
Genomic and multi-omics data analysis in pharma involves processing massive sequencing outputs (DNA/RNA reads, variant files) and integrating results for drug discovery or precision medicine. Key challenges include scalability (handling petabytes of sequencing data), processing speed (aligning reads or calling variants on thousands of genomes), flexible analysis pipelines, and compliance (handling potentially identifiable genetic data securely). Data engineers leverage a mix of on-premises big data frameworks and specialized cloud platforms:
-
Hadoop Distributed File System (HDFS) for large-scale storage: Genomic files (FASTQ, BAM, VCF, etc.) are often enormous. HDFS provides distributed storage across clusters, making it feasible to store and access terabytes of sequence data in parallel. For example, biomedical research projects have utilized Hadoop to manage large volumes of NGS data and clinical results ([1]). Apache Hive (SQL-on-Hadoop) can be used to structure genomic variant data in tables for query, and HBase (Hadoop's NoSQL store) can enable fast random access to genomic data (e.g. keying by gene or variant ID) in big genome annotation datasets. While Hadoop's batch-oriented MapReduce model was historically used (e.g. early tools like Crossbow for sequence alignment), modern pipelines have shifted to more efficient in-memory processing.
-
Apache Spark 4.x for distributed computing: Spark is a general-purpose cluster computing engine ideal for iterative algorithms and large-scale analytics. Apache Spark 4.0, released in 2025 with contributions from over 400 developers across organizations like Databricks, Apple, and NVIDIA, brings significant advancements including SQL scripting with session variables, VARIANT data type support, enhanced PySpark with native plotting API, and Python Data Source API for custom data sources ([2]). In genomics, Spark accelerates variant analysis pipelines by parallelizing tasks across cores or nodes. Spark is embedded in tools like GATK4 from the Broad Institute, where "Spark" versions of variant callers (e.g. HaplotypeCallerSpark) allow processing a genome across a cluster, drastically reducing runtime. Importantly, Spark can run on Hadoop clusters (using YARN) or in cloud-managed environments (Databricks, Amazon EMR, Google Dataproc). ADAM and Hail are examples of genomics frameworks built on Spark, enabling scalable analysis of genomic variants and genotypes. The in-memory computing of Spark yields performance gains over Hadoop MapReduce. Spark 4.0's enhanced Spark Connect architecture enables lightweight clients (1.5 MB vs 355 MB for full PySpark) to connect remotely to Spark clusters, and the new transformWithState operator improves arbitrary stateful processing for streaming workloads.
-
Cloud Data Warehouses (Snowflake, BigQuery, Redshift) and Databricks for multi-omics integration and analysis: While Hadoop/Spark handle raw data processing, cloud data warehouse and lakehouse platforms excel at aggregating results and enabling interactive analytics on genomic data combined with other data (clinical phenotypes, compound libraries, etc.). Snowflake has emerged as a powerful option for bioinformatics data warehousing with approximately $66.5 billion market cap on roughly $3.84 billion in trailing twelve-month revenue as of 2025. Snowflake's multi-cloud architecture and near-zero maintenance appeal to pharma R&D – it runs on AWS, Azure, or GCP with a unified experience, avoiding vendor lock-in. In 2025, Snowflake spent $250 million to acquire PostgreSQL vendor Crunchy Data to strengthen AI capabilities, and is developing an open standard for semantic definitions to support agentic AI analytics. Databricks reached a $100 billion valuation in mid-2025 with $3.7 billion annualized revenue, growing at nearly double Snowflake's rate (50% vs 26%) and spent $1 billion on Neon (PostgreSQL) to enhance GenAI solutions. Both platforms now offer support for Model Context Protocol (MCP) servers for AI processes. Meanwhile, Google BigQuery is leveraged for large genomic datasets with native support for public genomic data like TCGA and integrates with Google's AI/ML tools (TensorFlow, Vertex AI). Amazon Redshift is often chosen for AWS-centric infrastructure, with RA3 nodes offering managed storage. In practice, pharma companies stage genomic data files in cloud data lakes (S3 or Azure Data Lake) and use external tables or services like Redshift Spectrum or Synapse to query them.
-
NoSQL and graph databases in genomics: Though less common than in other use cases, certain genomic applications use NoSQL stores. For example, MongoDB can store experiment metadata or gene annotation JSON documents. If a project requires rapid queries by gene or variant ID, a key-value store like HBase or DynamoDB could be employed. Graph databases like Neo4j appear in drug discovery knowledge graphs (linking genes, diseases, compounds), which we discuss later, but they can also capture gene interaction networks or pathway data relevant in genomics. These allow researchers to traverse relationships (e.g., find connections between a gene variant and known drug targets) which is difficult with relational schemas.
-
Specialized Genomics Platforms: Many pharma companies use domain-specific platforms such as DNAnexus or Illumina BaseSpace for genomic data. DNAnexus is a cloud-based bioinformatics platform where users can run end-to-end NGS pipelines, perform variant analysis, and manage datasets collaboratively. It is designed to handle population-scale genomics – as of 2025, DNAnexus supports more than 60,000 registered users across 48 countries and actively manages over 125 petabytes of complex clinical, genomic, proteomic, and other multi-omic datasets ([3]). In August 2025, DNAnexus enhanced its leadership team with Pieter De Leenheer as CTO and launched the GenAI-powered Omics Data Assistant for accelerating discovery. It provides a secure, compliant environment (HIPAA, CLIA, GDPR compliant) with workflow languages (WDL, Nextflow) and versioned apps. DNAnexus has also integrated NVIDIA NIM and CUDA-X microservices to accelerate drug discovery through GPU-powered analytics. Illumina BaseSpace Sequence Hub is another such platform: it connects directly to Illumina sequencing instruments to stream data to the cloud, then offers storage, analysis apps (including Illumina's DRAGEN pipelines), and sharing capabilities. In May 2025, Illumina launched DRAGEN v4.4, introducing powerful innovations for genomic and multiomic analysis including new oncology applications for Heme WGS, Solid WGS tumor-normal, and streamlined Minimal Residual Disease (MRD) pipelines, along with a 30% improvement in germline structural variant calling accuracy ([4]). The platform now supports over 90 point-and-click genomic analysis apps. BaseSpace is engineered for regulatory compliance (ISO 27001, HIPAA) and high performance, with DRAGEN available via on-premises server, in the cloud, or directly onboard the NovaSeq X Series, NextSeq 1000/2000, and MiSeq i100 Series instruments ([5]). Illumina's 2025 5-base solution enables simultaneous detection of genomic variants and DNA methylation from a single sample, marking a major advancement in scalable multiomic analysis.
Example: A pharmaceutical research team might sequence thousands of genomes in a drug discovery project. They could use Illumina sequencers streaming data to BaseSpace for initial alignment and variant calling (leveraging Illumina's optimized pipelines). The resulting variant data could be exported to a Snowflake data warehouse where it's combined with clinical data to identify genotype-phenotype correlations. Data engineers might use Spark on a Databricks cluster to perform a heavy compute task – e.g., joint variant calling or variant quality recalibration across all samples – reading from and writing to an Azure Data Lake. Once processed, summary tables (like variant frequencies, gene associations) land in Snowflake for analysts to query. If they need to cross-reference public knowledge (gene networks, literature), they might load data into a Neo4j knowledge graph that connects those variants to known pathways and publications, enabling complex queries (e.g., find any known drug targets in pathways affected by our top variant hits).
Comparison: Technologies for Genomics Data
| Technology | Scalability | Performance | Integration Ease | Compliance Features | Adoption in Genomics |
|---|---|---|---|---|---|
| Hadoop (HDFS/Hive/HBase) | High horizontal scalability (add nodes to store PBs). Suitable for on-prem or IaaS clusters. | Good for batch throughput; MapReduce slower for iterative tasks (Spark now preferred for speed). | Requires significant setup and expertise (Java, cluster management). Hive/HBase integrate with Hadoop ecosystem, but not plug-and-play. | Secure setup possible (Kerberos, Ranger) but heavy to validate. Full control of data on-prem can aid compliance if managed properly. | Historically high for large genomics (e.g., 1000 Genomes used HDFS). Usage now declining in favor of cloud services. |
| Apache Spark | Scales across cluster nodes; in-memory processing limits per-node memory needs but can spill to disk. | Excellent for large-scale data transforms and ML (much faster than MapReduce for many tasks). Utilizes memory for speed. | Flexible integration: runs on Hadoop, Mesos, Kubernetes, or cloud-managed platforms. Connectors for many data sources (HDFS, S3, JDBC, etc.). | No built-in compliance – depends on environment (can run on secure clusters or in HIPAA-compliant cloud). Fine-grained audit needs custom tooling. | Strong adoption in genomics analytics (e.g., GATK4 uses Spark). Widely used via Databricks, GCP Dataproc, AWS EMR for bioinformatics. |
| Snowflake | Near-infinite auto-scalability (compute clusters can be resized on-demand; multi-cluster warehouses handle concurrency). | High performance columnar engine; automatic tuning and result caching. Excels at complex SQL on large data. | Very easy integration: standard SQL, many BI tool connectors. Supports stages to load data from S3/Azure/GCS. Cross-cloud data sharing is unique. | Strong compliance: HIPAA-, GDPR-ready; can encrypt data, fine-grained access control. Can be validated for GxP use. Secure data sharing without copies. | Rapidly growing in pharma R&D. Used for multi-omics data warehouses (e.g., disease variant analysis and drug discovery use cases). |
| Google BigQuery | Massive serverless scalability (Google's infrastructure handles sharding/parallelism automatically). | Excellent at scanning huge datasets quickly; fully managed. May have slightly higher latency on very small queries due to overhead. | Easy via SQL. Integrates natively with Google Cloud Storage, and has public genomic datasets (TCGA, etc.) accessible. Standard ODBC/JDBC for tools. | Google Cloud is HIPAA-compliant; BigQuery has fine ACL controls. Data is encrypted at rest and in transit by default. | Used in large-scale genomics and health analytics (e.g., storing population genomics with built-in ML tools). Often chosen for AI integration (TensorFlow on data). |
| AWS Redshift | High scalability up to petabytes. New RA3 instances separate storage on S3 for virtually unlimited storage. Concurrency scaling adds clusters on demand. | Fast for analytical queries if tuned (distribution keys, sort keys). Spectrum enables querying S3 data directly. Slightly older architecture than Snowflake/BigQuery. | Good with AWS ecosystem: easy to ingest from S3, integrate with AWS Glue, QuickSight, SageMaker for ML. Standard SQL interface. | AWS offers HIPAA-eligible services; Redshift data encryption, VPC isolation available. Audit logging to CloudTrail. Often part of validated AWS environments. | Widely adopted by pharma on AWS, e.g., for aggregating clinical and genomic data in a warehouse. Some migrating to Snowflake for ease-of-use. |
| DNAnexus | Highly scalable cloud platform (built on AWS/GCP). Manages PB-scale data and complex pipelines with horizontal scaling in cloud. | Optimized for NGS pipelines – can spin up large compute clusters for heavy workloads. High throughput for file I/O to cloud storage. | Integration via APIs/SDKs and workflow languages (WDL, Nextflow). Can import from cloud buckets or instrument outputs. Less standard than SQL interfaces. | Designed for compliance: meets strict standards (audit trails, access control, HIPAA, GDPR) ([6]). Many pharma use it in validated environments for clinical genomics. | Moderate adoption: used by genomics initiatives (UK Biobank, precision medicine projects) and pharma needing turnkey NGS analysis. Growing as data volumes grow. |
| Illumina BaseSpace | Scales to many sequencers and large data volumes by leveraging Illumina's cloud. Storage scales with Illumina Cloud infrastructure. | High for Illumina's use cases (fast secondary analysis with DRAGEN hardware-accelerated pipelines either on-site or cloud). Not a general compute platform beyond provided apps. | Seamless for Illumina instruments. Limited integration outside Illumina ecosystem (APIs exist but primarily used with Illumina's own pipeline and analysis apps). | Built-in compliance: ISO 27001, HIPAA, GDPR compliance features. Data encrypted at rest and in transit, regional data centers for compliance needs. | High adoption in sequencing labs (many clinical genomics labs and biotech use it for ease-of-use). In pharma, often used in early research or clinical sequencing with Illumina. |
Why these distinctions matter: For genomics, a data engineer might use Spark on HDFS when performing a one-time heavy reprocessing of raw reads (leveraging existing on-prem clusters), then use Snowflake or BigQuery to warehouse the processed results for easy querying by scientists. If the team values a fully managed, end-to-end solution, they might lean on DNAnexus or BaseSpace to reduce engineering overhead, especially in clinical genomics where compliance is critical. The choice often depends on existing infrastructure and skills (e.g., an organization with strong AWS skills might combine S3 + Redshift + AWS Batch for genomics, whereas another might choose a cross-cloud Snowflake solution to avoid cloud lock-in).
Clinical Trials Data Management and Analytics
Clinical trial data is diverse – patient enrollment info, electronic case report forms (eCRFs), lab results, medical images, sensor data from wearables, and more. These data come from different systems (EDC – Electronic Data Capture, LIMS, hospital EMRs, patient apps) often in varying formats. A data engineer's goal is to integrate and curate trial data for analysis (to monitor trial progress, ensure data quality, or combine results from multiple trials). Key requirements include flexibility to handle semi-structured data, scalability to manage many studies or high-frequency patient data, and compliance with regulations (clinical data must be handled under GCP and 21 CFR Part 11 rules, requiring audit trails and access control).
Technologies commonly used in this domain:
-
MongoDB for flexible clinical data storage: Clinical trial datasets can be highly heterogeneous – different trials collect different variables, and protocols change over time. MongoDB's document model is well-suited for such evolving schemas. A trial's patient records can be stored as JSON documents, allowing new fields or forms to be added without altering a rigid schema. This flexibility was demonstrated by the FIMED project (a biomedical data management tool), which chose MongoDB as the core to manage clinical trial data for its schema-less design and ability to handle semi-structured data ([7]). MongoDB allows dynamic forms and varying data per patient, which would be cumbersome in a traditional SQL schema. Scalability is another reason – MongoDB can be clustered (sharded) across multiple servers, supporting large datasets and high throughput. In fact, MongoDB "has been designed to operate using a cluster configuration, making it a great choice if scalability… is required" in clinical trial data contexts ([8]). With proper sharding (e.g. by study or site), it can handle concurrent data ingestion from many trial sites. Data engineers also appreciate MongoDB's querying and indexing for semi-structured data, and its ability to store files (with GridFS) – for example, PDFs of patient consent forms or images can be stored alongside data.
-
Hadoop and Spark for large-scale trial data processing: When dealing with large aggregated datasets (e.g., a pharma company analyzing all past trial data for patterns), Hadoop and Spark come into play. HDFS might be used to store raw dumps of clinical trial data (CSV files, JSON logs, even PDFs), forming a clinical data lake. Apache Spark can then be used to clean and transform this data at scale – e.g., parsing millions of eCRF records or merging datasets for a meta-analysis. Spark's distributed SQL engine (Spark SQL) and DataFrame API let engineers join and filter big data sets from multiple trials efficiently. For instance, if ingesting data from a wearable device in a trial (say daily heart rate readings from hundreds of patients), Spark could process these time-series in parallel to derive summary metrics per patient. Spark is also useful for machine learning on clinical data – e.g., training a model to predict patient dropout using trial data.
-
Cloud Data Warehouses (Snowflake, Redshift, Synapse) for integrated analytics: After collecting and cleaning trial data, a common practice is to load it into a centralized data warehouse for analysis by statisticians and data scientists. Snowflake is often used to create a unified view of clinical data across studies – it can easily ingest structured outputs (e.g., CSV extracts from EDC systems or the results of Spark processing) and make them queryable with SQL. Analysts can then use BI tools or Python/R to query Snowflake for interim analysis, patient safety signals, etc. A concrete example is using Snowflake to ingest XML data from ClinicalTrials.gov (a public registry) and analyze it with a BI tool: one team demonstrated loading trial data (in XML) into Snowflake and then using ThoughtSpot for search/analytics on it. This highlights Snowflake's ability to handle semi-structured data (it has JSON and XML functions) and work with external analytics tools seamlessly. AWS Redshift plays a similar role for companies deep in the AWS stack – for example, a company might copy clinical data to S3 and use Redshift's COPY command or Spectrum to bring it into a warehouse. Redshift can then join clinical data with other operational data (finance, etc.) for comprehensive reporting. Azure Synapse Analytics is another contender, especially if data is already stored in an Azure Data Lake. Synapse can combine a data lake store (where raw data from devices or logs are kept) with a SQL analytics engine for curated datasets. Microsoft provides integration between Synapse and tools like Power BI for visualization. A case study described a pharmacy chain using Azure Synapse to unify inventory and supplier data for trials supply management, demonstrating Synapse's use in syncing and analyzing data in real-time for operational efficiency (e.g., ensuring trial sites have drug supply). In general, these cloud warehouses provide scalability (to handle many trials' data), good performance for complex analytical queries, and features like encryption and role-based access crucial for compliance (with fine-grained access so only authorized personnel see certain sensitive data).
-
Informatica for data integration and ETL: Informatica's Intelligent Data Management Cloud (IDMC) tools are widely used to extract, transform, and load clinical data from source systems into a central repository. In 2025, Informatica expanded with Product 360 for Life Sciences, built on the AI-powered IDMC platform with industry-specific configurations to help pharma companies manage product data for IDMP compliance – critical given that EMA introduced stricter enforcement with fines of up to 5% of annual revenue for non-compliance in 2025 ([9]). The Fall 2025 IDMC release introduced AI Agent Engineering enabling enterprises to build and manage customizable agents through a no-code interface, reducing development time from weeks to minutes. In February 2025, Informatica and ZS extended their life sciences partnership, combining IDMC with ZS's ZAIDYN platform for unified data fabric solutions. Informatica can pull data from EDCs (like Medidata Rave or Oracle Clinical) via connectors, apply transformations, and load into a warehouse or data lake. Master Data Management (MDM) from Informatica maintains a master list of investigators, trial sites, or patients to link data across systems. Pfizer's example of modernizing data integration – migrating to cloud-native integration using Informatica Intelligent Cloud Services with Snowflake, automating 99% of data mappings – continues to be a model for pharma digital transformation.
-
Graph databases for study relationships and metadata: Graph technology is gaining prominence in clinical research and drug discovery for linking disparate data and supporting complex queries. At the GraphTalk Pharma & Life Sciences 2025 event, leading pharmaceutical companies shared production-ready graph implementations ([10]). Merck presented its Synaptix platform that connects fragmented knowledge across pre-clinical research, clinical development, and regulatory operations using Neo4j, powering both analytics and agentic GenAI workflows for drug repurposing and competitive intelligence. Bayer introduced patient-centric data integration using graph models, creating "patient maps" that link clinical and molecular datasets to understand disease mechanisms and improve trial success rates. Hetionet, a public drug repositioning knowledge graph, and GenomicKG (with 347 million nodes and 1.36 billion edges) demonstrate the scale of modern biomedical knowledge graphs. Knowledge graphs are experiencing a renaissance in the era of generative AI, with tools like Neo4j's Knowledge Graph Builder making adoption more accessible than ever.
-
Veeva Vault for clinical content and data: Veeva Vault is a cloud platform specifically built for life sciences, and while it is more a content/document management system than a "big data" engine, it is crucial in clinical trial operations data management. All 20 top biopharma companies have now selected Vault eTMF, and 19 out of 20 use Vault QualityDocs ([11]). Vault provides applications like eTMF (electronic Trial Master File), CTMS, EDC, and Study Startup on a unified platform. In October 2025, Veeva announced Veeva AI Agents powered by large language models from Anthropic and Amazon (hosted on Amazon Bedrock), with phased availability starting December 2025 for commercial applications, April 2026 for Safety & Quality, and August 2026 for Clinical Operations, Regulatory, and Medical. More than 100 biotechs across 60 companies have adopted Veeva Basics for standardized clinical, regulatory, and quality operations. Data engineers might not use Vault for heavy analytics, but they will integrate data from Vault (such as trial documentation status or site activation metrics) into warehouses for reporting. Vault's advantage is that it's pre-validated and compliant – it meets GxP requirements out of the box, with audit trails and role-based security.
Example: Consider a large Phase III clinical trial collecting data via an EDC system, a wearable ECG device, and lab test results from a central lab. A possible pipeline: Data engineers set up Informatica jobs to regularly extract new EDC data and lab data, using mapping rules to a common schema. This data lands in an Azure Data Lake as raw files. A scheduled Spark job (e.g., on Azure Synapse Spark pool or Databricks) cleans and combines these with wearable data (ingested via IoT pipelines into the Data Lake). The curated data (patient visits, adverse events, biomarker readings) is then loaded into Azure Synapse Analytics where a fact/dimension schema (data mart) allows fast analysis of, say, adverse event frequency by patient subgroup. Throughout, patient identifiers are consistent via an MDM system, and access is controlled. The clinical operations team also pulls data from Veeva Vault CTMS (via API or export) about site performance (enrollment numbers, queries, etc.), which is integrated into the warehouse. On Synapse or Snowflake, the company can run SQL analytics to identify sites with high query rates or to compare efficacy signals. They can also generate submission-ready datasets (CDISC SDTM/ADaM) by using these integrated data and ensure those outputs comply with standards. If they use a knowledge graph approach, they might also load the data relationships into Neo4j, linking the study, patients, drugs, and outcomes, enabling complex queries like "find all trials where a similar adverse event profile was observed for drugs targeting the same pathway."
Comparison: Technologies for Clinical Trial Data
| Technology | Strengths in Clinical Data Use Case | Weaknesses/Considerations | Example Usage & Adoption |
|---|---|---|---|
| MongoDB (document DB) | Extremely flexible schema – can handle evolving case report forms. Scales out with sharding for large multi-trial data. Fast query performance on JSON data with indexes. Developers can iterate quickly without schema migrations ([7]) ([8]). | Lacks built-in analytics (no JOINS across collections like RDBMS; though aggregation pipeline is powerful). Complex transactions are limited (usually OK for logging trial data). Requires careful data modeling to avoid inconsistent entries. | Used in platforms for managing trial data with flexible forms (e.g., storing patient records and eCRFs). Sanofi's translational medicine platform reportedly uses MongoDB to unify research and clinical data (for its flexibility). Many startups use Mongo for healthcare apps that need quick iteration. |
| Hadoop & Spark | Ideal for batch processing of large trial datasets (combining data from many studies or processing high-frequency data like wearables). Spark provides fast in-memory computation for tasks like data cleaning and ML on patient data. Hadoop (HDFS) can store raw, unstructured dumps cost-effectively. | Hadoop ecosystem has steep learning curve; not typically used by clinical ops teams, so data engineers must bridge gap. Batch processing means results are not real-time. On-prem Hadoop may face validation hurdles. Spark jobs need to be monitored for failures in pipelines. | Employed by organizations doing secondary analysis on aggregate trial data. E.g., using Spark to process a million records from a long-term outcomes study overnight. Hadoop clusters were used historically to store large clinical datasets, though cloud data lakes are now more common. |
| Cloud Warehouse (Snowflake/Redshift/Synapse) | Provides a unified, performant analytics environment. Handles structured trial data at scale, enabling complex SQL (joins between patient, site, drug tables). Easy connectivity to BI tools for dashboards (e.g., enrollment metrics, safety signals). Security and role management to restrict sensitive data access (e.g., blinded data). Snowflake in particular simplifies maintenance (no indexing needed) and can ingest semi-structured data like JSON (for ingesting things like questionnaires). Synapse offers an end-to-end workspace (data ingestion, SQL, even Spark in one platform) which is convenient for Azure-based pharma. | Primarily for structured/processed data – raw unstructured inputs often need pre-processing before loading. Cost can grow with very large data or complex queries (engineers must optimize load and query patterns). Redshift requires choosing distribution keys and may need tuning as data volume grows. Synapse and Snowflake both require careful data partitioning for very large tables to maintain performance. | High adoption: Nearly all large pharma have a data warehouse for clinical data. Snowflake is increasingly popular for cross-trial data marts and sharing data with partners. Companies in AWS use Redshift or migrating to Snowflake for trials. Azure-focused companies use Synapse (e.g., as the basis of modern data warehouse for trial and real-world data at Novartis or Novo Nordisk). |
| Informatica (ETL/MDM) | Excellent for integrating multiple data sources – connectors for clinical databases (e.g., Oracle Clinical), flat files, spreadsheets. GUI-based data mapping is auditable and can be reused for each trial. Informatica MDM can maintain golden records for key entities (patients, investigators) to de-duplicate and link data across systems. Offers data quality tools (to validate ranges, codes) which is critical for clinical data cleaning. | Enterprise cost can be high. Setting up mappings initially is time-consuming (but pays off over time). Cloud-based alternatives (like Azure Data Factory or AWS Glue) exist and might suffice for simpler pipelines. Needs integration with source system APIs or DBs which might require IT involvement. | Very high adoption in pharma: e.g., Takeda and Pfizer modernized their data pipelines with Informatica to handle clinical and commercial data integration. Often, legacy ETL for trials is built in Informatica PowerCenter (on-prem) and gradually shifting to Informatica Cloud or similar. Used to populate data warehouses and also feed operational dashboards. |
| Neo4j / Graph DB | Captures relationships that are hard to see in tables – e.g., linking investigators to trials to publications, or patients to all their treatments and outcomes in long-term studies. Enables complex traversals: "find trials with similar eligibility criteria to my trial" or identify hidden connections (as knowledge graphs can link multi-omics and trial data). Neo4j has a relatively simple query language (Cypher) for such queries. Can help ensure standards by linking data points to ontology nodes (like adverse event terms to MedDRA hierarchy in a graph). | Not traditionally used for core trial data analysis (which relies on statistics and set operations more than graph traversal). Adds an extra technology that requires graph modeling expertise. Performance could suffer if naively used for very large graphs (TigerGraph might handle larger scale). Potentially redundant if relational approach suffices for the problem. | Emerging adoption: Some pharma R&D teams experiment with knowledge graphs for integrating research data with trial data (e.g., linking trial results to gene targets and literature). Regulatory informatics teams might use graphs to model relationships between regulations, studies, and filings. Still relatively niche compared to mainstream relational approaches. |
| Veeva Vault (Clinical) | Purpose-built for managing clinical operations data and documents. Vault's CTMS, eTMF, etc., unify trial management processes with built-in compliance. It ensures audit trails and Part 11 compliance with minimal configuration. Scales to enterprise (global trials across many sites). Integration via Vault API allows pulling structured data (like study statuses) into other systems. Using Vault dramatically reduces the need for custom-built solutions for trial documents and site management. | Vault is primarily an operational platform – its built-in reporting provides streamlined analytics with options to extend via Veeva Nitro for deeper insights, so teams often export data for advanced analysis in dedicated tools. As a managed SaaS, access is through Veeva's interface or API, which simplifies administration while ensuring compliance. Data engineers mostly consume data from Vault and integrate it into their analytics pipelines. | Very high adoption in pharma for trial management content – top pharma companies use Vault eTMF and CTMS. For data engineers, Vault is a source of truth for certain data (like milestones, document completion) which they integrate with performance dashboards. Vault's presence ensures any solution they build must interface well with it (often via API or flat file exports). |
In summary, clinical trial data management benefits from a hybrid approach: NoSQL (MongoDB) for flexibility at the data capture stage, ETL tools (Informatica) for integration, big data tools (Spark/Hadoop) for heavy lifting on raw data, and cloud warehouses for serving curated data to analysts. A critical consideration is always compliance: these systems must maintain patient privacy (often using de-identified IDs) and provide audit logs for any data changes, which is why specialized systems like Veeva Vault and careful data governance with tools like Informatica are so prevalent.
Regulatory Data Management and Compliance
Pharmaceutical companies must manage vast amounts of regulatory data and content: submission dossiers (hundreds of PDF documents like study reports, manufacturing details), health authority correspondence, product registration data across countries, and internal compliance documentation. Unlike other use cases, regulatory data is often more document-centric (unstructured or semi-structured content) and requires strict version control, traceability, and security (to comply with FDA, EMA regulations and GxP quality guidelines). Data engineers focus on ensuring that this content and associated metadata can be stored, retrieved, and linked efficiently, and that data flows (for example, between regulatory and clinical systems) are integrated.
Key technologies and approaches:
-
Veeva Vault (Regulatory Information Management): Veeva Vault is a cornerstone in many pharma regulatory IT landscapes. It provides applications for RIM (Regulatory Information Management), including modules for tracking product registrations, managing submission content, and archiving submission packages. Vault's Regulatory Submissions module, for instance, manages the assembly of submission content (like the CTD – Common Technical Document – sections) and can publish in formats like eCTD. What makes Vault stand out is that it's built for compliance and content management on a single platform, meaning it was designed to meet the performance and validation requirements of the life sciences industry from the ground up. Vault ensures that all documents are versioned, all user actions are audited, and that it meets 21 CFR Part 11 (electronic records/signatures) compliance. Data engineers might not manipulate Vault's internals (as it's a SaaS), but they will integrate it: for example, extracting metadata about approvals, or linking Vault content with data warehouses. Vault's underlying technology stack uses a NoSQL content store and an object-oriented data model that scales globally (Veeva hosts Vault in the cloud with data centers in multiple regions). It can handle thousands of users and millions of documents, which is essential for large companies with dozens of products and global operations. Vault also provides APIs and integration hubs so that, for example, when a submission is approved, that information can flow to other systems (like manufacturing or ERP to trigger product launch). In terms of big data, Vault may not be about large-scale computation, but it is about centralizing authoritative data and content so it can feed analytics. Modern RIM analytics involve pulling structured data (like lists of approved indications, or timelines for each submission) out of Vault and into a warehouse for metrics.
-
Relational and Data Warehouse solutions for regulatory data: While documents live in systems like Vault, the structured facets (e.g., lists of all global filings, status of each, commitment due dates, etc.) are often stored in relational databases or warehouses for reporting. For example, companies might use an Oracle or PostgreSQL database (sometimes part of older RIM solutions) to store registration data. Increasingly, they are moving this to cloud warehouses like Snowflake or Azure Synapse to integrate with other enterprise data. A data engineer might create a data mart of regulatory KPIs (e.g., time from submission to approval, number of pending queries by agency) by blending data from Vault (via exports) and other sources. The technology choice here is driven by the need for joinable, queryable data – hence SQL databases or warehouses are common. Snowflake's secure data sharing could even allow a scenario where a pharma company shares certain regulatory data with a partner (under strict controls) during a co-development project.
-
Hadoop/Spark for text mining of regulatory documents: Regulatory affairs departments increasingly use NLP and text mining on submissions and health authority feedback to glean insights (like identifying all documents where a particular risk is mentioned). For such use cases, big data frameworks come into play. A cluster using Hadoop or Spark can be employed to index and analyze thousands of PDF/XML documents from past submissions. For example, Spark with an NLP library can parse through narratives in clinical study reports to find key information requested by regulators. Hadoop's scalability allows processing large corpora of regulatory correspondence (which could be many gigabytes of text) in parallel. Data engineers might set up an index (Elasticsearch) for these documents, with an upstream Spark job populating it. While this is not yet ubiquitous, it's a growing area as companies realize the value of the unstructured data locked in their archives.
-
Graph databases for regulatory knowledge: Regulatory data is highly interconnected – a single drug product is linked to many submissions in different countries, which in turn link to commitments, variations, manufacturing sites, and so on. Representing this as a graph can be intuitive. Neo4j or TigerGraph can be used to build a regulatory knowledge graph: nodes might be "Product", "Submission", "Regulatory Authority", "Manufacturing Site", etc., and edges capture their relations (submitted-to, approved-by, supplies, etc.). This can help answer complex questions, like "Which approved products would be impacted if a particular manufacturing site's license is revoked?" by traversing the graph. Neo4j has been discussed as a way to model and query such regulatory networks for impact analysis. Additionally, linking regulatory data to external knowledge (like linking an indication approved in a label to published clinical evidence) is a kind of multi-relational query that graphs handle well. TigerGraph, with its emphasis on fast deep link analytics, could handle very large regulatory graphs (spanning all products and regions) if needed, ensuring performance for queries that might traverse many hops (e.g., through multiple levels of supply chain and approval relationships). However, these uses are still emerging – many companies rely on conventional databases and manual processes for regulatory tracking, but we foresee more graph utilization as data volume and complexity grow.
-
Informatica and data governance: In regulatory data, data quality and governance are paramount – a mistake in a submitted data point can be costly. Informatica's data quality tools might be used to validate structured regulatory data (e.g., ensure all required fields for a submission are present and follow the standards). Master Data Management could also apply: for instance, maintain a master list of global health authority IDs or a dictionary of standardized regulatory terms. Informatica is investing in industry-specific solutions (Informatica has an "Industry Data Bundle" for life sciences) that could ease managing things like controlled vocabularies. Ensuring consistency (such as using the same drug name across all submissions) is a place where these tools help.
-
Compliance features of cloud platforms: When regulatory data is moved to the cloud for analysis, ensuring the platform is compliant is a major consideration. Tools like Snowflake, Azure, AWS all have options for compliance (audit logging, data encryption, region locality). Azure's offerings like Azure Synapse and Azure Data Lake Storage are often configured in GxP-qualified environments for pharma. Data engineers might work with validation specialists to qualify these environments. For example, using Azure Data Lake to store regulatory data would involve setting up proper access controls (Azure AD integration, perhaps container-level access policies) to ensure only authorized regulatory personnel can access certain data. Compliance requirements also influence design: for instance, if using a data lake to store submission archives, one might need to implement retention policies and legal hold capabilities.
Example: A regulatory operations team manages all submission documents in Veeva Vault RIM. Every time they submit to FDA or EMA, the submission content (dozens of files) and metadata (submission date, approval date, etc.) are stored in Vault. A data engineering team sets up a nightly job to extract key metadata from Vault via the API – for example, an export of all submission records and their statuses. This data is loaded into a Snowflake table that accumulates the company's regulatory history. On Snowflake, they also integrate data from other sources: perhaps a spreadsheet of regulatory commitments (post-marketing study requirements) tracked by another team, or manufacturing changes from a quality system. By combining these, they produce dashboards that show, say, all upcoming regulatory milestones or how long approvals are taking in each region. Meanwhile, another use case: They want to leverage historic submission text to improve future ones. The engineers use Spark on an Azure Databricks cluster to perform NLP on hundreds of past reviewer reports (text documents) to see common deficiencies cited. They store the parsed text in an index for search, and also connect some data points (like product names, issues) in a Neo4j graph linking to the respective submissions. This graph might reveal, for instance, that multiple products had stability data questions from Health Authority X, indicating a systemic issue to address. Through all this, the data remains in secure environments: the documents stay in the controlled Vault repository (Spark might access them via secure API or a dump placed in a secure storage), and any cloud analysis environment is validated for regulatory use.
Comparison: Technologies for Regulatory Data Management
| Technology | Role in Regulatory Use Case | Differentiators and Compliance | Real-World Adoption |
|---|---|---|---|
| Veeva Vault (RIM) | Central platform for regulatory documents and data (submission content, product registrations, correspondence). Provides workflows for authoring, reviewing, and approving documents. Serves as the authoritative source for all submission dossiers and tracking data. | Differentiators: Purpose-built for life sciences – includes domain-specific features (e.g., eCTD structure management). Highly compliant: validated SaaS, Part 11-ready (audit trails, electronic signatures). Integrates content and data (the Vault platform links document records with structured fields like product, country, submission type). Scalable across global orgs. | Standard in industry: Most big pharma use Vault or similar (like Documentum-based systems) for regulatory. Vault's cloud nature and frequent updates have made it popular. Companies like Gilead, Boehringer Ingelheim, etc., have publicly adopted Vault for RIM. Data engineers often must pull data from Vault for reporting since it's the main source of truth. |
| SQL/Cloud Databases | Store structured regulatory metadata: product lists, country registrations, approval dates, commitments. Useful for reporting and analytics beyond the document-centric view. Often the backend of RIM tools or custom tracking databases. | Traditional RDBMS are reliable and well-understood, and can enforce data integrity (constraints, referential integrity) which is useful for critical reg data. Cloud warehouses (Snowflake, etc.) can hold this data and allow linking with other enterprise data (like sales, to correlate approvals with launch dates). They also offer robust security and can be partitioned by region for data sovereignty. | High adoption: Even with Vault, many companies extract to or maintain a relational store for cross-system joins. Some have legacy RIM on Oracle databases they now integrate with cloud platforms for analysis. Snowflake and Synapse are beginning to host regulatory data marts where teams analyze workload and performance metrics (e.g., number of submissions per year, agency query response times). |
| Hadoop/Spark (Text Analytics) | Applied to large collections of regulatory text (submission documents, labels, health authority queries) for insight extraction. Spark can distribute NLP tasks (e.g., finding all mentions of a certain adverse event across hundreds of PDFs). Hadoop HDFS can hold a corpus of documents in a distributed way for processing. | Allows leveraging big data techniques (NLP, ML) on unstructured data that was traditionally not analyzed at scale. This can reveal patterns or help in preparation of submissions (e.g., learn which words regulators flag). Spark's ability to use libraries (like spaCy or Spark NLP) and run in parallel is key for timely processing. | Growing adoption (experimental): Big pharmas have begun pilot projects to analyze regulatory text using data science. E.g., using Spark to parse FDA briefing documents to see common concerns. Not yet a routine part of regulatory ops, but likely to increase as data-driven approaches penetrate this area. |
| Graph DB (Neo4j/TigerGraph) | Model complex relationships: product–submission–approval–manufacturing–variation networks. Helpful for impact analysis and connecting regulatory info with other domains (safety signals, manufacturing changes). TigerGraph could handle very large, complex regulatory graphs with deep link analytics (like tracking an issue across a network of suppliers and products). | Graphs excel at interdependency analysis, which is crucial in regulatory change management. A graph query can quickly find all submissions that included a certain manufacturing site or all products that would be affected by a guideline change. TigerGraph's performance on multi-hop queries means even complex supply chain+regulatory queries could be run in real-time. From a compliance perspective, graphs would be an internal tool; they'd need same access controls as other DBs if containing regulated data. | Limited but emerging: Some companies use Neo4j for pharmacovigilance compliance (linking drug-event-case for signal detection). For regulatory, a few forward-looking teams might use graphs to map processes. Example: FDA itself has explored graph-based representations of the drug review process. Pharma adoption is still early, but interest is growing in using knowledge graphs to unify regulatory and scientific data. |
| Informatica & Governance | Ensures data consistency and quality across systems – e.g., if the drug name or indication must exactly match between the clinical database and the submission, Informatica can enforce or correct it. Helps migrate legacy regulatory data into new systems (ETL). Data cataloging tools document data lineage (important for audit/inspection). | The strength is trust in data – using data quality rules to catch errors (like a missing submission date or a mismatch in country codes). Informatica's governance aids compliance by providing lineage: one can show an inspector how data from a trial flows into a submission data set. It also can automate some processes, e.g., notify if a new approval appears in one system but not yet logged in another. | High adoption (indirectly): While a reg affairs user might not see Informatica, IT uses it behind the scenes. Pharma companies that migrated to Vault often used Informatica to load legacy data. Pfizer's integration of cloud data (with Snowflake) likely includes regulatory data moving with Informatica's help. Overall, Informatica is a trusted backbone for ensuring all these interconnected systems stay aligned. |
In regulatory data management, the emphasis is on single source of truth, traceability, and compliance. Technologies like Vault address these by providing a controlled environment for content, whereas data platforms (databases, warehouses) ensure the information can be analyzed and reported. The choice of technology leans more toward specialized platforms (Vault) and stable databases, with big data tools being used in supporting roles (e.g., text mining or linking data). A data engineer's challenge is often integrating these without violating compliance – for instance, if using Spark to analyze documents, one must be careful to not create unapproved copies of controlled documents. Thus, integration patterns (APIs, secure data lakes) and proper governance are as important as the tools themselves.
Pharmacovigilance and Drug Safety Analytics
Pharmacovigilance (PV) involves monitoring and analyzing data on drug safety – adverse event (AE) reports, side effects in clinical use, literature reports, and sometimes social media signals – to detect any potential risks associated with pharmaceutical products. This domain generates large volumes of data (spontaneous reports like FDA's FAERS database contain millions of records) that are both structured (case report fields) and unstructured (narrative descriptions). Data engineers in PV work on ingesting diverse safety data sources, performing signal detection algorithms, and enabling queries to find correlations between drugs and adverse events. Important considerations are scalability (processing millions of records quickly), real-time or frequent analysis (for signal detection runs), and strong compliance/privacy (patient data in safety cases must be protected; PV data is subject to regulatory audits).
Key technologies and their use in PV:
-
Apache Hadoop and Spark for large-scale adverse event data analysis: Many pharmacovigilance teams have turned to big data frameworks to handle public and internal safety datasets. For example, the FDA's FAERS (Adverse Event Reporting System) data is publicly available and has grown substantially – as of Q2 2025, FAERS contains over 19 million background patients accounting for 57 million adverse event records ([12]). The FDA now receives over 1 million adverse-event and medication error reports annually, making it one of the largest pharmacovigilance databases in the world. Spark is highly suitable for crunching this data: Open-source projects have used PySpark to ingest and analyze FAERS on HDFS. In one case, analysts built a Spark pipeline on Google Dataproc to transform FAERS data and apply disproportionality algorithms (like reporting odds ratios or the Bayesian proportional reporting ratio) in minutes. This same task might take hours on a single machine. Spark's ability to distribute computations allowed using methods like the likelihood ratio test with Monte Carlo simulation to identify drug-event pairs that occur disproportionately. Similarly, Hadoop MapReduce has been used historically to count drug-AE co-occurrences and detect signals, although Spark is now preferred for its ease and speed. In addition to FAERS, companies ingest adverse event data from global sources (EudraVigilance, VigiBase) and even from patient support call centers – these can stream into an HDFS or cloud data lake, then Spark jobs aggregate and analyze them regularly. HBase or Cassandra might also be used to store the processed safety signals for quick lookup (for instance, a wide-column store keyed by drug name containing a list of associated significant adverse events).
-
NoSQL for case management systems: The primary PV case processing systems (like Oracle Argus, ArisGlobal) typically use relational databases, but there's a trend towards scalable data stores for certain aspects. For instance, if capturing real-time adverse event feeds (like social media or IoT medical device alerts), a NoSQL solution could be used for ingestion. Cassandra is suitable where high-velocity inserts are needed – imagine a scenario where thousands of patient devices send alerts that might indicate adverse reactions (blood pressure spikes etc. in a trial). Cassandra can capture time-stamped device data reliably and at scale, ensuring no events are lost, and then link them to patient records for safety analysis. MongoDB can be used to store aggregated case data with flexible schema – beneficial if new fields need to be added for special safety studies. Additionally, text from case narratives can be stored in a document-oriented way for text mining.
-
Graph databases for signal detection and causality analysis: Safety data inherently forms a graph: patients, drugs they take, and events they experience are all connected. Neo4j has been explored for pharmacovigilance to connect these entities and run graph algorithms to find previously hidden relationships. A knowledge graph in PV can incorporate not just the basic drug-event pairs but also patient factors, genetics, comorbidities, etc. Querying this graph could answer questions like "find all reports where a drug was taken along with Drug X and the patient had outcome Y". Graph algorithms (like community detection or centrality) might identify clusters of drugs with similar side effect profiles. In one scoping review, knowledge graphs were recognized for their added value in PV, especially their ability to integrate multi-source data and predict adverse drug reactions by analyzing complex relationships. Another advantage is visualizing safety data: a graph of adverse event connections can help experts see patterns (for example, a particular adverse event node connected to multiple drugs of the same class, suggesting a class effect). TigerGraph could also be relevant if scaling to very large PV graphs (like including every patient-case as a node). TigerGraph's fast traversal could enable near real-time exploration of new incoming cases against an existing large graph of historical cases.
-
Machine learning libraries (Spark MLlib, etc.) and AI for PV: Beyond counting and ratios, PV is increasingly employing machine learning for signal detection (to reduce false positives and prioritize signals). Data engineers might use Spark's MLlib or even GraphX for developing prediction models on big safety data. For example, using features of cases (patient demographics, polypharmacy, etc.) to predict which cases are likely to represent a true safety signal. These models often require a big data framework to train on the full volume of data. NLP is also important: extracting important medical concepts from narrative text of AE reports. Frameworks like Spark NLP or Hadoop with UIMA can process text at scale to classify case report narratives, which then feed into the data for analysis.
-
Cloud data warehouses for integrated safety data: Once initial processing is done (e.g., computing signal metrics), results are often stored in a relational format for medical review. Snowflake, Redshift, or Synapse can be used to house a "safety data mart" that combines adverse event data with other relevant data (like drug exposure data from sales or patient counts from trials). This allows analysts to run SQL queries such as comparing event rates across regions or time periods. For example, Snowflake could store a table of drug-event signals with columns for various disproportionality scores, which pharmacovigilance scientists can query using visualization tools. Since safety data may need to be updated frequently (as new cases flow in), these warehouses should handle frequent inserts and updates; modern warehouses can do this, though historically PV groups used on-premises relational databases for this purpose. The compliance aspect is critical: safety data often contains personal health information. Cloud warehouses used for PV must be configured securely (HIPAA compliance, data encryption, restricted access). Many pharma companies maintain PV data on internal servers for this reason, but there's a gradual move to cloud as security maturates. Snowflake's secure data sharing could even allow sharing de-identified safety data with partners or regulators for collaborative signal analysis.
-
Real-time streaming and alerts: In some cases (e.g., post-marketing commitments or monitoring social media for safety), real-time processing tools like Apache Kafka and stream processing (Spark Streaming or Kafka Streams) might be used. These allow continuous ingestion of events and immediate flagging if a certain threshold is hit (e.g., if X number of similar AEs occur within a short window). While not explicitly listed by the user, it's worth noting in passing that the ecosystem can include these for complete PV solutions, often writing into the same big data stores (Kafka feeding a Cassandra cluster for real-time alert data, for example).
Example: A pharmacovigilance department collects adverse event reports from multiple sources: internal clinical trials, post-market surveillance (healthcare providers and patients reporting events), and external databases like FAERS. To process this, data engineers build a pipeline: All raw reports (which may come as XML files or via an API) land in an Azure Data Lake store. A Spark job runs nightly to process new reports – parsing the XML, standardizing drug names and event terms (using dictionaries like MedDRA), and appending them to a master dataset. This Spark job also calculates signal detection statistics: for each drug-event pair, it computes disproportionality metrics comparing to the background frequency. These results are stored in a Delta Lake table (an open format on the data lake), and also pushed into Azure Synapse Analytics (SQL pools) for easy querying via SQL. On Synapse, safety scientists can run queries like "show me all events with an elevated reporting ratio for Drug X" or use Power BI to visualize trends over time. Meanwhile, the engineers have also set up a Neo4j graph where each incoming case is a node linked to nodes representing the drug and the adverse reaction. Over time, this builds a network; they run graph algorithms to see if any new drug suddenly becomes highly connected to a cluster of severe reactions. If such a pattern appears, an alert is generated. To handle text fields, they integrate Spark NLP in the pipeline to extract keywords from the narrative (like symptoms or lab results mentioned), which then gets indexed in an Elasticsearch for the medical reviewers to search free-text across cases. All of this is done in a secure environment – the data lake and Synapse are configured with encryption and accessible only to authorized PV personnel (with auditing). The company can demonstrate compliance by showing the lineage of data from ingestion to signal report (thanks to logged Spark jobs and versioned data in Delta Lake). In fact, by using these technologies, they manage to analyze the entire FAERS database plus their internal data in minutes, something that used to take much longer on traditional tools.
Comparison: Technologies for Pharmacovigilance
| Technology | How It's Used in PV | Benefits and Differentiators | Considerations |
|---|---|---|---|
| Spark on Hadoop | Batch processing of large AE datasets (e.g., computing signal scores across millions of cases). Machine learning on safety data, NLP on case narratives. Often deployed on cloud (Databricks, EMR) for scalability. | Can handle entire global safety DB in memory/distributed, yielding fast computation (e.g., analyzing FAERS 12M records in minutes vs years by manual review). Supports complex algorithms (MLlib, custom Scala/Python code) and heavy join operations (drug with background population). | Requires data engineering expertise to set up pipelines and interpret results. Ensuring data quality (duplicate case handling, etc.) is up to the implemented code. Spark jobs need to be carefully validated for regulatory submission of results. |
| Cassandra | Ingesting high-velocity safety data (e.g., device signals, web reports) and storing time-series or case records for quick retrieval. Also can store aggregated counts for real-time dashboards. | High-write throughput and fault tolerance – the system stays up even if nodes fail, ensuring safety data isn't lost. Great for time-stamped data (each adverse event as a row keyed by drug or patient ID + time). Scales linearly for increasing volume, so can handle growing report rates. | Not ideal for ad-hoc queries outside primary key – one usually queries by drug or patient ID, but complex queries (e.g., all cases with symptom X) require designing data model carefully or exporting to another system. Also, joins must be done in application code (no multi-table join in Cassandra). Often used alongside Spark for analysis. |
| Neo4j / Graph | Building a safety knowledge graph linking drugs, adverse events, patients, maybe genes (pharmacogenomics) and diseases. Used to visually and algorithmically discover indirect links (e.g., two drugs causing similar clusters of events might hint at a mode-of-action issue). | Represents many-to-many relationships naturally: a patient on multiple drugs with multiple events is easy to model. Enables queries like "Find all events that occur with Drug A and Drug B together but not with either alone" – something tricky in SQL but straightforward with graph traversal. Graph algorithms can find communities of events or identify central "hub" drugs that connect to many events. | Needs careful curation – data might be noisy, and graph algorithms can produce results that need medical interpretation (not every connection implies causation). For huge volumes (millions of nodes/edges), Neo4j might require clustering or using a more scalable graph like TigerGraph. Data privacy: patient nodes must be de-identified. Still relatively new in PV practice – would need user training to leverage fully. |
| Snowflake / SQL DW | Integrating safety data with other data (like exposure data, drug utilization, or manufacturing data for quality signals). Creating dashboards and standard reports (monthly PV summary, regulatory periodic safety update reports data aggregation). | Provides an enterprise single source for safety metrics that can be easily queried by analysts and output for regulatory reporting. High concurrency for multiple users (medical reviewers, epidemiologists) to run queries simultaneously. The structured environment makes validation and reproducibility easier (SQL queries can be logged and reviewed). | Requires that data be transformed and loaded in structured form – unstructured text needs pre-processing before it can be stored in tables (though variants like Snowflake can store JSON if needed). There's some latency (data may be up-to-date daily rather than real-time). Also, careful attention to access control is needed to ensure only aggregate or appropriate data is accessible (especially if any PII is present, which ideally it should not be in a data warehouse). |
| Machine Learning Tools | Used for predictive PV (which drug-event pairs are likely signals) and for automating case processing (like triaging which cases are high priority). Examples include using Python scikit-learn or Spark ML to classify case seriousness based on text, or to find latent topics in adverse event reports. | Adds advanced analytical capability: can reduce workload by focusing human attention via AI. For instance, an ML model might identify that certain combinations of drug and patient conditions predict higher severity of outcome, prompting earlier intervention. Spark's MLlib allows these models to be trained on the full dataset rather than sampling. | ML models can be a black box – regulators require explainability for decisions affecting drug safety. This means data engineers must implement and validate models carefully and provide rationale (e.g., using approaches like LIME for explainable AI). Integration of ML outputs into workflow must be done such that it aids rather than confuses PV experts. Not a replacement for traditional methods yet, but a complement. |
Pharmacovigilance is a data-heavy domain where big data tech is proving its worth by speeding up detection of safety signals and allowing more complex analyses than previously possible. A key trend is combining diverse data (clinical trials, real-world usage, literature) – this is where these technologies shine by handling volume and variety (the "3 V's" of big data: volume, velocity, variety) in drug safety. The ultimate goal remains the same: protect patients by identifying risks early. Thus, any technology used must not only be powerful, but also reliable and transparent enough to satisfy regulatory scrutiny when decisions (like issuing warnings or pulling a drug) are made based on data.
Manufacturing and Supply Chain Optimization
Pharmaceutical manufacturing and supply chain operations generate big data from production lines, quality control labs, inventory systems, distribution logistics, and IoT sensors (e.g., temperature monitors in cold chain storage). Data engineers support use cases like predictive maintenance of equipment, optimization of supply chain routes, inventory forecasting, and ensuring product quality and compliance throughout the production process. These use cases require handling streaming sensor data, large time-series datasets, and complex networks of suppliers and distributors. The key technology needs are scalability for sensor/IoT data, real-time or near-real-time processing for timely decisions, integration of heterogeneous data (ERP systems, factory equipment logs, weather data, etc.), and compliance with manufacturing regulations (ensuring data integrity, audit trails for Good Manufacturing Practice).
Technologies in use:
-
Apache Cassandra for IoT and sensor data: Pharmaceutical manufacturing involves a lot of equipment and environmental sensors (e.g., monitoring temperature, humidity in production facilities, or GPS trackers for shipment conditions). These sensors often emit readings every few seconds or minutes, leading to a deluge of time-series data. Cassandra, as a distributed NoSQL store, is a popular choice to handle this kind of data due to its high write throughput and ability to scale horizontally without single points of failure. In a pharma manufacturing context, Cassandra might be used to store readings from thousands of IoT devices – each device's data can be partitioned by device ID and time, and Cassandra will distribute these across a cluster. This enables real-time dashboards of equipment status and supports queries like retrieving all readings for a given sensor in a time range very quickly. For example, if a company wants to track refrigerator temperatures for all vaccine storage units globally, Cassandra can ingest all these streams and still allow quick reads for the latest values or out-of-range alerts. Another use is batch logging: production machines often generate log entries (semi-structured) that can be stored in Cassandra for analysis of error rates, throughput, etc., complementing or replacing traditional historian databases.
-
Apache Hadoop (HDFS) and Spark for manufacturing analytics: Historical manufacturing and supply chain data (spanning years of operations) can be huge – think of every batch record, every equipment log, every shipment detail. Hadoop HDFS is often used as a data lake to store this history cheaply. Then Spark can be utilized for various analytics: predictive maintenance (analyzing sensor patterns to predict machine failure), yield optimization (finding factors affecting batch yield by analyzing past batch data), and supply chain simulation (using historical demand and supply data to model scenarios). For instance, a Spark job could combine machine vibration sensor data with maintenance logs to train a model that predicts when a machine will fail, allowing proactive maintenance scheduling. Another Spark job might process years of shipment temperature data to identify routes or packaging methods that risk product quality. In supply chain, Spark can optimize routes by crunching large datasets of delivery times, inventory levels, and even external data (like traffic or weather feeds). Hadoop's ability to store varied data formats is useful: raw CSV exports from SAP (ERP), JSON from IoT devices, and more can reside in HDFS or an Azure Data Lake, and Spark can join them.
-
Cloud analytics platforms (Azure Synapse, AWS Redshift/S3, Google BigQuery): Many pharma companies modernize supply chain analytics by moving to cloud platforms. Azure Synapse Analytics is often chosen for its unified approach: it can directly query data in Azure Data Lake Storage (where, say, raw IoT data or CSV extracts from on-prem systems are landed) and also ingest that data into a structured warehouse for high performance. A case study indicated a pharmacy chain improved inventory fulfillment by 96% by using Azure Synapse to integrate and analyze warehouse and supplier data in real-time. Synapse's integration of Power BI (for dashboards) and its built-in Spark engine means data engineers can build end-to-end pipelines (from cleaning data with Spark to serving it via SQL for BI) in one environment. AWS Redshift combined with S3 is similarly used – e.g., raw manufacturing data might be stored in S3, and Redshift or Athena used to query it to find trends or feed ML models (like Amazon Forecast for demand planning). Snowflake or BigQuery can also play roles here: Snowflake's cross-cloud capability and data sharing means manufacturers can even share data with suppliers or partners easily (for example, a CMO – contract manufacturing organization – could share production data directly to the pharma company via Snowflake secure sharing rather than exchanging flat files). BigQuery has been utilized in complex supply chain scenarios for its rapid SQL analytics on massive datasets (for instance, analyzing every sale and inventory movement to predict stockouts).
-
Graph databases for supply chain network modeling: Pharmaceutical supply chains are multi-tiered and complex (suppliers, manufacturers, distributors, wholesalers, pharmacies/hospitals). Graph databases shine in modeling these relationships and identifying vulnerabilities or optimization points. Neo4j can store a model where nodes are facilities or shipments and edges represent supply routes or dependencies. Questions like "what suppliers would be affected if this shipping lane is closed?" or "which finished products contain an ingredient from supplier X?" become graph queries. Graph DBs allow recursive queries that are hard in SQL (like multi-level BOM – Bill of Materials expansion). During the COVID-19 pandemic, such tools were highlighted for building more resilient supply chains. Graph analysis can help in risk mitigation (e.g., find single points of failure where one supplier feeds many products – a high-risk scenario). TigerGraph is notable in this field because it can handle very large graphs and do deep link analysis quickly, which is useful if you have a very large global supply chain graph. TigerGraph could combine internal data with third-party data (Dun & Bradstreet or others) to map out all relationships and run algorithms to find, say, the shortest path to reroute supply or the most central hubs in the network. For example, Merck and others have looked into graph solutions for supply chain risk – graphs can find connections (like the same shipping company serving multiple critical routes) that aren't obvious otherwise.
-
Streaming and real-time processing (Kafka, Storm, Spark Streaming): To react quickly (say, to a temperature excursion in a shipment or a sudden equipment alarm), streaming technologies are used. Apache Kafka might be the backbone to collect and distribute real-time data from factory sensors or logistics trackers. Then something like Spark Streaming or Flink could process those streams – e.g., detect an anomaly (temperature out of range) and immediately trigger alerts or control actions. While these aren't listed explicitly by the user, they complement Cassandra in IoT scenarios (often sensor data goes Kafka -> stream processor -> Cassandra for storage). They ensure that manufacturing supervisors or supply chain managers get timely insights (for instance, a live dashboard of all shipments and any that are in danger of delay or spoilage).
-
Informatica and integration: Manufacturing and supply chain data often reside in enterprise systems like SAP (for manufacturing execution and inventory) or LIMS (Lab Information Management for quality tests). Informatica is commonly used to ETL data from these sources into data lakes or warehouses for analysis. It can also enforce data quality (ensuring, for example, that all batches have complete quality test data before analysis). Additionally, Informatica MDM might manage reference data like material codes or location codes across systems so that when data is integrated, it lines up correctly. The Pfizer case mentioned earlier demonstrates the use of Informatica with Snowflake to integrate process and development data across supply chain and manufacturing, automating mappings from legacy systems and thus digitizing their supply chain.
-
Compliance and GxP considerations: In manufacturing, any system that influences GxP decisions (like release of a batch) has to be qualified/validated. Data lakes and big data tools used purely for process improvement may not directly make decisions but still need to be handled carefully. For example, if a model predicts equipment failure, the maintenance action might be an internal decision, but if a model were to directly call shots on product quality, it would need validation. Data engineers thus maintain a clear separation: these analytics systems are usually in the "Decision Support" category, not the actual systems of record for batch release (which remain validated MES or QMS systems). Still, auditability and data integrity is crucial – using blockchain has even been explored to ensure an immutable audit trail in supply chain data, though that's beyond our current scope.
Example: A pharma company wants to optimize its vaccine supply chain from manufacturing to distribution. They deploy IoT sensors in their manufacturing plants (monitoring equipment vibration, temperature) and in their cold chain shipments (GPS and temperature trackers in each shipment). Data engineers set up an AWS IoT + Kafka pipeline that streams all this sensor data into a Cassandra cluster in near real-time. On top of Cassandra, they have built a microservice that alerts if any temperature goes out of range for more than 5 minutes (reading the latest values from Cassandra, which is effectively acting as a real-time data store). All sensor data also gets periodically dumped to an S3 data lake for historical analysis. On that data, they run Spark on Amazon EMR to do two things: (1) Predictive maintenance – analyze equipment sensor data to predict failures. They use Spark MLlib to train models using labeled historical incidents. (2) Supply forecast – combine inventory levels, shipment transit times, and demand data (from sales forecasts) to simulate different scenarios and optimize inventory placement. For this, they ingest SAP inventory extracts into S3 and use Spark to join with distribution data. The results (like predicted stockouts or optimal distribution) are written to a Redshift data warehouse where operations teams can query them. They also use a Neo4j graph to map their supply network: nodes for factories, distribution centers, routes, etc. When a new disruption happens (say a particular route is closed), they can quickly query the graph to see alternative routes or to identify which products might be delayed. The graph also helps in regulatory compliance queries, e.g., if a raw material is found to be contaminated, the graph can find all batches and products using that material. Meanwhile, Informatica flows keep the master data in sync: it ensures the material codes from SAP match those used in the analytics systems, and it integrates quality test results from the LIMS into the data lake, so Spark can also factor in quality variability in its yield analysis. This integrated approach significantly improves their agility – for example, they found through Spark analysis that by adjusting production schedules based on predictive maintenance insights, they could reduce unplanned downtime by 30%. Inventory forecasting accuracy improved, reducing both shortages and waste (expired stock).
Comparison: Technologies for Manufacturing & Supply Chain
| Technology | Typical Use in Mfg/Supply Chain | Pros | Cons | Adoption Example |
|---|---|---|---|---|
| Cassandra | Collecting and storing high-speed sensor/IoT data from production equipment and shipments. Also used for real-time dashboards of process metrics. | Scalable, fault-tolerant: can ingest thousands of readings per second, design for zero single-point failure ensures continuous logging. Time-series optimized: data model can be set by time so queries like recent values are very fast. Good for distributed sites (nodes can be across regions). | Not built for complex analytical queries or multi-dimensional queries (those are done after moving data to Spark or SQL). Requires management of cluster nodes and tuning for write performance. If data retention is long, old data needs archiving (to avoid huge node sizes). | Global pharma using Cassandra to monitor manufacturing environments across plants – e.g., Novartis might use it to gather data from all production lines and feed a central monitoring system. Also used by device manufacturers for medical device telemetry. |
| Spark & Hadoop | Big data analytics on historical manufacturing data (predictive maintenance, process optimization) and supply chain data (demand forecasting, route optimization). Often used to merge data from many sources (ERP, sensors, labs). | Powerful analytics: Can run advanced algorithms on full datasets (not samples) – find subtle patterns that traditional SQL analysis might miss (like complex interactions of environmental factors affecting yield). Batch efficiency: can process years of logs in hours. Flexibility: supports custom code in Python/Scala for tailor-made analysis (e.g., custom simulation of supply scenarios). | Requires batch processing mindset – results are not instant. Quality of output depends on quality of data and models – data engineers must work closely with process engineers to validate findings. Hadoop clusters (if on-prem) need hardware and upkeep; cloud usage incurs cost that must be managed (especially if Spark jobs are not optimized). | Many pharma companies have data science teams applying Spark to production data (e.g., GSK using Spark on manufacturing data to improve processes, or Pfizer using it to simulate supply chain variations). Also, companies like Siemens or GE (in pharma context via partnerships) use Hadoop/Spark in their manufacturing optimization solutions offered to pharma. |
| Azure Synapse / Cloud DW | Creating a centralized view of supply chain and manufacturing metrics. Integrating data for BI reports – e.g., production throughput, cycle times, inventory levels, order fulfillment rates. Running complex SQL for trend analysis (monthly production vs. plan, supplier delivery performance). | Unified and real-time-ish: Modern warehouses can ingest relatively fast (e.g., micro-batch every few minutes) so dashboards are up to date. Scales to enterprise data: Handles joining large tables (orders, shipments, etc.) easily, which may be cumbersome in raw Spark. Easy integration with BI and tools: Analysts can use familiar SQL and visualization tools; less specialized knowledge needed compared to big data tools. | The warehouse typically contains processed data – so you need the ETL pipelines feeding it (which could be Spark or Data Factory, etc.). There is a cost trade-off: keeping years of granular data in a warehouse can be expensive; often data beyond a window is archived to data lake and not instantly queryable. Some real-time requirements cannot be handled purely in a warehouse (if second-by-second decisions are needed, streaming solutions are needed alongside). | High adoption: e.g., Johnson & Johnson uses a Snowflake/Azure-based data lake and Synapse to unify manufacturing data globally for reporting and analytics. A case study from Novartis (with Azure) or Pfizer (with Snowflake) show cloud data platforms improving supply visibility. Warehouses are often the core of control tower dashboards in pharma supply chain, offering management a one-stop view. |
| Neo4j / TigerGraph (Graph) | Modeling the supply chain network and production processes as graphs for resilience and optimization. E.g., nodes for raw materials, intermediate products, plants, distribution centers, and edges for supply relationships or material flows. Running graph algorithms to detect critical nodes or potential bottlenecks (like a single supplier feeding multiple critical drugs). | Makes interdependencies explicit: easier to trace paths and impacts (if one node fails, follow edges to see all impacted endpoints). Advanced analysis: community detection could identify clusters of facilities that rely on each other; centrality measures find key suppliers. Graph queries can be faster and simpler than recursive SQL for multi-tier supply chain questions. TigerGraph's performance allows near real-time analysis on very large networks. | Building and maintaining the graph model requires extra work (need to update it as supply chain changes). Graph DB knowledge is less common in ops teams. For TigerGraph, it's a newer tech – getting in-house expertise or support might be necessary. Also, graph outputs might need to feed into other systems; integration of graph results into existing dashboards needs custom development. | Emerging use: Some pharma have begun using Neo4j in supply chain risk management (e.g., to map suppliers to end products and alternate suppliers). At least one large pharma (per Neo4j case studies) used graph approach for supply chain transparency post COVID. TigerGraph has case studies in healthcare for patient 360, but similar principles apply to supply chain 360. |
| Kafka & Streaming | Real-time monitoring and alerting in manufacturing – e.g., pipeline to detect anomalies in equipment readings, or to trigger restock orders when inventory dips. Connects various systems in real time (MES to warehouse to shipping). | Real-time responsiveness: milliseconds to seconds latency. Ensures critical events (equipment alarm) don't sit in a batch queue. Buffering and durability: Kafka can handle bursty data and network hiccups, so systems remain decoupled but reliable. Scalable consumers: multiple processes (maintenance system, dashboard, etc.) can tap into the stream concurrently. | Complex to set up correctly (requires understanding of partitioning, consumer groups). Also, careful to avoid alert fatigue – streaming systems can generate lots of events. In GxP environment, decisions triggered by streaming data might still need human verification – often streaming just notifies humans promptly. | Common in modern factory IoT setups: e.g., Pfizer's continuous manufacturing lines might use Kafka to stream process parameters to monitoring systems. Pharma distribution centers use streaming to coordinate robotics and inventory updates. Not always talked about publicly, but part of Industry 4.0 initiatives many companies have. |
| Informatica / MDM | Integrating data from SAP (production planning, inventory) with shop floor systems and lab systems into the data lake/warehouse. Ensuring consistent naming of materials, suppliers across systems. Data quality enforcement (e.g., no missing values in critical fields). | Pre-built connectors: to SAP, Oracle EBS, etc., which save a lot of custom coding. MDM ensures one version of truth: e.g., a supplier code used in procurement matches the one in quality systems, avoiding analysis errors. Automation and scheduling: can run jobs to extract and load data at needed intervals with logging and error handling (important for reliability). | As with other cases, licensing and complexity – might be heavy for smaller operations. Some newer cloud ETL tools (ADF, Glue) are alternatives but may not have the rich transformation capabilities. MDM projects can be lengthy to yield full benefit (need business buy-in to define master records). | High adoption: Manufacturing and supply chain IT traditionally relies on tools like Informatica for moving data. Eli Lilly and others have spoken about using Informatica to integrate and govern data from R&D through manufacturing. MDM is typically used for domains like material master, customer, supplier to support ERP and analytics consistency. |
Manufacturing and supply chain in pharma is an area where operational efficiency gains directly impact the bottom line (and public health, when it comes to ensuring medicine availability). Thus, the use of big data tech here often focuses on predictive and preventive analytics (to avoid problems before they happen) and on end-to-end visibility (breaking data silos between production, quality, and distribution). A data engineer's solutions need to be robust (24/7 operations), often real-time, and well-integrated with legacy systems. The table above shows that a combination of streaming + NoSQL for real-time, big data frameworks for deep analysis, and graph/AI for complex pattern discovery is becoming the norm in advanced pharma operations (what some call Pharma 4.0, mirroring Industry 4.0).
Sales and Marketing Analytics in Pharma
Pharma companies also leverage big data in commercial operations – analyzing sales data, market research, patient and prescriber data, and marketing campaign performance. While this may seem less "big data" than scientific or IoT data, the volume can still be huge (prescription data for millions of patients, sales rep activity logs, etc.). Moreover, new data sources like social media or digital engagement (webinars, emails) add to the variety. The use cases include sales force optimization, marketing ROI analysis, Key Opinion Leader (KOL) identification, and patient journey analytics. Data privacy is crucial here (handling patient or HCP data must respect regulations like HIPAA and GDPR), and integration of data from third-party vendors (like IQVIA prescription data or Veeva CRM data) is often needed.
Key technologies and approaches:
-
Cloud data warehouses (Snowflake, Redshift, BigQuery) for sales data integration: Commercial data often comes in structured forms – e.g., monthly sales by geography, physician prescribing data, etc. These are well-suited for a traditional data warehouse model. Snowflake is commonly used to aggregate data from various sources such as CRM systems (Veeva CRM is widely used in pharma sales), marketing automation tools, and external datasets. Snowflake's ability to easily ingest semi-structured data is useful if dealing with JSON from APIs (for instance, pulling in data from a digital marketing platform). Also, Snowflake's data sharing and marketplace features can be a differentiator – pharma can directly access data from vendors via the Snowflake Data Marketplace (for example, Snowflake touts making "live and ready-to-use" health data available). This simplifies integrating things like claims data or formulary data. AWS Redshift is similarly used, often as part of an AWS-centric pipeline (data coming into S3 from various sources, then copied to Redshift for analytics). Redshift or BigQuery might be chosen by organizations that want to leverage integrated analytics with other services (BigQuery with Google Analytics data for tracking website or search trends relating to their drugs). In summary, the warehouse forms the central repository where all sales, marketing, and third-party data is joined and made available for querying by data analysts to get insights such as regional sales trends, segmentation of prescribers, or correlation between marketing efforts and sales uptick.
-
Informatica and MDM for customer data: Pharma companies often implement Master Data Management for HCP (Healthcare Professionals) and HCO (Healthcare Organizations) data. This is because multiple data sources (sales logs, medical conference attendees, prescription data feeds) might refer to the same doctor in slightly different ways. Informatica (or similar MDM solutions) helps create a golden record for each HCP, which is essential for accurate analytics (e.g., you want to attribute all sales calls and prescriptions to the right doctor profile). Similarly, product master data (especially if a company has complex product hierarchies or different product presentations) is mastered. Informatica's MDM and data integration tools therefore underpin a lot of the sales data warehouse population – ensuring that dimensions like "Doctor" and "Hospital" are clean and de-duplicated. Data governance is also key because commercial data could include personal information (HCP contact details, etc.), so data lineage and privacy compliance (like marking which doctors opted out of communications) must be managed.
-
Graph databases for marketing and KOL analysis: One cutting-edge area in pharma sales analytics is understanding networks – how physicians refer patients to each other, the influence network among HCPs, or how information spreads. Graph technology is highly valuable here. For example, TigerGraph published a case where they helped a pharma (Amgen) map the patient journey and referral network: by linking patients to prescribers and prescribers to specialists they referred to, and overlaying claims data, they could identify referral patterns. Traditional SQL struggled with this because it required many complex joins across large tables (patients, claims, providers), taking hours or days, whereas a graph database pre-connected the data so queries became much faster. In the Amgen example, their original graph database (likely Neo4j or similar) ran into scalability issues with the data size, so they moved to a more scalable graph solution – TigerGraph touts itself as the "world's fastest graph analytics platform" and is designed for such heavy workloads. By using TigerGraph, they were able to load large claims datasets and run queries to find communities of physicians or identify key referral hubs in a reasonable time. Neo4j is also used frequently for KOL (Key Opinion Leader) analysis: companies build knowledge graphs of experts linking publications, clinical trials, and affiliations. Neo4j can then be queried to find, say, which researchers are most central in a given disease area network (based on co-authorship or clinical trial involvement). This helps marketing teams identify whom to engage for advisory boards or education. Graph algorithms like PageRank or community detection can rank influencers or group prescribers into communities.
-
Hadoop/Spark for large external data sets: Sometimes analyzing sales and epidemiological data calls for processing large external datasets – for example, large medical claims databases or population health datasets. Spark can be used to filter and aggregate these before bringing summary results into a warehouse. Also, if doing more advanced analytics like combining social media sentiment data with sales trends, a Spark job might ingest tweets or forum data and perform sentiment analysis at scale. Spark could also be used for building predictive models, like predicting which doctors are most likely to adopt a new drug (taking into account many features). The training of such models on tens of thousands of doctors with many data points (prescribing history, engagement history, etc.) could be distributed with Spark. Once the model is trained, the predictions per doctor can be loaded into the warehouse for sales reps to use.
-
Snowflake/BigQuery for real-world evidence (RWE): Although more medical than sales, increasingly commercial teams are interested in real-world usage patterns of drugs. Cloud platforms make it possible to host large RWE datasets (like insurance claims or EMR records) and query them directly for insights like medication adherence or comparative effectiveness. BigQuery has been used by some to query large de-identified claims data because of its ability to handle huge tables with ease. Snowflake, via its Data Exchange, sometimes directly provides access to such data through partners. These analyses inform both marketing strategy (understanding how patients use the product in reality) and medical affairs.
-
Veeva Vault (PromoMats): The user list includes Veeva Vault but likely with focus on regulatory/quality. For sales and marketing, the relevant Veeva product is Vault PromoMats (for managing promotional materials and ensuring compliance in their content). While not a big data tool, data engineers might integrate data from PromoMats (like how many promotional pieces are approved or being used) into overall marketing analytics. But it's a minor point compared to the others.
-
BI and visualization: Although not a backend tech, it's worth mentioning that tools like Tableau, Power BI, or Qlik are heavily used to interface with the data. These allow sales operations and marketing folks to slice and dice data themselves once the data engineering team has the warehouse or data mart set up.
Example: A pharma's commercial analytics team wants to optimize their marketing spend and improve sales targeting. They gather data from: sales recorded in their ERP, call logs and CRM data from Veeva CRM, prescription data purchased from IQVIA (which shows which doctors are prescribing their drug and competitors), and digital campaign data (email opens, website visits). They use Informatica to ETL much of this into a Snowflake warehouse. Informatica's MDM ensures that "Dr. John A. Smith" in one dataset and "J.A. Smith" in another are recognized as the same person. In Snowflake, they now have tables for HCP (doctors), their profile (specialty, location), sales calls, prescriptions, and engagement data. Analysts can run SQL queries or use Tableau to identify, for example, deciles of prescribers by volume or to see how engagement correlates with prescribing changes. Meanwhile, the data science subgroup exports some of this data to run a Spark job where they train a model to predict which doctors are likely to start prescribing a new drug for diabetes. They include features such as past prescribing of similar drugs, attendance at company events (from Veeva data), and patient population characteristics in their area. Spark handles the large training set (perhaps millions of rows if each data point per doctor per quarter is considered). The model outputs a scored list of doctors. They feed this back into Snowflake, and from there the sales reps get a list of high-priority doctors to educate about the new drug.
Separately, the marketing team is trying to improve their multi-channel campaign. They use TigerGraph to analyze the network of physicians in their field. They load a graph with nodes for physicians and edges if they share patients (in claims data, one doctor refers or a patient of one sees another). They run a community detection algorithm and find clusters of physicians. They identify key "hub" doctors who connect many others – these might be local opinion leaders. Marketing then tailors outreach by focusing on those hubs, hoping influence will spread through the community. TigerGraph's fast query allows them to simulate removal of a hub (if that doctor is engaged, how many others indirectly might follow) much quicker than trying to do similar analysis in SQL. They also run an algorithm to identify the shortest path in the graph between any two doctors – useful if they want to see how information might flow or how far apart two prescribers are in terms of network (in case they want to ensure broad reach of message). All of this graph insight is then used to refine their marketing strategy, such as inviting the hub doctors to a special advisory webinar.
Comparison: Technologies for Sales & Marketing Analytics
| Technology | Role in Pharma Sales/Marketing | Strengths | Challenges |
|---|---|---|---|
| Snowflake / BigQuery / Redshift | Central data warehouse for all commercial data – sales figures, prescription data, CRM interactions, marketing touchpoints. Enables unified analytics and reporting. | Excellent at joining disparate data quickly (e.g., linking sales to marketing spend). Scales to large data (Snowflake/BigQuery handle billions of rows of RX data). Snowflake's Data Marketplace provides easy access to third-party data (claims, etc.). BigQuery can integrate with Google Ads/Analytics data if digital marketing is big. These platforms have built-in security roles to protect sensitive personal data (with tokenization or secure views for HCP data). | Need robust processes to continuously update data (some sources update monthly, others daily, etc.). Data privacy: even with encryption, analysis might require data to be aggregated or de-identified (especially if patient-level data is brought in). Redshift requires more tuning for performance compared to Snowflake/BigQuery. Also, data licensing: when bringing in third-party data into a warehouse, must ensure compliance with data use agreements. |
| Informatica & MDM | Integration of multiple source systems and mastering customer data (doctors, hospitals, payers). Ensuring clean and consistent data for analysis (e.g., one unique ID per physician). | Proven connectors for CRM (there are pre-built connectors for Veeva CRM or Salesforce), databases, flat files from vendors. MDM ensures single customer view, critical for accurate targeting and attribution. Helps comply with privacy regs by tracking consents/preferences at master record level. | Implementation can be time-consuming – matching and merging HCP records from various sources can be complex (names, addresses might differ slightly). Must constantly maintain reference data (e.g., if a doctor moves or two practices merge). If not configured well, could produce false merges or fail to merge when should. But given pharma's heavy reliance on such data, the effort is usually justified. |
| Graph DB (Neo4j, TigerGraph) | Modeling relationships between prescribers, patients, products, and influence networks. Used for Key Opinion Leader (KOL) identification, referral network mapping, patient journey mapping (connections from diagnosis to treatment). Also used to detect communities in prescription data (which doctors behave similarly). | Graph queries make complex network questions answerable (e.g., find the "influencers" among doctors: those with many connections). Graph algorithms (PageRank, centrality) can rank influencers in a way that correlates with real-world influence. TigerGraph can handle very large claim graphs quickly, which is useful if mapping an entire country's referral network from claims. Results of graph analysis give competitive edge – e.g., target not just high prescribers, but well-connected prescribers who can drive others' behavior. | Data availability: building a full graph might require access to detailed claims or patient data that not all companies have (they often have to buy partial data). Graph results need interpretation – just because Doctor A refers to Doctor B doesn't automatically mean A influences B's prescribing (there is domain nuance). Integrating graph output back into sales strategy requires change management (getting reps to utilize network insights, which might be new to them). Technically, TigerGraph usage might need training as GSQL query language is different; Neo4j's Cypher is easier but Neo4j might strain under very large datasets (leading to needing things like memory tuning or splitting graphs). |
| Spark / Hadoop | Big-scale crunching of external or raw data: e.g., processing a 100 million row medical claims dataset to extract metrics, or joining large patient-level datasets for outcomes research supporting marketing claims. Also used for advanced modeling (response modeling, churn modeling) that needs to read a lot of data. | Handles volume and variety – can combine log files (web logs), text (transcripts from rep visits), and structured data in one pipeline. Good for feature engineering on large datasets for ML models (like computing rolling averages, lags, across huge time-series of sales). Spark can also apply algorithms like k-means clustering on large prescriber datasets to do segmentation that would be hard to do in SQL. | Might be overkill for moderate data sizes (some commercial datasets might fit in a warehouse). Requires data science expertise – many sales ops teams historically rely more on Excel and SQL; moving to Spark/ML is a skill jump. Also, governance: any model that influences targeting must be validated to avoid bias or regulatory issues (e.g., fair targeting). As big data tools are applied, ensuring that, say, promotional decisions aren't inadvertently discriminatory or in violation of compliance (there are rules on how pharma can promote products) is important – those rules must be baked into what data is considered and how. |
| Power BI / Tableau (BI layer) | (Not in list, but output layer) Creating dashboards and reports for sales reps, managers, marketing teams. For instance, a tablet dashboard for reps showing their territory performance vs target, or a marketing dashboard showing campaign performance. | Modern BI tools connect directly to Snowflake/Redshift etc., and can handle fairly large data with proper design (aggregations, extracts). They provide interactivity, filtering by region/product, etc., which business users expect. Some allow row-level security so each sales rep only sees their own territory (important for confidentiality). | Visualizing extremely large data detail can be slow – often pre-aggregations are needed. Also, a cluttered or poorly designed dashboard can mislead; data engineers and analysts must ensure metrics are defined consistently (e.g., what exactly counts as a "new prescription") or misinterpretation can occur. This is more a people/process issue, but relevant to outcomes of these tech. |
Sales and marketing analytics in pharma has to balance scale and compliance with actionable insights. Tools like warehouses and MDM ensure a strong data foundation; big data and graph analytics provide deeper insights (like network effects and predictive power); and ultimately the insights have to feed user-friendly tools for decision-makers (sales reps, marketing strategists). The success of these technologies is measured by faster and more informed decisions: e.g., identifying the right physicians to educate about a new therapy, allocating marketing budget to the most effective channels, or tailoring patient support programs based on real-world usage patterns. In recent years, the commercial side of pharma has aggressively adopted cloud data platforms and advanced analytics, recognizing that as medical innovation yields more targeted therapies, the data-driven targeting of customers (physicians and patients) also needs to become more precise and smart.
Each of the big data technologies discussed plays a distinct role across pharma use cases, and often they are used in combination rather than isolation. For a data engineer in the pharmaceutical industry, understanding these tools' strengths – whether it's Hadoop's ability to store petabytes of raw data, Spark's power in crunching complex computations, Cassandra's speed with IoT streams, MongoDB's flexibility, Snowflake/Redshift/Synapse's analytic ease, graph databases' insight into relationships, Veeva's compliance-ready content management, Informatica's integration and data quality, or DNAnexus/BaseSpace's domain-optimized platforms – is crucial to designing effective data pipelines and systems. The table below summarizes a high-level comparison of the technologies by some key attributes across these use cases:
High-Level Technology Comparison
| Technology | Scalability | Performance (for intended tasks) | Integration Ease | Compliance Features | Real-World Adoption (Pharma) |
|---|---|---|---|---|---|
| Hadoop (HDFS/Hive/HBase) | Linear scalability with commodity hardware (good for multi-PB on-prem storage). | Great for batch throughput; can ingest/process enormous files but high latency for queries. Hive gives SQL interface but not interactive speed (seconds to minutes). HBase good for millisecond-range gets by key. | Requires heavy lifting to integrate (Java APIs, etc.), but has broad ecosystem (Kafka, Spark, etc.) to connect with. Not plug-and-play, but very flexible for custom pipelines. | Security via Kerberos, Apache Ranger for access control; entirely in company's control (important for those avoiding cloud). However, validation of a Hadoop environment can be complex. | Formerly high (many pharma had Hadoop clusters for R&D data). Now many are transitioning to cloud storage/compute but some still use Hadoop for internal big data lakes. |
| Apache Spark | Highly scalable (especially on clusters with ample RAM/cores; can also scale on cloud by adding nodes dynamically). | Fast in-memory processing for large-scale transforms, iterative algorithms. Excellent for ML on big data. For small data or simple queries, overhead makes it slower than a dedicated DB. | Integration-friendly: supports Java, Scala, Python, R APIs. Connectors to all common data sources (HDFS, S3, JDBC, Kafka...). Often embedded in services (Databricks, EMR) which ease integration with cloud storage. | No inherent compliance module – relies on the environment (can integrate with Hadoop security or run in a HIPAA-compliant cloud environment). Logging and audit need custom setup. | Very high in R&D (genomics, analytics) usage; growing in manufacturing analytics; moderate in commercial analytics. Often behind the scenes in many pharma data science workflows. |
| Cassandra | Massive write scalability; adding nodes increases capacity and throughput linearly. Can span multiple data centers for geo-redundancy. | Optimized for fast writes and reads by primary key (sub-second). Handles high transaction volumes (millions of inserts per second possible with enough nodes). Not built for complex joins or full-table scans (performance degrades for those). | Provides drivers for many languages; integrates with Kafka (sink/source). But it's a NoSQL system – applications have to be designed around its data model. No ad-hoc querying without knowing keys. | Has features like encryption at rest, and can enforce role-based access. Audit logging not native but can use TLP (third-party). Being often self-hosted, compliance is manual. (Some managed services offer certifications.) | Used in pharma mainly for specialized needs: IoT in manufacturing, some real-time tracking systems. Not as broadly used as relational or Hadoop, but chosen for specific high-volume use cases. |
| MongoDB | Good horizontal scaling via sharding, though needs careful shard key design. Modern versions and Atlas (cloud MongoDB) can scale to many TBs with clustering. | Very good for query performance on JSON/document data with appropriate indexes. Not as fast as Cassandra for raw writes, but more flexible querying. Suitable for moderate big data (billions of docs). | Easy for developers (schemaless JSON storage, simple query language). Integrates with many ETL and BI tools via connectors. MongoDB Atlas automates a lot of integration (with AWS, etc.). Lacks built-in cross-document joins – need to handle in app or use aggregation framework. | Offers enterprise security features: authentication, encryption, auditing. MongoDB Atlas is HIPAA-certified. On-prem, needs to be configured for compliance. Supports SQL-style permissions. | High usage in clinical data and real-world data stores where structure is evolving ([7]). Also used for content management (some use it as a base for document stores). Many pharma internal apps use Mongo for its developer speed, then feed a warehouse for analytics. |
| Snowflake | Virtually unlimited, thanks to decoupled storage & compute on cloud object storage. Can scale compute clusters up# Big Data Technologies in Pharma: Use Cases, Implementation, and Comparisons The pharmaceutical industry generates vast and diverse datasets – from genomic sequences and clinical trial results to regulatory documents, safety reports, and supply chain logs. Data engineers in pharma must choose appropriate big data technologies to store, process, and analyze this information at scale. This report explores key technologies – Hadoop (HDFS, Hive, HBase), Apache Spark, Cassandra, MongoDB, Snowflake, AWS Redshift, Azure Synapse Analytics, Azure Data Lake, Google BigQuery, Neo4j, TigerGraph, Veeva Vault, Informatica, DNAnexus, and Illumina BaseSpace – and how they are applied across major use cases. Each section focuses on a specific use case (e.g., genomics data analysis, clinical trials, regulatory management, pharmacovigilance, manufacturing and supply chain, sales and marketing analytics), detailing the technologies commonly used, their technical implementation, distinguishing features, and concrete examples. Comparisons are provided in tables for attributes like scalability, cost, performance, integration ease, compliance, and adoption, to help data engineers evaluate solutions. |
Genomics Data Analysis and Bioinformatics Pipelines
Genomic and multi-omics data analysis in pharma involves processing massive sequencing outputs (DNA/RNA reads, variant files) and integrating results for drug discovery or precision medicine. Key challenges include scalability (handling petabytes of sequencing data), processing speed (aligning reads or calling variants on thousands of genomes), flexible analysis pipelines, and compliance (handling potentially identifiable genetic data securely). Data engineers leverage a mix of on-premises big data frameworks and specialized cloud platforms:
-
Hadoop Distributed File System (HDFS) for large-scale storage: Genomic files (FASTQ, BAM, VCF, etc.) are often enormous. HDFS provides distributed storage across clusters, making it feasible to store and access terabytes of sequence data in parallel. For example, biomedical research projects have utilized Hadoop to manage large volumes of NGS data and clinical results ([1]). Apache Hive (SQL-on-Hadoop) can be used to structure genomic variant data in tables for query, and HBase (Hadoop's NoSQL store) can enable fast random access to genomic data (e.g. keying by gene or variant ID) in big genome annotation datasets. While Hadoop's batch-oriented MapReduce model was historically used (e.g. early tools like Crossbow for sequence alignment), modern pipelines have shifted to more efficient in-memory processing.
-
Apache Spark 4.x for distributed computing: Spark is a general-purpose cluster computing engine ideal for iterative algorithms and large-scale analytics. Apache Spark 4.0, released in 2025 with contributions from over 400 developers across organizations like Databricks, Apple, and NVIDIA, brings significant advancements including SQL scripting with session variables, VARIANT data type support, enhanced PySpark with native plotting API, and Python Data Source API for custom data sources ([2]). In genomics, Spark accelerates variant analysis pipelines by parallelizing tasks across cores or nodes. Spark is embedded in tools like GATK4 from the Broad Institute, where "Spark" versions of variant callers (e.g. HaplotypeCallerSpark) allow processing a genome across a cluster, drastically reducing runtime. Importantly, Spark can run on Hadoop clusters (using YARN) or in cloud-managed environments (Databricks, Amazon EMR, Google Dataproc). ADAM and Hail are examples of genomics frameworks built on Spark, enabling scalable analysis of genomic variants and genotypes. The in-memory computing of Spark yields performance gains over Hadoop MapReduce. Spark 4.0's enhanced Spark Connect architecture enables lightweight clients (1.5 MB vs 355 MB for full PySpark) to connect remotely to Spark clusters, and the new transformWithState operator improves arbitrary stateful processing for streaming workloads.
-
Cloud Data Warehouses (Snowflake, BigQuery, Redshift) and Databricks for multi-omics integration and analysis: While Hadoop/Spark handle raw data processing, cloud data warehouse and lakehouse platforms excel at aggregating results and enabling interactive analytics on genomic data combined with other data (clinical phenotypes, compound libraries, etc.). Snowflake has emerged as a powerful option for bioinformatics data warehousing with approximately $66.5 billion market cap on roughly $3.84 billion in trailing twelve-month revenue as of 2025. Snowflake's multi-cloud architecture and near-zero maintenance appeal to pharma R&D – it runs on AWS, Azure, or GCP with a unified experience, avoiding vendor lock-in. In 2025, Snowflake spent $250 million to acquire PostgreSQL vendor Crunchy Data to strengthen AI capabilities, and is developing an open standard for semantic definitions to support agentic AI analytics. Databricks reached a $100 billion valuation in mid-2025 with $3.7 billion annualized revenue, growing at nearly double Snowflake's rate (50% vs 26%) and spent $1 billion on Neon (PostgreSQL) to enhance GenAI solutions. Both platforms now offer support for Model Context Protocol (MCP) servers for AI processes. Meanwhile, Google BigQuery is leveraged for large genomic datasets with native support for public genomic data like TCGA and integrates with Google's AI/ML tools (TensorFlow, Vertex AI). Amazon Redshift is often chosen for AWS-centric infrastructure, with RA3 nodes offering managed storage. In practice, pharma companies stage genomic data files in cloud data lakes (S3 or Azure Data Lake) and use external tables or services like Redshift Spectrum or Synapse to query them.
-
NoSQL and graph databases in genomics: Though less common than in other use cases, certain genomic applications use NoSQL stores. For example, MongoDB can store experiment metadata or gene annotation JSON documents. If a project requires rapid queries by gene or variant ID, a key-value store like HBase or DynamoDB could be employed. Graph databases like Neo4j appear in drug discovery knowledge graphs (linking genes, diseases, compounds), which we discuss later, but they can also capture gene interaction networks or pathway data relevant in genomics. These allow researchers to traverse relationships (e.g., find connections between a gene variant and known drug targets) which is difficult with relational schemas.
-
Specialized Genomics Platforms: Many pharma companies use domain-specific platforms such as DNAnexus or Illumina BaseSpace for genomic data. DNAnexus is a cloud-based bioinformatics platform where users can run end-to-end NGS pipelines, perform variant analysis, and manage datasets collaboratively. It is designed to handle population-scale genomics – as of 2025, DNAnexus supports more than 60,000 registered users across 48 countries and actively manages over 125 petabytes of complex clinical, genomic, proteomic, and other multi-omic datasets ([3]). In August 2025, DNAnexus enhanced its leadership team with Pieter De Leenheer as CTO and launched the GenAI-powered Omics Data Assistant for accelerating discovery. It provides a secure, compliant environment (HIPAA, CLIA, GDPR compliant) with workflow languages (WDL, Nextflow) and versioned apps. DNAnexus has also integrated NVIDIA NIM and CUDA-X microservices to accelerate drug discovery through GPU-powered analytics. Illumina BaseSpace Sequence Hub is another such platform: it connects directly to Illumina sequencing instruments to stream data to the cloud, then offers storage, analysis apps (including Illumina's DRAGEN pipelines), and sharing capabilities. In May 2025, Illumina launched DRAGEN v4.4, introducing powerful innovations for genomic and multiomic analysis including new oncology applications for Heme WGS, Solid WGS tumor-normal, and streamlined Minimal Residual Disease (MRD) pipelines, along with a 30% improvement in germline structural variant calling accuracy ([4]). The platform now supports over 90 point-and-click genomic analysis apps. BaseSpace is engineered for regulatory compliance (ISO 27001, HIPAA) and high performance, with DRAGEN available via on-premises server, in the cloud, or directly onboard the NovaSeq X Series, NextSeq 1000/2000, and MiSeq i100 Series instruments ([5]). Illumina's 2025 5-base solution enables simultaneous detection of genomic variants and DNA methylation from a single sample, marking a major advancement in scalable multiomic analysis.
Example: A pharmaceutical research team might sequence thousands of genomes in a drug discovery project. They could use Illumina sequencers streaming data to BaseSpace for initial alignment and variant calling (leveraging Illumina's optimized pipelines). The resulting variant data could be exported to a Snowflake data warehouse where it's combined with clinical data to identify genotype-phenotype correlations. Data engineers might use Spark on a Databricks cluster to perform a heavy compute task – e.g., joint variant calling or variant quality recalibration across all samples – reading from and writing to an Azure Data Lake. Once processed, summary tables (like variant frequencies, gene associations) land in Snowflake for analysts to query. If they need to cross-reference public knowledge (gene networks, literature), they might load data into a Neo4j knowledge graph that connects those variants to known pathways and publications, enabling complex queries (e.g., find any known drug targets in pathways affected by our top variant hits).
Comparison: Technologies for Genomics Data
| Technology | Scalability | Performance | Integration Ease | Compliance Features | Adoption in Genomics |
|---|---|---|---|---|---|
| Hadoop (HDFS/Hive/HBase) | High horizontal scalability (add nodes to store PBs). Suitable for on-prem or IaaS clusters. | Good for batch throughput; MapReduce slower for iterative tasks (Spark now preferred for speed). | Requires significant setup and expertise (Java, cluster management). Hive/HBase integrate with Hadoop ecosystem, but not plug-and-play. | Secure setup possible (Kerberos, Ranger) but heavy to validate. Full control of data on-prem can aid compliance if managed properly. | Historically high for large genomics (e.g., 1000 Genomes used HDFS). Usage now declining in favor of cloud services. |
| Apache Spark | Scales across cluster nodes; in-memory processing limits per-node memory needs but can spill to disk. | Excellent for large-scale data transforms and ML (much faster than MapReduce for many tasks). Utilizes memory for speed. | Flexible integration: runs on Hadoop, Mesos, Kubernetes, or cloud-managed platforms. Connectors for many data sources (HDFS, S3, JDBC, etc.). | No built-in compliance – depends on environment (can run on secure clusters or in HIPAA-compliant cloud). Fine-grained audit needs custom tooling. | Strong adoption in genomics analytics (e.g., GATK4 uses Spark). Widely used via Databricks, GCP Dataproc, AWS EMR for bioinformatics. |
| Snowflake | Near-infinite auto-scalability (compute clusters can be resized on-demand; multi-cluster warehouses handle concurrency). | High performance columnar engine; automatic tuning and result caching. Excels at complex SQL on large data. | Very easy integration: standard SQL, many BI tool connectors. Supports stages to load data from S3/Azure/GCS. Cross-cloud data sharing is unique. | Strong compliance: HIPAA-, GDPR-ready; can encrypt data, fine-grained access control. Can be validated for GxP use. Secure data sharing without copies. | Rapidly growing in pharma R&D. Used for multi-omics data warehouses (e.g., disease variant analysis and drug discovery use cases). |
| Google BigQuery | Massive serverless scalability (Google's infrastructure handles sharding/parallelism automatically). | Excellent at scanning huge datasets quickly; fully managed. May have slightly higher latency on very small queries due to overhead. | Easy via SQL. Integrates natively with Google Cloud Storage, and has public genomic datasets (TCGA, etc.) accessible. Standard ODBC/JDBC for tools. | Google Cloud is HIPAA-compliant; BigQuery has fine ACL controls. Data is encrypted at rest and in transit by default. | Used in large-scale genomics and health analytics (e.g., storing population genomics with built-in ML tools). Often chosen for AI integration (TensorFlow on data). |
| AWS Redshift | High scalability up to petabytes. New RA3 instances separate storage on S3 for virtually unlimited storage. Concurrency scaling adds clusters on demand. | Fast for analytical queries if tuned (distribution keys, sort keys). Spectrum enables querying S3 data directly. Slightly older architecture than Snowflake/BigQuery. | Good with AWS ecosystem: easy to ingest from S3, integrate with AWS Glue, QuickSight, SageMaker for ML. Standard SQL interface. | AWS offers HIPAA-eligible services; Redshift data encryption, VPC isolation available. Audit logging to CloudTrail. Often part of validated AWS environments. | Widely adopted by pharma on AWS, e.g., for aggregating clinical and genomic data in a warehouse. Some migrating to Snowflake for ease-of-use. |
| DNAnexus | Highly scalable cloud platform (built on AWS/GCP). Manages PB-scale data and complex pipelines with horizontal scaling in cloud. | Optimized for NGS pipelines – can spin up large compute clusters for heavy workloads. High throughput for file I/O to cloud storage. | Integration via APIs/SDKs and workflow languages (WDL, Nextflow). Can import from cloud buckets or instrument outputs. Less standard than SQL interfaces. | Designed for compliance: meets strict standards (audit trails, access control, HIPAA, GDPR) ([6]). Many pharma use it in validated environments for clinical genomics. | Moderate adoption: used by genomics initiatives (UK Biobank, precision medicine projects) and pharma needing turnkey NGS analysis. Growing as data volumes grow. |
| Illumina BaseSpace | Scales to many sequencers and large data volumes by leveraging Illumina's cloud. Storage scales with Illumina Cloud infrastructure. | High for Illumina's use cases (fast secondary analysis with DRAGEN hardware-accelerated pipelines either on-site or cloud). Not a general compute platform beyond provided apps. | Seamless for Illumina instruments. Limited integration outside Illumina ecosystem (APIs exist but primarily used with Illumina's own pipeline and analysis apps). | Built-in compliance: ISO 27001, HIPAA, GDPR compliance features. Data encrypted at rest and in transit, regional data centers for compliance needs. | High adoption in sequencing labs (many clinical genomics labs and biotech use it for ease-of-use). In pharma, often used in early research or clinical sequencing with Illumina. |
Why these distinctions matter: For genomics, a data engineer might use Spark on HDFS when performing a one-time heavy reprocessing of raw reads (leveraging existing on-prem clusters), then use Snowflake or BigQuery to warehouse the processed results for easy querying by scientists. If the team values a fully managed, end-to-end solution, they might lean on DNAnexus or BaseSpace to reduce engineering overhead, especially in clinical genomics where compliance is critical. The choice often depends on existing infrastructure and skills (e.g., an organization with strong AWS skills might combine S3 + Redshift + AWS Batch for genomics, whereas another might choose a cross-cloud Snowflake solution to avoid cloud lock-in).
Clinical Trials Data Management and Analytics
Clinical trial data is diverse – patient enrollment info, electronic case report forms (eCRFs), lab results, medical images, sensor data from wearables, and more. These data come from different systems (EDC – Electronic Data Capture, LIMS, hospital EMRs, patient apps) often in varying formats. A data engineer's goal is to integrate and curate trial data for analysis (to monitor trial progress, ensure data quality, or combine results from multiple trials). Key requirements include flexibility to handle semi-structured data, scalability to manage many studies or high-frequency patient data, and compliance with regulations (clinical data must be handled under GCP and 21 CFR Part 11 rules, requiring audit trails and access control).
Technologies commonly used in this domain:
-
MongoDB for flexible clinical data storage: Clinical trial datasets can be highly heterogeneous – different trials collect different variables, and protocols change over time. MongoDB's document model is well-suited for such evolving schemas. A trial's patient records can be stored as JSON documents, allowing new fields or forms to be added without altering a rigid schema. This flexibility was demonstrated by the FIMED project (a biomedical data management tool), which chose MongoDB as the core to manage clinical trial data for its schema-less design and ability to handle semi-structured data ([7]). MongoDB allows dynamic forms and varying data per patient, which would be cumbersome in a traditional SQL schema. Scalability is another reason – MongoDB can be clustered (sharded) across multiple servers, supporting large datasets and high throughput. In fact, MongoDB "has been designed to operate using a cluster configuration, making it a great choice if scalability… is required" in clinical trial data contexts ([8]). With proper sharding (e.g. by study or site), it can handle concurrent data ingestion from many trial sites. Data engineers also appreciate MongoDB's querying and indexing for semi-structured data, and its ability to store files (with GridFS) – for example, PDFs of patient consent forms or images can be stored alongside data.
-
Hadoop and Spark for large-scale trial data processing: When dealing with large aggregated datasets (e.g., a pharma company analyzing all past trial data for patterns), Hadoop and Spark come into play. HDFS might be used to store raw dumps of clinical trial data (CSV files, JSON logs, even PDFs), forming a clinical data lake. Apache Spark can then be used to clean and transform this data at scale – e.g., parsing millions of eCRF records or merging datasets for a meta-analysis. Spark's distributed SQL engine (Spark SQL) and DataFrame API let engineers join and filter big data sets from multiple trials efficiently. For instance, if ingesting data from a wearable device in a trial (say daily heart rate readings from hundreds of patients), Spark could process these time-series in parallel to derive summary metrics per patient. Spark is also useful for machine learning on clinical data – e.g., training a model to predict patient dropout using trial data.
-
Cloud Data Warehouses (Snowflake, Redshift, Synapse) for integrated analytics: After collecting and cleaning trial data, a common practice is to load it into a centralized data warehouse for analysis by statisticians and data scientists. Snowflake is often used to create a unified view of clinical data across studies – it can easily ingest structured outputs (e.g., CSV extracts from EDC systems or the results of Spark processing) and make them queryable with SQL. Analysts can then use BI tools or Python/R to query Snowflake for interim analysis, patient safety signals, etc. A concrete example is using Snowflake to ingest XML data from ClinicalTrials.gov (a public registry) and analyze it with a BI tool: one team demonstrated loading trial data (in XML) into Snowflake and then using ThoughtSpot for search/analytics on it. This highlights Snowflake's ability to handle semi-structured data (it has JSON and XML functions) and work with external analytics tools seamlessly. AWS Redshift plays a similar role for companies deep in the AWS stack – for example, a company might copy clinical data to S3 and use Redshift's COPY command or Spectrum to bring it into a warehouse. Redshift can then join clinical data with other operational data (finance, etc.) for comprehensive reporting. Azure Synapse Analytics is another contender, especially if data is already stored in an Azure Data Lake. Synapse can combine a data lake store (where raw data from devices or logs are kept) with a SQL analytics engine for curated datasets. Microsoft provides integration between Synapse and tools like Power BI for visualization. A case study described a pharmacy chain using Azure Synapse to unify inventory and supplier data for trials supply management, demonstrating Synapse's use in syncing and analyzing data in real-time for operational efficiency (e.g., ensuring trial sites have drug supply). In general, these cloud warehouses provide scalability (to handle many trials' data), good performance for complex analytical queries, and features like encryption and role-based access crucial for compliance (with fine-grained access so only authorized personnel see certain sensitive data).
-
Informatica for data integration and ETL: Informatica's Intelligent Data Management Cloud (IDMC) tools are widely used to extract, transform, and load clinical data from source systems into a central repository. In 2025, Informatica expanded with Product 360 for Life Sciences, built on the AI-powered IDMC platform with industry-specific configurations to help pharma companies manage product data for IDMP compliance – critical given that EMA introduced stricter enforcement with fines of up to 5% of annual revenue for non-compliance in 2025 ([9]). The Fall 2025 IDMC release introduced AI Agent Engineering enabling enterprises to build and manage customizable agents through a no-code interface, reducing development time from weeks to minutes. In February 2025, Informatica and ZS extended their life sciences partnership, combining IDMC with ZS's ZAIDYN platform for unified data fabric solutions. Informatica can pull data from EDCs (like Medidata Rave or Oracle Clinical) via connectors, apply transformations, and load into a warehouse or data lake. Master Data Management (MDM) from Informatica maintains a master list of investigators, trial sites, or patients to link data across systems. Pfizer's example of modernizing data integration – migrating to cloud-native integration using Informatica Intelligent Cloud Services with Snowflake, automating 99% of data mappings – continues to be a model for pharma digital transformation.
-
Graph databases for study relationships and metadata: Graph technology is emerging in clinical research to link disparate data and support complex queries, though it's not yet as common as the above tools. One novel use is modeling the connections between studies, investigators, sites, and outcomes as a graph. Neo4j or TigerGraph can be used to build a regulatory or clinical knowledge graph: nodes might be "Study", "Investigator", "Site", "Patient", etc., and edges capture their relations (participates in, enrolled in, etc.). This can help answer complex questions, like "which investigators have worked on similar trials?" or identify hidden patterns (like a network of sites with faster enrollment). Neo4j has been used at Novartis to ingest and connect the latest biomedical research for drug discovery, indicating its usefulness in linking trial data with external knowledge. In clinical operations, a graph could help ensure standards compliance by linking data elements to CDISC metadata (e.g., connecting each data field to a standard definition node), as discussed in an opinion on knowledge graphs helping meet standards like SDTM and ADaM. While graphs in clinical data management are still an emerging practice, they hold promise for integrating data silos and enabling exploratory queries across them.
-
Veeva Vault for clinical content and data: Veeva Vault is a cloud platform specifically built for life sciences, and while it is more a content/document management system than a "big data" engine, it is crucial in clinical trial operations data management. Vault provides applications like eTMF (electronic Trial Master File), CTMS, and Study Startup on a unified platform. Data engineers might not use Vault for heavy analytics, but they will integrate data from Vault (such as trial documentation status or site activation metrics) into warehouses for reporting. Vault's advantage is that it's pre-validated and compliant – it meets GxP requirements out of the box, with audit trails and role-based security. For example, Vault CTMS manages operational data about trial progress, and Vault EDC captures patient data – these systems can export data to a data lake or warehouse. The Vault Platform underneath is an object store and content management system that can scale globally (Veeva hosts Vault in the cloud with data centers in multiple regions). It can handle thousands of users and millions of documents, which is essential for large companies with dozens of products and global trials. Vault also provides APIs and integration hubs so that, for example, when a submission is approved, that information can flow to other systems (like manufacturing or ERP to trigger product launch). In terms of big data, Vault may not be about large-scale computation, but it is about centralizing authoritative data and content so it can feed analytics. Modern clinical data warehouses often ingest structured data (like enrollment metrics) from Vault to combine with other performance data.
Example: Consider a large Phase III clinical trial collecting data via an EDC system, a wearable ECG device, and lab test results from a central lab. A possible pipeline: Data engineers set up Informatica jobs to regularly extract new EDC data and lab data, using mapping rules to a common schema. This data lands in an Azure Data Lake as raw files. A scheduled Spark job (e.g., on Azure Synapse Spark pool or Databricks) cleans and combines these with wearable data (ingested via IoT pipelines into the Data Lake). The curated data (patient visits, adverse events, biomarker readings) is then loaded into Azure Synapse Analytics where a fact/dimension schema (data mart) allows fast analysis of, say, adverse event frequency by patient subgroup. Throughout, patient identifiers are consistent via an MDM system, and access is controlled. The clinical operations team also pulls data from Veeva Vault CTMS (via API or export) about site performance (enrollment numbers, queries, etc.), which is integrated into the warehouse. On Synapse or Snowflake, the company can run SQL analytics to identify sites with high query rates or to compare efficacy signals. They can also generate submission-ready datasets (CDISC SDTM/ADaM) by using these integrated data and ensure those outputs comply with standards. If they use a knowledge graph approach, they might also load the data relationships into Neo4j, linking the study, patients, drugs, and outcomes, enabling complex queries like "find all trials where a similar adverse event profile was observed for drugs targeting the same pathway."
Comparison: Technologies for Clinical Trial Data
| Technology | Strengths in Clinical Data Use Case | Weaknesses/Considerations | Example Usage & Adoption |
|---|---|---|---|
| MongoDB (document DB) | Extremely flexible schema – can handle evolving case report forms. Scales out with sharding for large multi-trial data. Fast query performance on JSON data with indexes. Developers can iterate quickly without schema migrations ([7]) ([8]). | Lacks built-in analytics (no JOINS across collections like RDBMS; though aggregation pipeline is powerful). Complex transactions are limited (usually OK for logging trial data). Requires careful data modeling to avoid inconsistent entries. | Used in platforms for managing trial data with flexible forms (e.g., storing patient records and eCRFs). Sanofi's translational medicine platform reportedly uses MongoDB to unify research and clinical data (for its flexibility). Many startups use Mongo for healthcare apps that need quick iteration, then push to a warehouse for analysis. |
| Hadoop & Spark | Ideal for batch processing of large trial datasets (combining data from many studies or processing high-frequency data like wearables). Spark provides fast in-memory computation for tasks like data cleaning and ML on patient data. Hadoop (HDFS) can store raw, unstructured dumps cost-effectively. | Hadoop ecosystem has steep learning curve; not typically used by clinical ops teams, so data engineers must bridge gap. Batch processing means results are not real-time. On-prem Hadoop may face validation hurdles. Spark jobs need to be monitored for failures in pipelines. | Employed by organizations doing secondary analysis on aggregate trial data. E.g., using Spark to process a million records from a long-term outcomes study overnight. Hadoop clusters were used historically to store large clinical datasets, though cloud data lakes are now more common. |
| Cloud Warehouse (Snowflake/Redshift/Synapse) | Provides a unified, performant analytics environment. Handles structured trial data at scale, enabling complex SQL (joins between patient, site, drug tables). Easy connectivity to BI tools for dashboards (e.g., enrollment metrics, safety signals). Security and role management to restrict sensitive data access (e.g., blinded data). Snowflake in particular simplifies maintenance (no indexing needed) and can ingest semi-structured data like JSON (for ingesting things like questionnaires). Synapse offers an end-to-end workspace (data ingestion, SQL, even Spark in one platform) which is convenient for Azure-based pharma. | Primarily for structured/processed data – raw unstructured inputs often need pre-processing before loading. Cost can grow with very large data or complex queries (engineers must optimize load and query patterns). Redshift requires choosing distribution keys and may need tuning as data volume grows. Synapse and Snowflake both require careful data partitioning for very large tables to maintain performance. | High adoption: Nearly all large pharma have a data warehouse for clinical data. Snowflake is increasingly popular for cross-trial data marts and sharing data with partners. Companies in AWS use Redshift or are migrating to Snowflake for trials. Azure-focused companies use Synapse (e.g., as the basis of modern data warehouse for trial and real-world data at Novartis or Novo Nordisk). |
| Informatica (ETL/MDM) | Excellent for integrating multiple data sources – connectors for clinical databases (e.g., Oracle Clinical), flat files, wearables, etc. GUI-based data mapping is auditable and can be reused for each trial. Informatica MDM can maintain golden records for key entities (patients, investigators) to de-duplicate and link data across systems. Offers data quality tools (to validate ranges, codes) which is critical for clinical data cleaning. | Enterprise cost can be high. Setting up mappings initially is time-consuming (but pays off over time). Cloud-based alternatives (like Azure Data Factory or AWS Glue) exist and might suffice for simpler pipelines. Needs integration with source system APIs or DBs which might require IT involvement. | Very high adoption in pharma: e.g., Takeda and Pfizer modernized their data pipelines with Informatica to handle clinical and commercial data integration. Often, legacy ETL for trials is built in Informatica PowerCenter (on-prem) and gradually shifting to Informatica Cloud or similar. Used to populate data warehouses and also feed operational dashboards. |
| Neo4j / Graph DB | Captures relationships that are hard to see in tables – e.g., linking investigators to trials to publications, or patients to all their treatments and outcomes in long-term studies. Enables complex traversals: "find trials with similar eligibility criteria to mine" or "which sites have overlapping investigators?" Graphs can also link data to standards nodes (CDISC), aiding metadata-driven automation. | Not traditionally used for core trial data analysis (which relies on statistics and set operations more than graph traversal). Adds an extra technology that requires graph modeling expertise. Performance could suffer if naively used for very large graphs (TigerGraph might handle larger scale). Potentially redundant if relational approach suffices for the problem. | Emerging adoption: Some pharma R&D teams experiment with knowledge graphs for integrating research and trial data. Regulatory informatics teams might use graphs to map relationships between regulations, studies, and filings. Still relatively niche compared to mainstream relational approaches. |
| Veeva Vault (Clinical) | Purpose-built for managing clinical operations data and documents. Vault's CTMS, eTMF, etc., unify trial management processes with built-in compliance. It ensures audit trails and Part 11 compliance with minimal configuration. Scales to enterprise (global trials across many sites). Integration via Vault API allows pulling structured data (like study statuses) into other systems. Using Vault dramatically reduces the need for custom-built solutions for trial documents and site management. | Vault is primarily an operational platform – its built-in reporting provides streamlined analytics with options to extend via Veeva Nitro for deeper insights, so teams often export data for advanced analysis in dedicated tools. As a managed SaaS, access is through Veeva's interface or API, which simplifies administration while ensuring compliance. Data engineers mostly consume data from Vault and integrate it into their analytics pipelines. | Very high adoption in pharma for trial management content – top pharma companies use Vault eTMF and CTMS. For data engineers, Vault is a source of truth for certain data (like milestones, document completion) which they integrate with performance dashboards. Vault's presence ensures any solution they build must interface well with it (often via API or flat file exports). |
In summary, clinical trial data management benefits from a hybrid approach: NoSQL (MongoDB) for flexibility at the data capture stage, ETL tools (Informatica) for integration, big data tools (Spark/Hadoop) for heavy lifting on raw data, and cloud warehouses for serving curated data to analysts. A critical consideration is always compliance: these systems must maintain patient privacy (often using de-identified IDs) and provide audit logs for any data changes, which is why specialized systems like Veeva Vault and careful data governance with tools like Informatica are so prevalent.
Regulatory Data Management and Compliance
Pharmaceutical companies must manage vast amounts of regulatory data and content: submission dossiers (hundreds of PDF documents like study reports, manufacturing details), health authority correspondence, product registration data across countries, and internal compliance documentation. Unlike other use cases, regulatory data is often more document-centric (unstructured or semi-structured content) and requires strict version control, traceability, and security (to comply with FDA, EMA regulations and GxP quality guidelines). Data engineers focus on ensuring that this content and associated metadata can be stored, retrieved, and linked efficiently, and that data flows (for example, between regulatory and clinical systems) are integrated.
Key technologies and approaches:
-
Veeva Vault (Regulatory Information Management): Veeva Vault is a cornerstone in many pharma regulatory IT landscapes. It provides applications for RIM (Regulatory Information Management), including modules for tracking product registrations, managing submission content, and archiving submission packages. Vault's Regulatory Submissions module, for instance, manages the assembly of submission content (like the CTD – Common Technical Document – sections) and can publish in formats like eCTD. What makes Vault stand out is that it's built for compliance and content management on a single platform, meaning it was designed to meet the performance and validation requirements of the life sciences industry from the ground up. Vault ensures that all documents are versioned, all user actions are audited, and that it meets 21 CFR Part 11 (electronic records/signatures) compliance. Data engineers might not manipulate Vault's internals (as it's a SaaS), but they will integrate it: for example, extracting metadata about approvals, or linking Vault content with data warehouses. Vault's underlying technology stack uses a NoSQL content store and an object-oriented data model that scales globally (Veeva hosts Vault in the cloud with data centers in multiple regions). It can handle thousands of users and millions of documents, which is essential for large companies with dozens of products and global operations. Vault also provides APIs and integration hubs so that, for example, when a submission is approved, that information can flow to other systems (like manufacturing or ERP to trigger product launch). In terms of big data, Vault may not be about large-scale computation, but it is about centralizing authoritative data and content so it can feed analytics. Modern RIM analytics involve pulling structured data (like lists of approved indications, or timelines for each submission) out of Vault and into a warehouse for metrics.
-
Relational and Data Warehouse solutions for regulatory data: While documents live in systems like Vault, the structured facets (e.g., lists of all global filings, status of each, commitment due dates, etc.) are often stored in relational databases or warehouses for reporting. For example, companies might use an Oracle or PostgreSQL database (sometimes part of older RIM solutions) to store registration data. Increasingly, they are moving this to cloud warehouses like Snowflake or Azure Synapse to integrate with other enterprise data. A data engineer might create a data mart of regulatory KPIs (e.g., time from submission to approval, number of pending queries by agency) by blending data from Vault (via exports) and other sources. The technology choice here is driven by the need for joinable, queryable data – hence SQL databases or warehouses are common. Snowflake's secure data sharing could even allow a scenario where a pharma company shares certain regulatory data with a partner (under strict controls) during a co-development project.
-
Hadoop/Spark for text mining of regulatory documents: Regulatory affairs departments increasingly use NLP and text mining on submissions and health authority feedback to glean insights (like identifying all documents where a particular risk is mentioned). For such use cases, big data frameworks come into play. A cluster using Hadoop or Spark can be employed to index and analyze thousands of PDF/XML documents from past submissions. For example, Spark with an NLP library can parse through narratives in clinical study reports to find key information requested by regulators. Hadoop's scalability allows processing large corpora of regulatory correspondence (which could be many gigabytes of text) in parallel. Data engineers might set up an index (Elasticsearch) for these documents, with an upstream Spark job populating it. While this is not yet ubiquitous, it's a growing area as companies realize the value of the unstructured data locked in their archives.
-
Graph databases for regulatory knowledge: Regulatory data is highly interconnected – a single drug product is linked to many submissions in different countries, which in turn link to commitments, variations, manufacturing sites, and so on. Representing this as a graph can be intuitive. Neo4j or TigerGraph can be used to build a regulatory knowledge graph: nodes might be "Product", "Submission", "Regulatory Authority", "Manufacturing Site", etc., and edges capture their relations (submitted-to, approved-by, supplies, etc.). This can help answer complex questions, like "Which approved products would be impacted if a particular manufacturing site's license is revoked?" by traversing the graph. Neo4j has been discussed as a way to model and query such regulatory networks for impact analysis. Additionally, linking regulatory data to external knowledge (like linking an indication approved in a label to published clinical evidence) is a kind of multi-relational query that graphs handle well. TigerGraph, with its emphasis on fast deep link analytics, could handle very large regulatory graphs (spanning all products and regions) if needed, ensuring performance for queries that might traverse many hops (e.g., through multiple levels of supply chain and approval relationships). However, these uses are still emerging – many companies rely on conventional databases and manual processes for regulatory tracking, but we foresee more graph utilization as data volume and complexity grow.
-
Informatica and data governance: In regulatory data, data quality and governance are paramount – a mistake in a submitted data point can be costly. Informatica's data quality tools might be used to validate structured regulatory data (e.g., ensure all required fields for a submission are present and follow the standards). Master Data Management could also apply: for instance, maintain a master list of global health authority IDs or a dictionary of standardized regulatory terms. Informatica is investing in industry-specific solutions (Informatica has an "Industry Data Bundle" for life sciences) that could ease managing things like controlled vocabularies. Ensuring consistency (such as using the same drug name across all submissions) is a place where these tools help.
-
Compliance features of cloud platforms: When regulatory data is moved to the cloud for analysis, ensuring the platform is compliant is a major consideration. Tools like Snowflake, Azure, AWS all have options for compliance (audit logging, data encryption, region locality). Azure's offerings like Azure Synapse and Azure Data Lake Storage are often configured in GxP-qualified environments for pharma. Data engineers might work with validation specialists to qualify these environments. For example, using Azure Data Lake to store regulatory data would involve setting up proper access controls (Azure AD integration, perhaps container-level access policies) to ensure only authorized regulatory personnel can access certain data. Compliance requirements also influence design: for instance, if using a data lake to store submission archives, one might need to implement retention policies and legal hold capabilities.
Example: A regulatory operations team manages all submission documents in Veeva Vault RIM. Every time they submit to FDA or EMA, the submission content (dozens of files) and metadata (submission date, approval date, etc.) are stored in Vault. A data engineering team sets up a nightly job to extract key metadata from Vault via the API – for example, an export of all submission records and their statuses. This data is loaded into a Snowflake table that accumulates the company's regulatory history. On Snowflake, they also integrate data from other sources: perhaps a spreadsheet of regulatory commitments (post-marketing study requirements) tracked by another team, or manufacturing changes from a quality system. By combining these, they produce dashboards that show, say, all upcoming regulatory milestones or how long approvals are taking in each region. Meanwhile, another use case: They want to leverage historic submission text to improve future ones. The engineers use Spark on an Azure Databricks cluster to perform NLP on hundreds of past reviewer reports (text documents) to see common deficiencies cited. They store the parsed text in an index for search, and also connect some data points (like product names, issues) in a Neo4j graph linking to the respective submissions. This graph might reveal, for instance, that multiple products had stability data questions from Health Authority X, indicating a systemic issue to address. Through all this, the data remains in secure environments: the documents stay in the controlled Vault repository (Spark might access them via secure API or a dump placed in a secure storage), and any cloud analysis environment is validated for regulatory use.
Comparison: Technologies for Regulatory Data Management
| Technology | Role in Regulatory Use Case | Differentiators and Compliance | Real-World Adoption |
|---|---|---|---|
| Veeva Vault (RIM) | Central platform for regulatory documents and data (submission content, product registrations, correspondence). Provides workflows for authoring, reviewing, and approving documents. Serves as the authoritative source for all submission dossiers and tracking data. | Differentiators: Purpose-built for life sciences – includes domain-specific features (e.g., eCTD structure management). Highly compliant: validated SaaS, Part 11-ready (audit trails, electronic signatures). Integrates content and data (the Vault platform links document records with structured fields like product, country, submission type). Scalable across global orgs. | Standard in industry: Most big pharma use Vault or similar (like Documentum-based systems) for regulatory. Vault's cloud nature and frequent updates have made it popular. Companies like Gilead, Boehringer Ingelheim, etc., have publicly adopted Vault for RIM. Data engineers often must pull data from Vault for reporting since it's the main source of truth. |
| SQL/Cloud Databases | Store structured regulatory metadata: product lists, country registrations, approval dates, commitments. Useful for reporting and analytics beyond the document-centric view. Often the backend of RIM tools or custom tracking databases. | Traditional RDBMS are reliable and well-understood, and can enforce data integrity (constraints, referential integrity) which is useful for critical reg data. Cloud warehouses (Snowflake, etc.) can hold this data and allow linking with other enterprise data (like sales, to correlate approvals with launch dates). They also offer robust security and can be partitioned by region for data sovereignty. | High adoption: Even with Vault, many companies extract to or maintain a relational store for cross-system joins. Some have legacy RIM on Oracle databases they now integrate with cloud platforms for analysis. Snowflake and Synapse are beginning to host regulatory data marts where teams analyze workload and performance metrics (e.g., number of submissions per year, agency query response times). |
| Hadoop/Spark (Text Analytics) | Applied to large collections of regulatory text (submission documents, labels, health authority queries) for insight extraction. Spark can distribute NLP tasks (e.g., finding all mentions of a certain term across thousands of pages) and enable analysis like clustering of review comments. | Allows leveraging big data techniques (NLP, ML) on unstructured data that was traditionally not analyzed at scale. This can reveal patterns or help in preparation of submissions (e.g., learn which issues regulators frequently cite). Spark's ability to use libraries (like spaCy or Spark NLP) and run in parallel is key for timely processing. | Implementation complexity – requires data scientists and engineers to prepare data and interpret results. Also, regulatory text is sensitive and often confidential, so this analysis must occur in secure environments. Emerging adoption: Big pharmas have begun pilot projects to analyze regulatory text using data science, but not yet mainstream. |
| Graph DB (Neo4j/TigerGraph) | Model complex relationships: product–submission–approval–manufacturing–variation networks. Helpful for impact analysis and connecting regulatory info with other domains (safety signals, manufacturing changes). For example, if a raw material is flagged by one regulator, a graph query can find all products and submissions globally that involve that material. | Graphs excel at interdependency analysis, which is crucial in regulatory change management. A graph query can quickly traverse multiple levels of relationships that would require recursive SQL. TigerGraph's performance allows analysis on very large, complex regulatory graphs (spanning all products and regions) with deep links. From a compliance perspective, graphs would be an internal tool; they'd need same access controls as other DBs if containing regulated data. | Limited but emerging: Some companies use Neo4j for pharmacovigilance (linking drug-event-case). For regulatory, a few have experimented with mapping their entire registration landscape as a graph for scenario planning. Not widespread yet due to complexity, but interest is growing as data becomes more interconnected and digitalized. |
| Informatica & Governance | Ensures data consistency and quality across systems – e.g., if a drug name or indication must exactly match between the clinical database and the submission, Informatica can enforce or reconcile it. Helps migrate legacy regulatory data into new systems (ETL). Data cataloging tools document data lineage (important for audit/inspection). | The strength is trust in data – using data quality rules to catch errors (like a missing submission date or a mismatch in country code). Informatica's governance aids compliance by providing lineage: one can show an inspector how data from a trial flows into a submission dataset. It also can automate data flows between systems (e.g., when a submission is approved, push that info to a manufacturing release system). | High adoption (indirect): While a regulatory user might not see Informatica, IT uses it behind the scenes. Pharma companies that migrated to Vault often used Informatica to load legacy data. Pfizer's integration of cloud data (with Snowflake) likely includes regulatory data moving with Informatica's help. Overall, Informatica is a trusted backbone for ensuring all these interconnected systems stay aligned. |
In regulatory data management, the emphasis is on single source of truth, traceability, and compliance. Technologies like Vault address these by providing a controlled environment for content, whereas data platforms (databases, warehouses) ensure the information can be analyzed and reported. The choice of technology leans more toward specialized platforms (Vault) and stable databases, with big data tools being used in supporting roles (e.g., text mining or linking data). A data engineer's challenge is often integrating these without violating compliance – for instance, if using Spark to analyze documents, one must be careful to not create unapproved copies of controlled documents. Thus, integration patterns (APIs, secure data lakes) and proper governance are as important as the tools themselves.
Pharmacovigilance and Drug Safety Analytics
Pharmacovigilance (PV) involves monitoring and analyzing data on drug safety – adverse event (AE) reports, side effects in clinical use, literature reports, and sometimes social media signals – to detect potential risks associated with pharmaceutical products. This domain generates large volumes of data (spontaneous reports like FDA's FAERS database contain millions of records) that are both structured (case report fields) and unstructured (narrative descriptions). Data engineers in PV work on ingesting diverse safety data sources, performing signal detection algorithms, and enabling queries to find correlations between drugs and adverse events. Important considerations are scalability (processing millions of records quickly), real-time or frequent analysis (for continual surveillance), and strong compliance/privacy (patient data in safety cases must be protected; PV data is subject to regulatory audits).
Key technologies and their use in PV:
-
Apache Hadoop and Spark for large-scale adverse event data analysis: Many pharmacovigilance teams have turned to big data frameworks to handle public and internal safety datasets. For example, the FDA's FAERS (Adverse Event Reporting System) data is publicly available and has grown substantially – as of Q2 2025, FAERS contains over 19 million background patients accounting for 57 million adverse event records ([12]). The FDA now receives over 1 million adverse-event and medication error reports annually, making it one of the largest pharmacovigilance databases in the world. Spark is highly suitable for crunching this data: open-source projects have used PySpark to ingest and analyze FAERS on HDFS. In one case, analysts built a Spark pipeline on Google Dataproc to transform FAERS data and apply disproportionality algorithms (like reporting odds ratios or a Bayesian approach) in minutes. This same task might take hours on a single machine. Spark's ability to distribute computations allowed using methods like the likelihood ratio test with Monte Carlo simulation to identify drug-event pairs that occur disproportionately. Similarly, Hadoop MapReduce has been used historically to count drug-AE co-occurrences and detect signals, although Spark is now preferred for its ease and speed. In addition to FAERS, companies ingest adverse event data from global sources (EudraVigilance, WHO VigiBase) and even from patient support call centers – these can stream into an HDFS or cloud data lake, then Spark jobs aggregate and analyze them regularly. HBase or Cassandra might also be used to store the processed safety signals for quick lookup (for instance, a wide-column store keyed by drug name containing a list of associated significant adverse events).
-
NoSQL for case management systems: The primary PV case processing systems (like Oracle Argus, ArisGlobal) typically use relational databases, but there's a trend towards scalable data stores for certain aspects. For instance, if capturing real-time adverse event feeds (like social media or IoT medical device alerts), a NoSQL solution could be used for ingestion. Cassandra is suitable where high-velocity inserts are needed – imagine a scenario where thousands of patient devices send alerts that might indicate adverse reactions (blood pressure spikes, etc.). Cassandra can capture time-stamped device data reliably and at scale, ensuring no events are lost, and then link them to patient records for safety analysis. MongoDB can be used to store aggregated case data with flexible schema – beneficial if new fields need to be added for special safety studies. Additionally, text from case narratives can be stored in a document-oriented way for text mining.
-
Graph databases for signal detection and causality analysis: Safety data inherently forms a graph: patients, drugs they take, and events they experience are all connected. Neo4j has been explored for pharmacovigilance to connect these entities and run graph algorithms to find previously hidden relationships. A knowledge graph in PV can incorporate not just the basic drug-event pairs but also patient factors, genetics, comorbidities, etc. Querying this graph could answer questions like "find all reports where a drug was taken along with Drug X and the patient had outcome Y". Graph algorithms (like community detection or centrality measures) might identify clusters of drugs with similar side effect profiles. In one scoping review, knowledge graphs were recognized for their added value in PV, especially their ability to integrate multi-source data and predict adverse drug reactions by analyzing complex relationships. Another advantage is visualizing safety data: a graph of adverse event connections can help experts see patterns (for example, a particular adverse event node connected to multiple drugs of the same class, suggesting a class effect). TigerGraph could also be relevant if scaling to very large PV graphs (like including every patient-case as a node). TigerGraph's fast traversal could enable near real-time exploration of new incoming cases against an existing large graph of historical cases.
-
Machine learning libraries (Spark MLlib, etc.) and AI for PV: Beyond counting and ratios, PV is increasingly employing machine learning for signal detection (to reduce false positives and prioritize signals) and for case processing efficiency (like automated case classification). Data engineers might use Spark's MLlib or Python ML frameworks on clusters to train models on large safety datasets. For example, they could build a classifier to predict serious cases from the free-text narrative (using NLP features) to prioritize those for medical review, or use anomaly detection to spot unusual clusters of events. ML can also help in duplicate detection (identifying if two reports describe the same patient event) by comparing embeddings of text and structured data. These models often require big data infrastructure to train on the full dataset and to update as new data comes in.
-
Cloud data warehouses for integrated safety data: Once initial processing is done (e.g., computing signal metrics), results are often stored in a relational format for medical review. Snowflake, Redshift, or Synapse can be used to house a "safety data mart" that combines adverse event data with other relevant data (like drug exposure data from sales or patient counts from trials). This allows analysts to run SQL queries such as comparing event rates across regions or time periods. For example, Snowflake could store a table of drug-event signals with columns for various disproportionality scores, which pharmacovigilance scientists can query using visualization tools. Since safety data may need to be updated frequently (as new cases flow in), these warehouses should handle frequent inserts and updates; modern warehouses can do this, though historically PV groups used on-premises relational databases for this purpose. The compliance aspect is critical: safety data often contains personal health information. Cloud warehouses used for PV must be configured securely (HIPAA compliance, data encryption, restricted access). Many pharma companies maintain PV data on internal servers for this reason, but there's a gradual move to cloud as security maturates. Snowflake's secure data sharing could even allow sharing de-identified safety data with partners or regulators for collaborative signal analysis.
-
Real-time streaming and alerts: In some cases (e.g., monitoring social media or medical device data for safety issues), real-time processing tools like Apache Kafka and stream processing (Spark Streaming, Flink) are used. These allow continuous ingestion of events and immediate flagging if certain conditions are met (e.g., if a particular adverse event is mentioned multiple times on Twitter within a short period, it might warrant attention). While not explicitly listed by the user, it's worth noting that streaming complements big data storage: new safety data can be fed through Kafka to Spark Streaming jobs that update the Cassandra or graph database in real-time, enabling up-to-the-minute signal dashboards.
Example: A pharmacovigilance department collects adverse event reports from multiple sources: internal clinical trials, post-market surveillance (healthcare providers and patients reporting events), and external databases like FAERS. To process this, data engineers build a pipeline: All raw reports (which may come as XML files or via an API) land in an Azure Data Lake store. A Spark job runs nightly to process new reports – parsing the XML, standardizing drug names and event terms (using dictionaries like MedDRA), and appending them to a master dataset. This Spark job also calculates signal detection statistics: for each drug-event pair, it computes disproportionality metrics comparing to the background frequency. These results are stored in a Delta Lake table (an open format on the data lake), and also pushed into Azure Synapse Analytics (SQL pools) for easy querying via SQL. On Synapse, safety scientists can run queries like "show me all events with an elevated reporting ratio for Drug X" or use Power BI to visualize trends over time. Meanwhile, the data engineers have also set up a Neo4j graph where each incoming case is a node linked to nodes representing the drug and the adverse reaction. Over time, this builds a network; they run graph algorithms to see if any new drug suddenly becomes highly connected to a cluster of severe reactions. If such a pattern appears, an alert is generated. To handle text fields, they integrate Spark NLP in the pipeline to extract medical concepts from the narrative (like symptoms or lab results mentioned), which then get indexed in an Elasticsearch cluster for the medical reviewers to search free-text across cases. All of this is done in a secure environment – the data lake and Synapse are configured with encryption and accessible only to authorized PV personnel (with auditing). The company can demonstrate compliance by showing the lineage of data from ingestion to signal report (thanks to logged Spark jobs and versioned data in the Delta Lake). By using these technologies, they manage to analyze the entire FAERS database plus their internal data in minutes, something that used to take much longer with traditional tools.
Comparison: Technologies for Pharmacovigilance
| Technology | How It's Used in PV | Benefits and Differentiators | Considerations |
|---|---|---|---|
| Spark on Hadoop | Batch processing of large AE datasets (e.g., computing signal scores across millions of cases). Machine learning on safety data, NLP on case narratives. Often deployed on cloud (Databricks, EMR) for scalability. | Can handle entire global safety DB in memory/distributed, yielding fast computation (e.g., analyzing FAERS 12M records in minutes vs years by manual review). Supports complex algorithms (MLlib, custom Scala/Python code) and heavy join operations (drug with background population). | Requires data engineering expertise to set up pipelines and interpret results. Ensuring data quality (duplicate detection, coding consistency) is up to the implemented code. Spark jobs must be validated for use in regulatory submissions or health authority inquiries. |
| Cassandra | Ingesting high-velocity safety data (e.g., device alerts, web reports) and storing time-series or case records for quick retrieval. Also can store aggregated counts for dashboards or recent signal computations. | High-write throughput and fault tolerance – the system stays up even if nodes fail, ensuring continuous data intake. Excellent for time-stamped data (each event record keyed by drug or patient ID plus time). Scales linearly for growing volumes, so sudden increases in reports can be handled by adding nodes. | Not ideal for ad-hoc queries outside primary key – one usually queries by drug or case ID, but complex searches (e.g., all cases with symptom X) require custom secondary indexing or exporting data to another system. Also, joins and multi-dimensional analysis have to be done in Spark or a warehouse, not within Cassandra. |
| Neo4j / Graph | Building a safety knowledge graph linking drugs, adverse events, patients, and possibly genetic or demographic factors. Used to explore indirect relationships and clusters of events. Helps in visualizing how different drugs share adverse events, which might suggest common mechanisms. | Graph queries make complex network questions answerable (e.g., find "similar" drugs based on shared event profiles). Can identify connected components (clusters of cases or events) that traditional methods might treat as separate. Graph algorithms (e.g., centrality) highlight which drugs or events are most influential in the network. Intuitive visualization for medical experts to see the web of relationships. | Building and updating the graph adds overhead, and very large graphs (millions of nodes/edges) need robust infrastructure (TigerGraph or Neo4j Aura) to query quickly. Also, safety data is dynamic – each new case adds nodes/edges – so processes must be in place to keep the graph up-to-date. Interpretability: a graph can show associations, but causation still requires expert analysis. |
| Snowflake / SQL DW | Integrating cleaned safety data with other data (exposure, patient counts, product info) in a queryable form. Serving as the source for periodic safety reports and signal tracking dashboards. | Provides an enterprise single source for safety metrics that can be easily queried by analysts and output for regulatory reporting. High concurrency for multiple users (safety scientists, epidemiologists) to run queries simultaneously. The structured environment makes validation and audit trails easier (every query can be logged). Can enforce role-level security (e.g., only aggregated data viewable to certain users). | Requires that data be transformed and loaded in structured form – unstructured narratives need to be coded or summarized first. There's some latency – often updated nightly or weekly, not real-time. Cost needs monitoring if data volume is large (but safety data volume is often manageable compared to e.g. genomics). Must ensure sensitive identifiers are removed or protected before loading (as warehouses are not typically used to store patient identifiers in PV). |
| Machine Learning (Spark MLlib, Python scikit, etc.) | Advanced signal detection (e.g., anomaly detection, predictive modeling of risk), and automation in case triage or duplicate detection. NLP models to automatically extract key information from narratives (like suspected drug, adverse event terms). | Can improve signal detection by accounting for multiple variables simultaneously (multivariate algorithms might catch a subtle signal missed by univariate disproportionality). Speeds up case processing – e.g., automatically prioritizing cases likely to be serious, so humans review those first. NLP can structure free text for easier analysis (turning narratives into coded data). | Models must be thoroughly validated – false negatives in PV are unacceptable. Regulatory acceptance of pure ML signals is cautious; usually ML is a supplement to, not replacement for, traditional methods. Implementation requires cross-functional expertise (data scientists and PV experts). Also, ML models can drift as data changes, so they need retraining and monitoring. |
Pharmacovigilance is a data-heavy domain where big data tech is proving its worth by speeding up detection of safety signals and allowing more complex analyses than previously possible. A key trend is combining diverse data (clinical trials, real-world usage, literature) – this is where these technologies shine by handling volume and variety (the "3 V's" of big data: volume, velocity, variety) in drug safety. The ultimate goal remains the same: protect patients by identifying risks early. Thus, any technology used must not only be powerful, but also reliable and transparent enough to satisfy regulatory scrutiny when decisions (like issuing warnings or updating labels) are made based on data.
Manufacturing and Supply Chain Optimization
Pharmaceutical manufacturing and supply chain operations generate big data from production lines, quality control labs, inventory systems, distribution logistics, and IoT sensors (e.g., temperature monitors in cold chain storage). Data engineers support use cases like predictive maintenance of equipment, optimization of supply chain routes, inventory forecasting, and ensuring product quality and compliance throughout the production process. These use cases require handling streaming sensor data, large time-series datasets, and complex networks of suppliers and distributors. The key technology needs are scalability for sensor/IoT data, real-time or near-real-time processing for timely decisions, integration of heterogeneous data (ERP systems, factory equipment logs, weather data, etc.), and compliance with manufacturing regulations (ensuring data integrity and audit trails for Good Manufacturing Practice).
Technologies in use:
-
Apache Cassandra for IoT and sensor data: Pharmaceutical manufacturing involves a lot of equipment and environmental sensors (monitoring conditions like temperature, humidity, vibration, etc.). These sensors emit readings continuously, leading to a deluge of time-series data. Cassandra, as a distributed NoSQL store, is a popular choice to handle this kind of data due to its high write throughput and ability to scale horizontally without single points of failure. For example, a pharma company might use Cassandra to collect temperature and humidity readings from hundreds of lab chambers or production suites every few seconds. By sharding data by sensor and time, Cassandra can ingest this data in real-time and retain it for analysis. It ensures that even if one node goes down, data is replicated and available (important for critical manufacturing data). Another use is tracking supply chain telemetry – Cassandra could store GPS pings and temperature data from refrigerated trucks delivering vaccines, allowing real-time queries on where a shipment is and if conditions have deviated. The trade-off is that Cassandra excels at fast writes and primary-key reads, but complex analytical queries on this data (like correlation between two sensors) would be done in Spark or a warehouse after extracting the relevant slice.
-
Apache Hadoop (HDFS) and Spark for manufacturing analytics: Historical manufacturing and supply chain data (spanning years of operations) can be huge – think of every batch record, every equipment log, every shipment detail. Hadoop HDFS is often used as a data lake to store this history cheaply. Then Spark can be utilized for various analytics: predictive maintenance (analyzing sensor patterns to predict machine failure), yield optimization (finding factors affecting batch yield by analyzing past batch data), and supply chain simulation (using historical demand and supply data to model scenarios). For instance, Spark might be used to train a model on vibration sensor data from machines to predict when a bearing will fail, alerting maintenance before a breakdown occurs. Spark can also crunch through years of production data to find subtle patterns (maybe a combination of slightly high humidity and a certain raw material lot correlates with lower product potency). In the supply chain realm, Spark could simulate distribution scenarios – e.g., how would lead times and costs change if a distribution center is relocated – by using the granular data of shipments and inventory. The ability of Spark to join large datasets (like linking manufacturing deviations with supplier data and quality test results) can uncover root causes that single-source analysis might miss.
-
Cloud analytics platforms (Azure Synapse, AWS Redshift/S3, Google BigQuery): Many pharma companies modernize supply chain analytics by moving to cloud platforms that combine data warehousing with data lake capabilities. Azure Synapse Analytics is often chosen for its unified approach: it can directly query data in Azure Data Lake Storage (where raw IoT data or ERP extracts are landed) and also ingest curated data into a relational warehouse for high-performance analytics. For example, Synapse might be used to create a dashboard that tracks key manufacturing KPIs by aggregating data from both batch records and real-time sensor alerts. Synapse's integration with Power BI allows interactive exploration of this data. AWS Redshift (often with Redshift Spectrum or AWS Athena) allows similar capability – e.g., a company could keep detailed IoT data in S3 (accessed via Spectrum when needed) but maintain a Redshift data warehouse of daily summary stats for quick querying. Google BigQuery can be used by companies leveraging Google Cloud's AI for things like demand forecasting – BigQuery can house the data, and then feed models in Vertex AI. These cloud platforms also provide scalability (adding more computing nodes or using serverless resources to handle spikes in queries) and built-in security/compliance features (encryption, IAM controls, logging) that can be configured to meet GxP requirements. Cloud flexibility was highlighted during the pandemic when pharma supply chains needed rapid reconfiguration – those with cloud-based data platforms could more swiftly analyze scenarios like vaccine distribution logistics.
-
Graph databases for supply chain network modeling: Pharmaceutical supply chains are multi-tiered and global. Graph databases shine in modeling these relationships and identifying vulnerabilities or optimization points. Neo4j can store a model where nodes are suppliers, manufacturing plants, distribution centers, and even specific shipments or materials, with edges representing supply relationships or material flows. Queries can then answer, "If supplier X has a delay, which final products are at risk?" by traversing all edges downstream of that supplier. Graph algorithms can find bottleneck nodes (nodes whose removal greatly disrupts connectivity) – these might be key suppliers that lack alternates. TigerGraph, with its distributed architecture, can handle extremely large supply chain graphs (imagine modeling every product's bill of materials and all logistics routes in one graph). This can go hand in hand with supply chain digital twins and scenario planning. For instance, TigerGraph could be used to run what-if analyses: remove a node (simulate a site shutdown) and see how many paths are broken and what alternative paths exist, all in near real-time. Neo4j has been used in supply chain to provide visibility where data is siloed – by connecting ERP, CRM, and logistics data in one graph, a company can quickly get a holistic view. In pharma, where regulatory and quality implications are tied to supply chain (e.g., a single-source ingredient might be a compliance risk), graphs help map those dependencies clearly.
-
Streaming and real-time processing (Kafka, Spark Streaming): To react quickly (say, to a temperature excursion in a shipment or a sudden equipment alarm), streaming technologies are used. Apache Kafka often serves as the backbone for moving real-time data from machines or trackers into analytics systems. For example, a Kafka topic might carry all machine sensor readings; a Spark Streaming job subscribes to it and performs anomaly detection on the fly, raising an alert if a metric deviates beyond a threshold (predictive maintenance in real-time). Similarly, as orders and inventory updates stream in from around the world, a streaming pipeline could update inventory positions instantaneously and trigger restock orders or reroute shipments to prevent stockouts. This is crucial for life-saving drugs and vaccines where delays or stockouts are not acceptable. Streaming data is often then stored into Cassandra or a time-series database for persistence, while immediate triggers are handled by the streaming app logic (e.g., send alert, update dashboard).
-
Informatica and integration: Manufacturing and supply chain data often reside in enterprise systems like SAP (for manufacturing execution and inventory) or LIMS (Lab Information Management for quality tests) or SCADA systems for process control. Informatica is commonly used to ETL data from these sources into data lakes or warehouses for analysis. It can also enforce data quality (ensuring all required batch data is present, or flagging anomalies in log data). Additionally, MDM in supply chain is critical for reference data like material codes, supplier IDs, and location codes; Informatica MDM or similar ensures that these are consistent across systems so that when data is integrated, everything lines up correctly. A real example is Pfizer, which used a combination of Snowflake (for data warehousing) and Informatica to automate 99% of data mappings from on-prem systems (like manufacturing and lab data sources) to the cloud, thereby digitizing and integrating their end-to-end supply chain data.
Example: A pharma company wants to optimize its vaccine supply chain from manufacturing to distribution. They deploy IoT sensors in their manufacturing plants (monitoring equipment vibrations, temperature, etc.) and in their cold chain shipments (GPS and temperature trackers in each container). Data engineers set up an AWS IoT + Kafka pipeline that streams all this sensor data into a Cassandra cluster in near real-time. On top of Cassandra, they build a microservice that queries the latest readings and triggers alerts if any condition goes out of spec (e.g., if a freezer's temperature exceeds a threshold for more than 2 minutes, send an alert to maintenance). All sensor data also gets periodically copied to an S3 data lake for historical analysis. On that data, they run Spark on Amazon EMR to do two things: (1) Predictive maintenance – analyze equipment sensor data (vibration, temperature, etc.) to predict failures. They use Spark's MLlib to train models using labeled historical incidents of machine failures. (2) Supply and demand forecasting – combine inventory levels, production rates, and shipment transit times with external data (like disease outbreak data or seasonal trends) to predict where and when demand surges might happen. They use Spark to train a demand forecast model on years of sales and epidemiological data. The results (like predicted stock levels or production needs per region) are written to a Redshift data warehouse where operations teams can query them with SQL and feed dashboards. They also use a TigerGraph database to map their entire supply network: nodes for raw material suppliers, manufacturing plants, distribution centers, shipping lanes, etc. When planning, they simulate scenarios – e.g., "What if Plant A goes down for 1 month?" TigerGraph quickly identifies all products impacted and checks if alternative manufacturing nodes exist for those, highlighting which products could face shortages. This informs contingency plans. In one instance, this graph analysis revealed that a single supplier provided an ingredient for 5 major vaccines; the company proactively qualified a second supplier to mitigate this risk, an insight that came directly from centrality analysis in the graph. Throughout these processes, all systems are under a GxP compliance umbrella – the data lake and Redshift are part of a validated cloud environment with proper change control, and any models that directly influence GxP decisions (like adjusting production volumes) are verified by quality teams. The outcome is a more resilient and efficient supply chain, with real-time monitoring reducing spoilage (e.g., saving shipments from temperature excursions) and big-data-driven forecasting reducing both shortages and overstock.
Comparison: Technologies for Manufacturing & Supply Chain
| Technology | Typical Use in Mfg/Supply Chain | Pros | Cons | Adoption Example |
|---|---|---|---|---|
| Cassandra | Collecting and storing high-speed sensor/IoT data from production equipment and shipments. Also backing real-time dashboards and alert systems (e.g., equipment health, cold chain monitoring). | Scalable, fault-tolerant: can ingest thousands of readings per second, with no downtime due to replication. Time-series optimized: data model can be designed for fast recent reads (e.g., partition by sensor). Suitable for multi-site/global operations due to multi-datacenter replication. | Not built for complex querying or analytics beyond simple lookups by key or time range. Typically paired with Spark or SQL DB for deeper analysis. Operational overhead: managing and tuning a Cassandra cluster requires expertise (compaction, replication settings, etc.). | Used for IoT in pharma: A large vaccine manufacturer uses Cassandra to capture temperature/humidity from hundreds of sensors in real time, feeding a live quality assurance dashboard. Also used in pharma manufacturing for equipment log storage, providing a buffer for streaming analytics. |
| Hadoop & Spark | Big data processing on historical manufacturing and supply data: yield analysis, quality analytics (e.g., linking process parameters to outcomes), supply chain simulation, and model training (forecasting, optimization). | Powerful analytics: can crunch years of data (batches, lab results, distribution records) to find patterns or train ML models that improve processes. Flexibility: can integrate diverse data sources (machine logs, ERP extracts, weather data) in one framework. Spark's in-memory computation makes iterative algorithms feasible on big datasets. | Results often need further handling to be actionable (Spark might output a model or recommendations, which then must be integrated into operations). Requires data engineering + data science talent. On-prem Hadoop for manufacturing can be challenging to validate; cloud use needs careful control of data flows to ensure confidentiality of sensitive process data (IP protection). | High adoption (analytics): e.g., Moderna (a newer pharma) leveraged cloud data lakes and Spark to rapidly scale vaccine production analytics. Traditional pharma like Novartis have used Spark to analyze production data from continuous manufacturing to optimize yields. Spark is also used in logistics arms of pharma distributors to route shipments. |
| Azure Synapse / Cloud DW | Centralized analytics and reporting on production and supply chain metrics. E.g., a Synapse or Snowflake data warehouse that aggregates daily production counts, batch cycle times, inventory positions, and supplier performance metrics for management dashboards. | Integrated ecosystem: Synapse ties in with Azure Data Factory, Azure ML, Power BI, providing a one-stop shop from data ingestion to reporting. Warehouses handle concurrent user queries well (useful when supply chain, manufacturing, finance teams all query data). Good for structured data: ideal for periodic reports (monthly production vs plan, OTIF – on-time-in-full delivery metrics, etc.). | Not suited for raw sensor data storage or real-time needs (data usually loaded on a schedule). Can become expensive if used to store huge volumes of granular data (usually that stays in data lake). Needs robust data modeling – define schemas that integrate data from SAP, LIMS, etc., which takes initial effort. | Very high adoption: Virtually all big pharma have some form of data warehouse for manufacturing/supply KPIs (some still on-prem, many moving to cloud). Eli Lilly, for instance, uses a cloud data warehouse to integrate supply chain data for real-time monitoring of drug shipments (improving visibility). Pfizer's supply chain modernization included moving siloed data into Snowflake and automating pipelines with Informatica. |
| Neo4j / TigerGraph (Graph) | Modeling supply networks and product genealogies as graphs. Used for risk analysis (find single points of failure), impact of changes (which products use X supplier), and optimizing network (shortest path, alternate route identification). Also used to trace materials (for compliance, traceability from raw material to patient). | Makes interdependencies visible: helps answer multi-hop questions easily (which a SQL join of many tables struggles with). Graph algorithms can highlight critical suppliers or lanes so contingency plans can be developed. In quality investigations, graphs can trace every batch that used a suspect raw material in seconds, ensuring faster responses to quality events. | Data gathering required – building a full graph means integrating data across procurement, manufacturing, distribution, which might be in disparate systems. Ensuring graph stays updated with ERP changes can be complex (needs event-driven updates or regular sync). Visualization of very large graphs can be challenging – often need custom summarization for human-friendly views. | Emerging but promising: Several pharma (and large CMOs) started using graph tech after supply disruptions in COVID-19 to improve resilience. One case is using Neo4j to map out vaccine distribution networks to quickly reroute around bottlenecks. TigerGraph's use in healthcare supply chain has been demonstrated in proofs-of-concept for ensuring steady supply of critical medicines by analyzing network connectivity. |
| Kafka & Streaming | Real-time monitoring for manufacturing (machine alarms, environmental excursions) and supply chain (shipment tracking, inventory alerts). Enables immediate notifications and automated reactions (e.g., auto-create a maintenance ticket, reroute a shipment). | Real-time data flow: minimal delay from event occurrence to action. Kafka is reliable and can buffer bursts, ensuring no data loss from fast machines. Streaming processing (Spark Streaming, Flink) can implement complex event processing (e.g., pattern detection over time). Great for bridging OT (operational tech on the factory floor) with IT systems by streaming data from PLCs or SCADA to analytics. | Adds infrastructure to maintain (Kafka cluster). Must design streams carefully to avoid false alarms and ensure important signals aren't missed in noise. In regulated environments, any automated action on GxP processes triggered by streaming data must be validated (often companies use streaming for monitoring, with humans deciding actions, to stay safe). | Increasing adoption with Industry 4.0: Pfizer's continuous tablet manufacturing line uses real-time feeds to adjust process parameters on the fly (with human oversight). Warehouses of pharma distributors use streaming from IoT devices to manage inventory robots. Many pharma are in pilot stages of connecting all their equipment via OPC-UA to Kafka to enable a "smart factory" analytics layer. |
| Informatica / MDM | Integrating data from systems like SAP (production planning, inventory), LIMS (quality test results), and WMS (warehouse management) into the data lake/warehouse. Mastering data like material codes, product codes, and supplier info across these systems. | Pre-built connectors: to SAP, Oracle, etc., save development time. MDM ensures one version of truth: e.g., a raw material code in SAP is linked to the standardized material ID used in analytics, avoiding duplication. Data quality: can enforce business rules (e.g., flag if a batch record is missing a release date or if a shipment record is missing temperature data). | Traditional enterprise tool – requires license and skilled developers, which some newer companies may circumvent with open-source alternatives. MDM projects need business alignment (agreeing on master definitions) which can be lengthy. But for large established pharma with legacy systems, these are often the only way to reliably consolidate data. | High adoption in integration: Novartis uses Informatica to pull data from dozens of manufacturing sites into a global data lake. GSK employs Informatica MDM to have a global product master, ensuring consistent identification of products across R&D, manufacturing, and commercial. Even new data mesh architectures often incorporate MDM for critical domain data. |
Manufacturing and supply chain in pharma is an area where operational efficiency gains directly impact the bottom line (and public health, by ensuring medicines are available). Thus, the use of big data tech here often focuses on predictive and preventive analytics (to avoid problems before they happen) and on end-to-end visibility (breaking data silos between production, quality, and distribution). The table above shows that a combination of streaming + NoSQL for real-time, big data frameworks for deep analysis, and graph/AI for complex pattern discovery is becoming the norm in advanced pharma operations (what some call Pharma 4.0, mirroring Industry 4.0). Data engineers must often integrate old and new – streaming IoT data from shop floors with legacy SAP records – making this a challenging but high-impact domain.
Sales and Marketing Analytics in Pharma
Pharma companies leverage big data in commercial operations – analyzing sales data, market research, patient and prescriber data, and marketing campaign performance. While the data volumes are often smaller than in R&D or manufacturing, they are still substantial (e.g., prescription records for millions of patients, or terabytes of healthcare claims data for market insights). Moreover, new data sources like social media or digital engagement (webinars, emails) add to the variety. Use cases include sales force optimization, marketing ROI analysis, Key Opinion Leader (KOL) identification, and patient journey analytics. Data privacy is crucial here (handling patient or physician data must respect HIPAA, GDPR, etc.), and integration of data from third-party vendors (e.g., IQVIA prescriptions, claims data, Veeva CRM) is often needed.
Key technologies and approaches:
-
Cloud data warehouses (Snowflake, Redshift, BigQuery) for sales data integration: Commercial data often comes from various sources – CRM systems (like Veeva CRM), third-party sales data providers, internal sales targets, marketing automation platforms, etc. A cloud data warehouse serves as the central integration point where all this data is consolidated for analysis. Snowflake is commonly used by pharma commercial analytics due to its ability to handle both structured and semi-structured data and its ease of sharing data. For instance, companies can directly ingest large weekly prescription datasets (often delivered as flat files) into Snowflake and join with their internal data. Snowflake's data sharing and marketplace capabilities even allow companies to access data like patient claims or formulary data directly from partners. AWS Redshift is similarly used in companies that are AWS-centric – e.g., ingesting sales data from S3 and combining with Salesforce/Veeva exports. Google BigQuery is used when pharma teams want to leverage Google's analytics (for example, linking Google Ads data or using BigQuery ML for quick models on sales data). These warehouses provide the performance needed to slice and dice sales by region, product, physician, etc., and the concurrency to allow many users (sales analysts, forecasters) to query simultaneously. They also support BI tools like Tableau or Power BI out-of-the-box for reporting.
-
Informatica and Master Data Management (MDM) for customer and product data: Pharma deals with complex customer data – each doctor (HCP) might appear in multiple data sources (prescription data, conference attendee lists, CRM contacts) with slight variations. MDM ensures a single unified profile for each HCP and each institution (hospital, clinic) across data sources. Informatica MDM or similar solutions (like Reltio, which is cloud-native MDM often used in pharma) are deployed to manage this. This greatly improves analytics because now sales data, marketing touches, and outcomes can be linked to the same entity. Similarly, product hierarchies (e.g., molecule -> brand -> formulation -> SKU) are maintained to allow analysis at different levels (brand-level vs. product-level sales). Informatica's data integration tools also feed the warehouse by connecting to CRM (Veeva CRM has APIs/Informatica connectors), ERP (for shipments or orders), and external data feeds. Pfizer, for example, emphasized the importance of data integration in their commercial data domain to scale up processing and sharing – using Informatica on cloud to avoid hand-coding integrations. Ensuring compliance in commercial data integration includes honoring opt-outs (if a doctor opted out of marketing, that data flow must be respected) and handling PII appropriately (often personal data is hashed or anonymized unless needed at identifiable level for specific uses).
-
Graph databases for KOL and network analysis: Influence networks among physicians can significantly impact drug adoption. Graph technology helps pharma identify and leverage these networks. TigerGraph and Neo4j are used to construct physician referral graphs (who refers patients to whom) and collaboration graphs (who co-authors papers or sits on boards together). TigerGraph shared a use case where mapping the patient referral network enabled Amgen to find hubs of influence – physicians who refer many patients to specialists, indicating they are central in patient flows. Traditional SQL required expensive joins on large claims tables which took hours, whereas TigerGraph handled the connections much more efficiently as a graph traversal. Using such a graph, the company can find clusters of prescribers (communities) and target the central nodes to indirectly reach many others. Neo4j is also widely used in pharma for KOL identification, linking data like publications, clinical trial participation, and guideline authorship. By querying this graph, a medical affairs team can find the most connected experts in a given therapeutic area (those who publish extensively and collaborate widely). Graph algorithms like PageRank can rank KOL influence. These insights feed into decisions about speaker programs, advisory boards, or even one-to-one engagement by reps for education. The differentiation of graph DBs is their ability to handle multi-hop relationships easily – e.g., find all doctors within 3 degrees of Dr. X in the collaboration network, or identify communities of practice around a certain treatment approach.
-
Big data for real-world evidence (RWE) and patient analytics: Sales and marketing strategies increasingly rely on understanding patient journeys and real-world outcomes. This can require processing very large, granular patient-level datasets (de-identified for privacy). Spark or BigQuery can be used to handle tens of millions of claims or EMR records to find insights like average time to treatment, switches between therapies, adherence rates, etc. These insights help marketing tailor messaging (e.g., if data shows patients often discontinue a competitor drug due to side effects, the sales team can emphasize their drug's tolerability). Databricks (Spark) is sometimes used to create patient clusters or predictive models (like which patients are likely undiagnosed for a condition, so marketing can raise awareness in that patient segment via physicians). Once these models or aggregate insights are produced, they are fed back into the warehouse or CRM for action – for instance, flagging to reps that a certain physician has many patients who could benefit from a new approved indication, based on claims data analysis. Privacy is carefully guarded: typically this analysis is done on anonymized data, and any identifiable insight is at physician or aggregate level, not individual patients.
-
AI in sales and marketing: While not explicitly asked, it's worth noting that machine learning models are used for things like next-best action recommendations to sales reps (what action to take for which doctor), churn risk models (which physicians might stop prescribing a product), and marketing mix optimization (analyzing large sets of marketing spend and return data to allocate budget). These models may be trained using Python/R on the integrated data in the warehouse or on a Spark cluster if data is huge. The output (recommendations, scores) is then integrated into tools the sales or marketing team uses (like a dashboard or Veeva suggestions).
-
Veeva Vault (PromoMats) for content management: While not a big data tool per se, Vault PromoMats is used to manage all marketing materials and ensure# Big Data Technologies in Pharma: Use Cases, Implementation, and Comparisons
The pharmaceutical industry generates vast and diverse datasets – from genomic sequences and clinical trial results to regulatory documents, safety reports, and supply chain logs. Data engineers in pharma must choose appropriate big data technologies to store, process, and analyze this information at scale. This report explores key technologies – Hadoop (HDFS, Hive, HBase), Apache Spark, Cassandra, MongoDB, Snowflake, AWS Redshift, Azure Synapse Analytics, Azure Data Lake, Google BigQuery, Neo4j, TigerGraph, Veeva Vault, Informatica, DNAnexus, and Illumina BaseSpace – and how they are applied across major use cases. Each section focuses on a specific use case (e.g., genomics data analysis, clinical trials, regulatory data management, pharmacovigilance, manufacturing and supply chain, sales and marketing analytics), detailing which technologies are commonly used, how they are technically implemented, what differentiates them, and concrete examples. Comparisons are provided in tables for attributes like scalability, cost, performance, integration ease, compliance, and real-world adoption, to help data engineers evaluate solutions.
Genomics Data Analysis and Bioinformatics Pipelines
Genomic and multi-omics data analysis in pharma involves processing massive sequencing outputs (DNA/RNA reads, variant files) and integrating results for drug discovery or precision medicine. Key challenges include scalability (handling petabytes of sequencing data), processing speed (aligning reads or calling variants across thousands of genomes), flexible pipelines, and compliance (securely handling potentially identifiable genetic data). Data engineers leverage a mix of on-premises big data frameworks and specialized cloud platforms:
-
Hadoop Distributed File System (HDFS) for large-scale storage: Genomic files (FASTQ, BAM, VCF, etc.) are enormous. HDFS provides distributed storage across clusters, making it feasible to store and process terabytes of sequence data in parallel. For example, biomedical research projects have utilized Hadoop to manage large volumes of NGS and clinical data ([1]). Apache Hive (SQL-on-Hadoop) can impose structure on variant data (storing variant calls in tables for query), and HBase (Hadoop's NoSQL store) enables fast random access to specific genomic records (e.g., retrieving all variants at a particular gene). While Hadoop's batch-oriented MapReduce model was historically used in genomics, modern pipelines favor more efficient in-memory frameworks.
-
Apache Spark for distributed computing: Spark is a cluster computing engine ideal for iterative algorithms and large-scale analytics. In genomics, Spark accelerates variant analysis pipelines by parallelizing tasks across cores or nodes. For instance, the GATK4 toolset from the Broad Institute offers Spark-based versions of key algorithms to speed up processing of large genome cohorts. Spark can run on Hadoop (using YARN) or in cloud-managed environments (Databricks, Amazon EMR, Google Dataproc). Specialized frameworks like ADAM and Hail build on Spark to provide genomic data models and APIs, enabling scalable genomic analyses (e.g., joint genotyping on thousands of genomes). Spark's in-memory processing provides major performance gains over Hadoop MapReduce, making it "one of the most promising technologies" for genomic pipelines. Its machine learning libraries (MLlib) also support advanced analyses (clustering variants, predicting phenotypes from genotypes, etc.).
-
Cloud Data Warehouses (Snowflake, BigQuery, Redshift) for multi-omics integration: After primary genomic analyses, results (variants, expression matrices, etc.) need to be integrated with clinical and reference data. Cloud data warehouses excel at interactive analytics and sharing of such integrated data. Snowflake has been used as a bioinformatics data warehouse, providing a convenient SaaS platform to join genetic data with clinical phenotypes. Researchers demonstrated a Snowflake framework for storing diverse biological datasets (genomic variants, chemical screening results) and enabling cross-domain queries for insights like disease variant effects and drug target discovery. Snowflake's multi-cloud compatibility and near-zero maintenance appeal to pharma R&D teams – it runs on AWS, Azure, or GCP, reducing vendor lock-in risks. Its features like secure data sharing and zero-copy cloning are advantageous for collaboration (sharing subsets of data without replication). Google BigQuery is another choice, especially to leverage Google's public genomic datasets (like TCGA, 1000 Genomes) and AI platform integration. BigQuery's serverless design handles huge query loads easily and has built-in connectors to tools like Google's Datalab and AutoML. Notably, BigQuery has native support for array genomics data types and can integrate with tools like DeepVariant or AlphaFold on the cloud. Amazon Redshift is often used if a team is AWS-centric – Redshift Spectrum can directly query data in S3 (where many genomic pipelines drop results), and Redshift can integrate with AWS AI services (SageMaker) for downstream analysis. In one comparative discussion, BigQuery's strength was noted in its support for genomic datasets and ML integration, while Redshift's strength was easy integration with AWS genomic workflows. Each warehouse offers strong security (encryption, VPC isolation, role-based access) to meet HIPAA or other privacy requirements.
-
NoSQL/Graph databases in genomics: Some genomic applications benefit from NoSQL or graph data models. MongoDB can be used to store semi-structured genomic annotations or patient genomic records (as JSON) for flexibility – e.g., a database of gene panels where each record (gene) has varying annotations. Its clusterable nature allows scaling if, say, thousands of genomes' annotations are stored as documents. HBase/Cassandra can store large key-value pairs like k-mer frequencies or variant counts keyed by genomic position, supporting fast lookups in association studies. Neo4j is applied to knowledge graphs that include genomics – for example, linking genes, variants, pathways, and diseases in a graph allows complex queries (e.g., find drug targets that interact with proteins affected by a patient's variants). Graph-based approaches help in integrative analysis (connecting genomics to biological networks), though they are typically secondary to the main computational pipelines.
-
Specialized Genomic Platforms: Many pharma rely on platforms like DNAnexus or Illumina BaseSpace for genomic data management and analysis. DNAnexus provides an end-to-end cloud platform for NGS data, offering a suite of bioinformatics tools and the ability to run custom pipelines in a secure, collaborative environment. It is built for scale – managing over 80 petabytes of genomic and multi-omic data for various organizations ([6]) – and compliance (audit trails, access controls suitable for clinical genomic data) ([6]). DNAnexus enables teams to focus on science by handling the underlying infrastructure and compliance (it's HIPAA and GDPR compliant, for example). Illumina BaseSpace Sequence Hub integrates directly with Illumina sequencers to stream data to the cloud for storage and analysis. It provides DRAGEN pipelines (hardware-accelerated algorithms) for ultra-fast secondary analysis, and ensures an ISO 27001 and HIPAA-compliant environment for genomic data. BaseSpace simplifies sequencing workflow management – runs can be set up with automatic pipeline execution, and data is securely stored and shareable with collaborators through the platform ([13]). These platforms reduce the need for in-house infrastructure, though they may be complemented by general tools (e.g., one might export BaseSpace results to Snowflake for broader integration with clinical data).
Example: A pharmaceutical research team sequences tumor samples for a cancer drug trial (whole exomes for 500 patients). They use Illumina NovaSeq sequencers with BaseSpace to handle data capture and initial processing (alignment and variant calling with DRAGEN). As soon as each sample is sequenced, BaseSpace processes it and stores the resulting VCF (variant calls) and quality metrics. Data engineers then transfer the VCFs to an Azure Data Lake and use Azure Databricks (Spark) to run joint variant analysis – combining all samples to identify common mutations and performing quality filtering. They also use Spark's machine learning to cluster tumors by mutation profiles. The consolidated variant data, along with cluster assignments and key clinical attributes (like treatment response), are loaded into Azure Synapse Analytics (which combines a data lake and warehouse) or a Snowflake warehouse. There, biostatisticians can run SQL queries to correlate mutations with outcomes and generate reports. They might also use Neo4j to build a knowledge graph: linking each identified mutation to known pathways and drugs (using data from public knowledge bases). This graph helps them visually and computationally explore if patients with certain mutations could be candidates for existing targeted therapies (repurposing opportunities), by traversing connections between genes, drugs, and trials in Neo4j. Throughout, patient identities are coded, and all systems used (BaseSpace, Snowflake, etc.) are configured to meet data protection standards. By combining specialized platforms with general big data tools, the team efficiently derives insights that guide the trial (like stratifying patients by mutation-defined subgroups for analysis).
Comparison: Technologies for Genomics Data
| Technology | Scalability | Performance | Integration Ease | Compliance Features | Adoption in Genomics |
|---|---|---|---|---|---|
| Hadoop (HDFS, Hive, HBase) | High horizontal scalability (add nodes to store petabytes; throughput scales with cluster). Ideal for on-premises big data storage/processing. | Great for batch processing of large files; MapReduce is reliable but slower than in-memory systems for iterative tasks. Hive provides SQL querying on big genomic tables, but latency is in seconds to minutes, not interactive. HBase offers millisecond reads by key (e.g., lookup by genome coordinate). | Requires significant expertise to set up and manage (Java/Scala skills, cluster admin). Integrates well with Spark, Kafka, etc., but not as user-friendly as cloud platforms. | Can be secured (Kerberos, Ranger for access control) and kept entirely on-prem (important for organizations avoiding cloud). However, validating a Hadoop environment for GxP can be complex. | Historically high adoption for large genomic initiatives (the 1000 Genomes Project used HDFS). Many genomics labs built Hadoop clusters in 2010s; now shifting to cloud or specialized platforms, but some remain for in-house pipelines. |
| Apache Spark | Scales from a laptop (standalone mode) to large clusters (hundreds of nodes). In-memory model needs ample RAM; can spill to disk for very large data. Easy to scale on cloud with managed services. | Excellent performance for data transformations and iterative algorithms on large genomics datasets. E.g., joint calling on thousands of samples is feasible with Spark where traditional tools would be too slow. Far faster than Hadoop MapReduce for most tasks due to in-memory computing. | Integrates with many sources (HDFS, S3, Azure Blob, GCS, JDBC to warehouses). Provides APIs in Python, R, Scala, which lowers barrier for data scientists. Many genomic tools (Hail, GATK) have built-in Spark support. Slight learning curve for distributed computing concepts, but widely adopted. | No built-in compliance; inherits environment's compliance. On a secure cluster (Kerberos, VPC isolation) or managed service (Databricks is HIPAA compliant for instance), it can be used for PHI/PII. Audit logging needs custom configuration. | Very high in genomics research and pipelines. E.g., Broad's GATK uses Spark for large-scale variant processing. Pharma use Spark for secondary analysis, annotation pipelines, and even deep learning on genomic data (with Spark ML or integration to TensorFlow). |
| Snowflake | Near-infinite scalability: decoupled storage/compute means virtually unlimited data storage, and compute warehouses can scale up (bigger servers) or out (concurrency scaling) automatically. Multi-cluster warehouses handle many users. | High performance on analytic queries via columnar storage and optimization. Automatically handles indexing, partitioning under the hood. Great for complex joins/aggregations on genomic datasets integrated with clinical data. Can ingest semi-structured JSON (e.g., structured variant annotations) efficiently. | Very easy to use standard SQL. Native connectivity to BI tools, Jupyter (via Python connectors), etc. Data sharing allows integrating external data (e.g., public genomic sets) without ETL. Less suitable for custom genomic algorithms (those are done in Spark or Python, then results loaded into Snowflake). | Strong compliance: supports HIPAA and HITRUST; data is encrypted by default. Fine-grained access control, comprehensive auditing, and the ability to physically isolate data (virtual private Snowflake) for compliance. Often validated for clinical data storage. | Rapidly growing in pharma R&D. Used as central data repo for multi-omics and phenotypic data in research collaborations. Also used in clinical genomics (e.g., Tempus Labs uses Snowflake to share genomic data with hospital partners). |
| Google BigQuery | Extremely scalable – designed to scan terabyte to petabyte-scale datasets quickly. Serverless scaling, so users don't manage nodes; Google allocates resources as needed. | Very fast for set-based operations on large datasets (billions of rows). Uses massively parallel processing under the hood. Ideal for exploratory queries on large genomic variants tables or combining variant data with large public sets (ClinVar, etc.). Slight overhead for small queries. | Standard SQL interface, integration with Google's ecosystem (GSheets, Data Studio, Colab notebooks). Easy to join with Google Cloud Storage data. Has GIS and array query support which can be repurposed for genomics (e.g., interval overlaps). Streaming ingestion allows near-real-time data loads. | Google Cloud is HIPAA-compliant and BigQuery offers column-level security, data masking, and logging. Encryption at rest/in transit is automatic. Many biomedical datasets are hosted in BigQuery public listings (making compliance vetted by providers). | Used by genomics and bioinformatics teams that leverage Google Cloud's AI (TensorFlow on TPUs reading from BigQuery). Examples include the UK Biobank Research Analysis Platform (which uses BigQuery for some data querying needs) and many research projects sharing data via BigQuery. |
| AWS Redshift | Scales to petabytes; user chooses cluster node types/count. New RA3 nodes allow storage auto-scaling on S3 while keeping hot data on SSDs. Concurrency scaling feature adds transient capacity for bursts. | Excellent performance for analytical queries when data is modeled and sorted well. Particularly good for star schema or wide tables of clinical-genomic data. Can query across S3 (using Redshift Spectrum) for semi-structured or older data without loading it. | Uses SQL (PostgreSQL-like). Integrates tightly with AWS data ecosystem: S3 (ingest/export), AWS Glue (ETL), QuickSight (BI), SageMaker (ML). Needs more tuning than Snowflake/BigQuery (e.g., distribution keys, sort keys). Administration of cluster size is manual (unless using elastic resize). | Compliant as part of AWS's HIPAA-eligible services. Offers encryption, VPC, IAM controls. Many pharma deploy Redshift in a validated AWS environment with audit logging via CloudTrail. Can use AWS Lake Formation for fine-grained access governance across Redshift and data lake. | Widely adopted by pharma that built cloud data lakes on AWS. For instance, Moderna, which is all-in on AWS, used Redshift for some of its analytics. AZ (AstraZeneca) has spoken about using Redshift to integrate research and clinical data. Some are migrating to Snowflake for ease, but Redshift remains prevalent for companies fully on AWS. |
| DNAnexus | Highly scalable cloud platform (leverages AWS and Azure infrastructure under the hood). Can elastically scale compute for large analysis jobs and stores data in scalable cloud storage (S3, etc.). | Optimized for NGS pipelines and large-scale computation – can run thousands of analysis jobs in parallel (e.g., one per genome). I/O optimized for large bioinformatics files. Performance is high for both compute and data throughput, thanks to specialized tuning for genomics. | Provides APIs, SDKs, and a web portal. Custom tools can be integrated via Docker containers. Not a SQL database – integration is via exporting data or using DNAnexus's API to fetch results. Great for pipeline orchestration and data management; less for ad-hoc querying (often you'd export summary results to a warehouse). | Designed with compliance in mind: offers audit trails, user permission controls, encryption, and is certified for clinical use (CAP/CLIA, CLIA for labs, HIPAA, GDPR) ([6]). Many pharma use DNAnexus in regulated genetic testing or companion diagnostics development due to its strong security and validation support. | Moderate adoption: pharma R&D groups use it to manage collaborative genomic projects (e.g., Regeneron's big sequencing initiatives, government partnerships). Also used in clinical genomic testing labs that serve pharma trials. DNAnexus was used in the UK Biobank RAP for scalable analysis. It may not be as ubiquitous as general tools but fills a niche for those needing an all-in-one secure genomics platform. |
| Illumina BaseSpace | Scales with Illumina Cloud – as sequencing throughput grows, users can increase storage subscription. Compute scales by using Illumina's cloud resources or local DRAGEN FPGA cards for on-site acceleration. Generally handles hundreds of concurrent sequencer outputs easily. | Delivers fast secondary analysis (alignment, variant calling) especially with DRAGEN – can process a whole genome in hours. For data storage/retrieval, performance is optimized for bulk operations (upload/download) and streaming from sequencers. Querying within BaseSpace is limited to its interface (filtering runs, etc.), not for analytical SQL/ML jobs. | Very easy integration for labs: direct instrument connection, web UI for analysis setup, and built-in visualization for results. API available for automation and data export. However, to do custom analysis beyond provided apps, data likely needs to be exported to other environments. | Built-in compliance: BaseSpace is built to meet HIPAA and GDPR, with capabilities like user access controls, audit logs, and regional data residency. Illumina regularly undergoes security audits (ISO 27001 certified) and ensures compliance with genetic data regulations. | High adoption in sequencing labs and core facilities, some of which serve pharma projects. Many pharma that don't want to build NGS infrastructure just use BaseSpace for primary analysis and then transfer key results to internal systems. For example, a pharma might run a drug-response experiment's sequencing through BaseSpace, then import the variant data into their own databases for downstream analysis. |
Key Takeaway: In genomics, it's common to use a combination of tools: e.g., using Hadoop/Spark for raw NGS processing, a cloud warehouse for integrated analysis with clinical data, and specialized platforms for pipeline management. Each technology has unique strengths – Hadoop handles raw big files cheaply, Spark enables complex analytics, Snowflake/BigQuery provide easy sharing and querying, and platforms like DNAnexus/BaseSpace handle domain-specific needs (pipelines, compliance). Data engineers select technologies based on the use case: for instance, they might use Spark on AWS EMR to joint-call variants from 10,000 genomes, but then load result summaries into Snowflake for researchers to query. The right combination ensures that genomic big data is processed efficiently and made accessible to scientists while meeting security and compliance requirements.
Clinical Trials Data Management and Analytics
Clinical trials generate diverse data – patient demographics, treatment assignments, eCRF (electronic case report form) data, lab results, medical images, adverse event reports, and increasingly data from wearables or patient apps. These come from multiple sources (EDC systems, central labs, imaging systems, ePRO devices, etc.) and must be consolidated for analysis and regulatory submission. Key requirements include flexibility to handle different data schemas per study, scalability to manage data from large trial programs or phase IV studies with thousands of patients, and compliance with regulations (21 CFR Part 11 for data integrity, ICH guidelines, GDPR for patient data, etc.). Technologies in this space focus on integrating, cleaning, and analyzing heterogeneous datasets securely:
-
MongoDB for flexible trial data capture: Clinical trial data structures can vary widely between studies (different case report forms, new endpoints). MongoDB's schema-less JSON document model is well-suited for storing such evolving data. For example, a trial's patient record can be a single document with nested sub-documents for each visit or form, which can easily differ between studies. The FIMED project highlighted this use: it uses MongoDB as the core for managing biomedical and clinical trial data because of flexibility in dealing with the dynamic nature of clinical datasets ([7]). New fields can be added without altering a fixed schema, and missing fields simply don't appear rather than breaking a schema. Scalability is achieved via MongoDB sharding – e.g., sharding by study or by site can distribute data and load across a cluster. As one source notes, MongoDB's cluster configuration makes it "a great choice if scalability… is required" for clinical data management ([8]). In terms of performance, MongoDB can quickly query on indexed fields (e.g., find all patients with a certain adverse event) and handle high insert rates (useful if data is streaming from wearable devices). However, complex joins (e.g., cross-patient comparisons) require either application-side logic or moving data into an analytics platform. Thus, MongoDB often serves as an operational data store for trial data capture and a source for downstream analytics rather than the analytics database itself.
-
Hadoop and Spark for large-scale trial data processing: When aggregating data across many studies or incorporating external real-world data into trial analysis, big data frameworks are valuable. HDFS can act as a landing zone for diverse raw datasets – for instance, dumping all clinical trial data extracts, medical coding dictionaries, and maybe related EHR data for analysis. Spark can then perform transformations like merging a trial's multiple data sources (clinical data, lab data, etc.), or pooling data from multiple trials for meta-analysis. An example might be using Spark to combine patient-level data from dozens of oncology trials to look for patterns in placebo responses. Spark is also useful for processing unstructured or semi-structured trial data: imagine parsing thousands of PDF serious adverse event reports or medical imaging metadata – Spark can distribute this task. Additionally, with the rise of digital trials, streaming data (like continuous glucose monitor readings in a diabetes trial) might be processed with Spark Streaming to summarize into hourly or daily metrics per patient. The output of Spark ETL jobs typically goes into a structured format (Parquet files on a data lake, or directly into a warehouse). Spark's ability to handle large joins and groupings means it can implement things like cross-trial cohort selection (finding patients across many trials who meet certain criteria) or simulate trial outcomes using large real-world datasets for synthetic control arms.
-
Cloud Data Warehouses (Snowflake, Redshift, Synapse) for integrated analytics: After data from a trial is cleaned and standardized, it is often loaded into a relational warehouse for easy querying, monitoring, and reporting. Snowflake is increasingly popular for this due to its ease of use and scalability. A trial data warehouse might contain tables like patient, visit, lab results, adverse events, etc., possibly conforming to a standard data model (such as CDISC SDTM for regulatory submissions). Having this in Snowflake allows data managers and statisticians to run quick queries (e.g., how many patients have missing data in a certain visit) and use BI tools for operational dashboards (like enrollment graphs). The example of loading ClinicalTrials.gov XML data into Snowflake and analyzing it in ThoughtSpot shows how Snowflake can ingest semi-structured data (XML/JSON) and make it queryable for insights. AWS Redshift serves a similar role: companies might use Redshift to house a "clinical data mart" where data from the EDC, CTMS (Clinical Trial Management System), IXRS (randomization system) etc., are brought together. Redshift can join these efficiently if the schema is well-designed and supports integration with QuickSight or Tableau for visualization. Azure Synapse (with its integrated SQL pools) is often used when trial data is already in Azure – for example, ingesting data into Azure Data Lake Storage and using Synapse to create external tables over it or load it into dedicated SQL pools for fast querying. Synapse can also connect to Power BI for interactive dashboards (like a dashboard for trial query resolution status by site). A real-world example is using Synapse to combine operational data and provide real-time insights: a case study describes a pharmacy chain using Synapse to revolutionize inventory fulfillment, which is analogous to how a trial sponsor might use Synapse to unify site supply data and patient enrollment data in one place for decision-making. All these warehouses support compliance needs by offering auditing, role-based security, and the ability to restrict access to sensitive data (e.g., blinding certain treatment data until database lock).
-
Informatica for ETL and data quality: Informatica is a mainstay in pharma for moving and cleaning data. In clinical trials, it might be used to pull data from an EDC (like Medidata Rave or Oracle InForm) on a schedule, apply transformations (like mapping lab units to standard units, coding adverse event terms to MedDRA), and then load into a warehouse. This ETL process is auditable and version-controlled, important for regulatory compliance. Informatica PowerCenter (on-prem) has been used for years in pharma – some companies are now using Informatica Cloud (IICS) for the same purpose. Data quality rules can be applied to catch issues early – e.g., flag if a patient's birthdate is clearly incorrect or if there are duplicate records. Informatica's MDM for investigators and sites can ensure that if the same site participates in multiple trials, it's recognized as the same entity in analytics, enabling site-level performance analysis across trials. Pfizer's case of automating 99% of data mappings using cloud integration likely refers to using Informatica to handle the complex mapping of fields from various sources to a unified model in Snowflake, illustrating how much manual effort can be saved in trial data integration. Additionally, workflow orchestration tools like Informatica or Apache Airflow coordinate these data flows so that, for example, once daily all new EDC data is loaded and consistency checks are run.
-
Graph databases for trial connections and oversight: While not as common, graph databases can help in specific scenarios, such as oversight of a complex trial ecosystem. Neo4j could model relationships like investigators to trials to protocols to publications. For a company running many trials, a graph query might help find, say, all trials that involve a certain biomarker and the investigators common to those trials – useful for planning new studies or publishing strategies. Moreover, graphs can help with standards mapping: one could make nodes for data elements and connect them to CDISC standard definitions (SDTM variables), then link those to submission documents. This was hinted at in the Neo4j opinion piece where knowledge graphs help meet standards like SDTM and ADaM by organizing metadata. In trial data cleaning, a graph could represent all queries (data issues) and their relationships to sites and monitors, allowing analysis of query patterns (though this could also be done in SQL). TigerGraph might not typically be used for clinical trial data, but if a company wanted to analyze the network of patient referrals into trials or detect fraudulent behavior (unusual patterns of data entry across sites), graph analytics could assist.
-
Veeva Vault (Clinical): Veeva Vault provides a suite of clinical applications (Vault EDC, Vault CTMS, Vault eTMF, etc.) on a unified platform. It's worth noting that Veeva Vault for clinical is increasingly adopted to have a single platform for trial operations and data capture. For example, Vault EDC captures patient data (which can then be extracted for analysis), Vault CTMS tracks operational metrics (enrollment, monitoring visits), and Vault eTMF manages documents. Vault's advantage is built-in compliance (Part 11, validation) and integration – e.g., an issue noted in CTMS can trigger a query in EDC. For a data engineer, Vault is often a source system: one might use Vault APIs to pull operational data (like how many queries per site, which can feed into a quality metric analysis in the data warehouse). Vault can also push data; for instance, Veeva has a capability to connect Vault EDC data to analytics solutions. While Vault isn't where you do big data analysis, it's important in the ecosystem and ensures that the data collected is high-quality and audit-ready. Data engineers need to factor in Vault when designing data flows – often building pipelines to take daily snapshots of Vault data for reporting outside the platform.
Example: A data engineering team is consolidating data for a portfolio of clinical trials in a rare disease. Each trial uses a different EDC vendor and collects some unique endpoints. The team creates a data lake on AWS S3 to accumulate all raw datasets (exports from each EDC, lab CSVs, imaging assessment spreadsheets, etc.). They use AWS Glue (Spark) jobs to transform each trial's data to a common format: for example, map all adverse event datasets to a standard structure (with patient ID, event term, severity, etc.). They also use Spark to integrate external data – say they have a registry of historical patients as a comparator – merging it with the trial data for analysis. After cleaning and harmonization, they load each trial's structured data into Amazon Redshift. There, they have defined common tables (following SDTM domains like Subject, Lab, Adverse Events, etc.). They also include in Redshift some operational tables: one from Veeva Vault CTMS listing all investigator sites and their activation dates, and one listing all open queries from their data cleaning (perhaps coming from Vault EDC or another EDC via export). With all data in Redshift, they build a set of dashboards in Tableau: one for trial managers to track enrollment and data quality by site (using CTMS and query data), and one for medical monitors to review safety data across all trials (aggregating adverse events and lab abnormalities). The medical monitor can, for example, quickly run a query in Tableau (which hits Redshift) to see all serious adverse events in a certain category across the three ongoing trials, something that would be tedious if each trial's data were siloed. For regulatory submissions, the data engineers also produce SDTM datasets – these are generated by further transformation jobs (which could be done in Spark or with SAS if required by biostats) drawing from the integrated warehouse data. Throughout, patient privacy is maintained by using trial-specific IDs (no direct identifiers in these systems), and all access to the Redshift warehouse is controlled (read-only accounts for analysts, etc.). The end result is a much more efficient insight generation process: leadership can see combined data in near real-time (daily refresh) rather than waiting for end-of-study reports, and the team can identify cross-trial trends (like a lab test that's consistently borderline in this patient population) to inform future study design.
Comparison: Technologies for Clinical Trial Data
| Technology | Strengths in Clinical Data Use Case | Weaknesses/Considerations | Real-World Adoption |
|---|---|---|---|
| MongoDB (Document DB) | Flexibility: Handles evolving schemas without upfront changes. Can store all data for a patient or visit in one JSON, including nested forms. Great for unstructured data (notes, patient diaries via JSON). Scales out for large trials or many studies via sharding. Fast iteration: New forms or fields can be added mid-study easily ([7]). | Not optimized for multi-record analytics or heavy joins (difficult to do cross-patient aggregation in MongoDB alone). For analysis, data often has to be exported to SQL or Spark. Lacks built-in support for transactions spanning many documents (though rarely needed in read-heavy clinical data). Requires careful design of document structure for efficient queries (and indexing of key fields). | Adoption: Some pharma use Mongo for specific needs like capturing patient-reported outcomes or wearable data where schema varies. Also used in translational research platforms linking clinical and omics data (Sanofi's translational medicine platform uses MongoDB for flexibility ([7])). Not typically the sole repository of all trial data (EDC systems usually have their own DB), but sometimes a secondary store for integration. |
| Hadoop & Spark | Scalability: Can crunch very large integrated datasets (all trials together, or trial data plus external real-world data). Versatility: Can process images (with Spark image libraries), NLP on text (eligibility criteria, protocol deviations), and traditional tabular data in one environment. Speed for ETL: Spark can transform and combine millions of records quickly (e.g., building a subject data mart from raw capture data). | Requires engineering expertise; not as user-friendly for clinical staff. Usually used by data engineers behind the scenes, with results fed into easier tools. On-prem Hadoop clusters for clinical data must be secured/validated, which can be a big effort. Many orgs instead use cloud Spark which offloads some of this but then must ensure patient data is protected in cloud per regulations. | Adoption: Large pharma with data science teams apply Spark to clinical datasets for advanced analyses (e.g., using Spark to analyze years of clinical data to design better trials – a kind of trial meta-analysis). Companies like IQVIA (CRO) use Spark in their platforms to handle diverse data sources. Spark is also used in risk-based monitoring solutions to analyze data in near-real-time across sites. |
| Cloud Data Warehouse (Snowflake, Redshift, Synapse) | Unified analysis: Once trial data is in a warehouse, it's easily queryable with SQL – vital for biostatisticians and data managers who may not be coders. Excellent for generating regulatory listings, tables, and graphs. Scalable and concurrent: Can handle multiple studies' data and many users (medical monitors, data managers) querying at once. Integration: Can join clinical data with finance (budget vs actual enrollment costs) or with reference data (MedDRA, WHO Drug dictionaries). | Getting data into the warehouse requires ETL or pipelines (the "heavy lifting" often done by tools like Informatica or Spark). Warehouses are schema-based – must design data models (often one per study or a universal model). Inflexible for late-arising changes unless model is designed to accommodate (e.g., a new data domain might need new tables). Cost can accumulate with many users running large queries (though Snowflake's usage model and Redshift's reserved instances mitigate this). | High adoption: Nearly all large pharma have a clinical data warehouse or data mart, historically in Oracle or Teradata, now moving to cloud (Snowflake is gaining traction). For example, Novartis has spoken about using a centralized data lake and warehouse for all clinical data to enable analytics across programs. Pfizer's mentioned migration to cloud data warehouses for digital trials. Synapse is used by CROs for providing clients trial dashboards. |
| Informatica (ETL/MDM) | Robust ETL: Connects to EDCs, labs, etc., using pre-built connectors, and can transform data into submission-ready formats. Visual flows make it easier to maintain compared to hand-written code. Data quality & lineage: Can enforce business rules (e.g., no inconsistent dates) and document how source data transforms, crucial for audits. Master data management: Ensures consistent identification of investigators, sites, and even patients (if a patient appears in multiple studies, an MDM can link them in analysis, respecting blinding). | Traditional and can be expensive; requires skilled developers (though easier than raw coding). Some organizations moving to open-source or cloud-native ETL (Airflow, AWS Glue), but those may lack some of the out-of-box functionality. MDM implementations need governance – e.g., matching algorithms for HCPs need tuning. Initial setup of mappings for a big study can be time-consuming (though reusable). | Very high adoption: Virtually every big pharma has used Informatica PowerCenter in their clinical data warehouse pipelines historically. Now many are using Informatica Intelligent Cloud Services for cloud data integration as they adopt Snowflake or Synapse. Also, industry standards like TransCelerate's protocols have Informatica mappings available, indicating widespread use. MDM is used at companies like GSK, J&J to have global investigator databases, which feed both clinical and commercial systems. |
| Neo4j / Graph DB | Relationship insights: Can model, for example, how trials connect via common investigators or sites, or how protocol criteria overlap. This can help planning (find investigators who did similar studies) and oversight (find site clusters with many issues). Standards mapping: Graph can link data items to standard definitions (like SDTM or CDISC Controlled Terms), potentially automating metadata management. Query flexibility: Some queries are simpler in Cypher than SQL when they involve traversing varying lengths of relationships. | Niche use in clinical operations; not a replacement for core trial data processing. Would require loading data from source systems to the graph, meaning duplicate data maintenance. People with graph skills are fewer than those with SQL, so uptake may be limited to specialized analytics teams. Also, graph results might be achievable by other means (a well-designed SQL schema can answer many of the same questions). | Emerging: A few pharma have experimented with knowledge graphs linking R&D data; for example, linking trial data with scientific literature to aid in hypothesis generation (AstraZeneca has done work in this area). Graphs for operational analytics (like site network analysis) are more at concept stage. However, as noted by Neo4j's own materials, there is interest in using knowledge graphs to manage clinical metadata and support automation. |
| Veeva Vault (Clinical) | Unified platform: All trial operations (from document management to study data capture) integrated, reducing silo issues. Compliance built-in: Validated environment with audit trails and role-based security – using Vault can satisfy regulators that proper controls are in place without custom IT solutions. Connectivity: Vault provides APIs/exports so that data (operational metrics, certain EDC data) can flow into analytics systems. Speeds up tasks like clinical trial disclosure, since data in Vault can be repurposed for registry submissions. | Vault is transactional/operational, with streamlined reporting that can be extended via Veeva Nitro – for bulk analytics, one typically extracts data to dedicated tools. If using Vault EDC, complex analyses are complemented by external analytics platforms. Vault's deep platform integration means organizations benefit from a unified ecosystem, and Vault offers open APIs for data portability. Migrating from legacy systems to Vault is a strategic transition – many big pharma are mid-migration (thus have hybrid environments where data engineers must pull from multiple systems). | High and growing adoption: Many sponsors (large and mid) are implementing Vault for eTMF and CTMS, with Vault EDC also gaining traction. As an example, Vault has been adopted by over 250 companies for clinical operations. This means data engineers increasingly interface with Vault – e.g., pulling KPI data for portfolios. Companies like Gilead consolidated to Vault and reported improved inspection readiness. Data engineers might find Vault data as a new source to integrate, gradually replacing older CTMS or eTMF databases. |
In summary, managing and analyzing clinical trial data requires an ecosystem: operational systems (like EDC, CTMS, Vault) to collect and manage data, and analytics systems (lakes, warehouses, big data tools) to aggregate and derive insights from that data. The technologies described above illustrate how data engineers can merge these worlds: using integration tools to bring data from the operational side into an analytics environment, using big data tools to handle scale or complexity, and then using warehouses and BI tools to deliver information to stakeholders. The outcome is better trial oversight (e.g., real-time enrollment dashboards), improved data quality (through centralized cleaning and monitoring), and the ability to maximize the value of trial data (for instance, combining data across trials to learn more about a disease). All of this must be done under strict compliance – audit trails, validation, privacy – since clinical data is highly regulated. The successful data engineer in pharma designs pipelines that are not only efficient and robust, but also transparent and compliant, enabling faster and safer clinical development.
Regulatory Data Management and Compliance
Pharmaceutical companies operate in a heavily regulated environment, generating large volumes of documentation and data for drug approvals and compliance. Regulatory data management covers the handling of submission documents (e.g., eCTD modules), correspondence with health authorities, tracking of commitments and product registrations in different countries, and ensuring all these processes meet regulatory requirements. Key needs include document management at scale, metadata tracking (of filings, variations, approvals), and compliance features like audit trails and electronic signatures. The data is often unstructured (documents, PDFs) but with a layer of structured metadata (submission dates, approval numbers, etc.). Technologies in this domain focus on content management, workflow, and integration of structured and unstructured information:
-
Veeva Vault (Regulatory): Vault RIM (Regulatory Information Management) has quickly become a leading solution to manage regulatory content and data. It provides a unified platform for authoring, reviewing, approving, and archiving all regulatory documents, and tracking the status of submissions and approvals worldwide. Vault's platform is inherently designed for compliance – it meets validation requirements and provides a full audit trail on documents and data changes. For example, Vault Submissions and Submissions Archive manage the lifecycle of an eCTD submission, from planning through dispatch to health authorities, to archival of the exact sequence submitted. Vault can even publish in eCTD format and validate it, reducing the need for separate tools. What differentiates Vault is that it merges content and data: a submission in Vault includes the documents (content) and related metadata (e.g., submission type, region, products, indications). This means a data engineer can retrieve not just a PDF of a clinical summary, but also structured data like which product and indication that document was supporting. Vault's connections allow linking across domains – e.g., linking a regulatory commitment (post-approval study requirement) to the clinical trial in Vault Clinical that fulfills it. The Vault Platform underlying these apps uses a NoSQL content repository that can handle millions of documents, and an object data model for metadata (e.g., an object for "Submission" with fields for country, date, status, etc.). It's highly scalable (Boehringer Ingelheim moved tens of millions of documents into Vault as per Veeva case studies) and accessible globally (cloud web interface, with performance optimized via content delivery networks). For data engineers, Vault often becomes the golden source for regulatory data: one might use Vault's API or reports to extract, say, a list of all approved indications per country, or all submission dossiers pending approval, and integrate that with other enterprise data (like linking to manufacturing launch dates).
-
Document management systems (OpenText/Documentum) and content warehouses: Before Vault's rise, many pharma used Documentum-based systems (often heavily customized) for regulatory document management. Some still do. These are essentially large-scale document databases with controlled vocabularies and metadata tagging. They can handle huge volumes of files with version control. Data engineers might interact with them via SQL-like queries on the metadata database (e.g., find all documents of type "Clinical Study Report" for a given product). Documentum is on-prem typically, which some companies prefer for control. However, the industry trend is towards Vault or other cloud solutions. Some companies have also implemented shareable content libraries in structured formats (e.g., using XML backbones like SPL for label content), but these are more niche.
-
Relational databases for registration tracking and commitments: Often alongside the document repositories, companies maintain structured databases for regulatory tracking. For example, a Registrations database that lists every country where each product is approved, including details like approval dates, local license numbers, etc. Or a Commitments database that tracks all promises made to regulators (like conducting a post-market study by a certain date). These might be custom applications on Oracle or SQL Server. Data engineers might pull data from these to integrate with business intelligence tools – e.g., to ensure manufacturing or supply chain is aware of upcoming new market launches (from the registrations DB) or that pharmacovigilance is aware of certain commitments (like special monitoring). Some companies have moved this functionality into Vault RIM (Vault Registrations, Vault Commitments modules), but others have legacy systems. A cloud alternative is to use a platform like Salesforce to track health authority interactions and commitments (some use the Salesforce-based product Veeva CRM – commonly for medical or commercial – in regulatory as well). Regardless, structured regulatory data often ends up in a data warehouse for enterprise reporting (e.g., how many submissions were on-time vs late, how many approvals received this quarter, etc.).
-
Spark and NLP for regulatory intelligence: A growing area is applying text analytics to regulatory documents and correspondence. For instance, using NLP on approval letters to extract key requirements, or analyzing trends in questions asked by regulators across different submissions. Spark can be used to process a large corpus of such documents. A company might feed in hundreds of PDF feedback letters and use Spark with an NLP library to categorize the issues raised by authorities (quality-related, clinical-related, etc.) to identify common problem areas. Similarly, Spark could help analyze public datasets like FDA guidelines or EMA assessment reports to support regulatory strategy – essentially big data approaches to regulatory intelligence. A concrete example: training a model on past deficiency letters to predict what sections of a new submission might get questioned. While this is not yet a mainstream practice, research exists exploring knowledge graphs and NLP for pharmacovigilance and regulatory text, and some companies are likely experimenting with it to gain an edge in submission preparedness.
-
Graph databases for regulatory knowledge management: There is potential to use graphs to link regulatory information. For example, linking a drug to all its submissions, and those submissions to the documents and to the regulators involved. One could then query "show me all submissions worldwide that included document X (like a certain study)" to see reuse, or "what variations to product Y have been approved after initial approval and what were their outcomes?" Neo4j could capture entities like products, variations, countries, and decisions, allowing multi-hop queries easily (across product → submissions → decisions). Also, regulatory processes often involve complex relationships (e.g., a manufacturing site is referenced in multiple product submissions – a graph could quickly show all products impacted if that site has an issue). While much of this can be done with relational databases, graphs might simplify some many-to-many traversal. Some regulators themselves are exploring graphs – the FDA's substance and facility registry is essentially a graph of relationships. On the industry side, given Amy Hodler's article about supply chain graph tech, similar thinking might extend to regulatory compliance networks.
-
Compliance and validation tooling: Ensuring all these systems meet regulatory requirements is crucial. Electronic signature and audit trail capabilities are a must (provided by Vault and Documentum by default). Access control down to document sections or fields sometimes needed (for instance, restricting access to unblinded data only to certain pharmacovigilance folks pre-approval). Tools that help manage user roles at scale (especially across many countries' affiliates) are part of the ecosystem. Also, data engineers often need to assist with regulatory submissions data like filling electronic forms (e.g., using tools or scripts to populate Form FDA 356h or eCTD XML backbone with correct metadata from databases, to avoid manual errors).
Example: A regulatory operations team at a pharma is preparing for multiple submissions (a new drug application in the US, a marketing authorization in Europe, and various Asian country submissions). All of the content (tens of thousands of pages of documents) is managed in Veeva Vault RIM. Authors and reviewers collaborate in Vault, which records all approvals of documents. As they build the submission, they also fill metadata in Vault (like grouping documents into eCTD modules, assigning submission target countries). When ready, Vault's publishing tool generates the eCTD package (with XML backbones, folder structure, etc.), and this is submitted to regulators. Once submitted, the submission record in Vault is marked as "dispatched" on a certain date. The regulatory team then receives questions from FDA and EMA. They log these in Vault as well (say as tasks or additional records linked to the submission). The data engineering team comes into play by extracting data from Vault and other systems for oversight: for instance, they use Vault's reporting to pull a structured list of all open regulatory questions and commitments for each submission. They combine this with data from a tracking database that the local affiliates update (e.g., when approvals are received in each country). They load this into a Snowflake table which is then used to power a dashboard for management: it shows each product's global registration status (approved, pending, etc. in each country) and any outstanding obligations (questions to answer, post-approval studies, labeling updates needed). To populate this, they use an Informatica job that nightly queries Vault via API for any status changes (like new approvals or changes in submission state) and queries the affiliate tracking DB (which might be a simple SQL Server database or an Excel on SharePoint in smaller affiliates) for any new updates, then writes to Snowflake. On Snowflake, they also integrate data from manufacturing and supply chain: linking the planned approval dates to manufacturing readiness. This way, if a country approval is delayed, the supply chain team sees that on the dashboard and can adjust distribution plans. Separately, the data engineer also sets up a Spark NLP job to go through the text of all past deficiency letters the company has gotten for similar products. This job identifies the most common words and topics (e.g., many questions about "impurity specification" or "stability data"). They create a report for the regulatory scientists to ensure those areas are extra robust in upcoming submissions. Although this text mining is experimental, it provides insight that, for example, 80% of their letters had a question on shelf life justification – prompting them to proactively add clarity in current submissions. On the compliance side, every document and data change is already tracked in Vault, and the Snowflake integration is read-only so it doesn't alter any authoritative data (ensuring they don't inadvertently break compliance). All user access to the Snowflake dashboard is also audited (it contains some confidential strategy info, though not raw regulatory filings). In essence, the team has combined a specialized regulatory platform (Vault) for content and workflow with big data tools (Informatica, Spark, Snowflake) to gain a strategic overview and predictive capability, all while maintaining compliance.
Comparison: Technologies for Regulatory Data Management
| Technology | Role in Regulatory Use Case | Differentiators and Compliance | Real-World Adoption |
|---|---|---|---|
| Veeva Vault RIM | End-to-end regulatory content and data management: Used for authoring, reviewing, and approving submission documents; assembling submissions; tracking health authority queries and commitments. Serves as the single source of truth for what was submitted to whom and when. | Differentiators: Combines document management with structured data fields (e.g., submission metadata) in one platform. Provides full audit trail and Part 11-compliant e-signatures out of the box. Multi-tenant cloud model means upgrades (e.g., to handle new regulations) are frequent and shared across industry. Compliance: Validated by vendor for intended use; companies still do their own validation but effort is reduced. Security certifications (ISO 27001, etc.) and encryption are in place. | High adoption: Over 200 pharma and biotech use Vault for regulatory. Many top-20 pharma have either fully implemented or are in process. For instance, GSK, Novartis, and others have publicly spoken about moving to Vault RIM to replace legacy systems. It's becoming the de facto standard, meaning data engineers increasingly rely on Vault's built-in reporting or API rather than maintaining custom regulatory databases. |
| Legacy DMS (Documentum/OpenText) | Historically, managed regulatory documents and sometimes basic metadata. Often highly customized with workflows for review/approval and interfaces to publishing tools. Still in use at some companies as they transition to Vault. | Differentiators: Could be on-premises, giving companies direct DB access to data. Very configurable (but that led to heavy customization). Strong document management, but typically weaker in cross-document data reporting compared to Vault. Compliance: Also Part 11 capable with proper configuration; companies had to validate upgrades themselves. | Past ubiquity, current decline: 10 years ago almost all big pharma used Documentum-based solutions (e.g., CSC FirstDoc) for regulatory. Many still do, but they are migrating. Data engineers might still need to extract data from these (via SQL queries on Documentum's repository database, for instance) during migration or in hybrid environments. |
| Structured Regulatory DB (Registrations, Commitments) | Track structured info: where each product is approved, regulatory event dates, and commitments (like "Submit Study X results by 2024"). Often custom-built or vendor solutions (some used ArisGlobal Register in the past). Ensures no required action is missed and all health authority interactions are logged. | Provides a database view of regulatory status, which is easier to query and integrate with other systems than parsing documents. Helps generate reports like "list of approved indications per country" rapidly. Compliance in terms of data integrity is needed (audit changes to submission dates, etc.). If not integrated with content, risk of data/document mismatch (one reason Vault RIM which combines them is preferred). | Varied adoption: Many companies had an Oracle or SQL-based system; some still do if not fully on Vault. For example, a pharma might have an internal app for tracking global product registrations if they haven't implemented Vault Registrations module. Data from these often feeds into enterprise data warehouse for KPI reporting. Regulators also expect companies to know this info, so it's maintained somewhere even if just spreadsheets in smaller firms. |
| Spark/NLP for Regulatory | Analyze large sets of regulatory text: guidelines, submissions, correspondence. Used to glean insights (regulatory intelligence, common deficiencies, trends in agency focus) or to automate tasks (extracting data from text). | Innovative edge: Can repurpose big data tech to reduce manual review. E.g., automatically scanning all historical labeling changes to flag patterns. Spark's speed lets analysis that would take an army of humans become feasible. Compliance: Purely internal analysis, so main concern is confidentiality of regulatory documents (handled by running in secure environment). Not directly used for submissions, so not subject to regulatory scrutiny, but outputs might inform submission strategy. | Emerging: A few large companies have analytics groups applying AI to regulatory – e.g., using machine learning to predict approval likelihoods or to parse complex regulations. Not widespread in everyday regulatory operations yet (most work is still done by regulatory experts), but likely to grow as text analytics matures. For instance, the FDA itself is using AI to analyze comments and submissions; industry will follow to keep up. |
| Graph DB for Regulatory | Model relationships between regulations, products, sites, and changes. Query complex networks (e.g., which global licenses would be affected if Manufacturing Site Y has an issue?). Helps in impact analysis and knowledge management (linking related filings or tracking how an issue in one country might propagate globally). | Makes impact analysis much faster – a single query can reveal all dependencies. Good for visualizing regulatory network – useful in large orgs with many products and markets. Can link to supply chain graph (merge regulatory approval nodes with distribution nodes to see end-to-end). Compliance: Used for decision support, not official records, so mainly internal controls. Would need to ensure any data copied from validated systems to graph is kept in sync to avoid errors. | Niche but plausible: No public case of a pharma using Neo4j for regulatory tracking is well-known, but it's conceptually attractive. Some might be prototyping it for pharmacovigilance case linking or manufacturing change impact. Given Neo4j's promotion of knowledge graphs in life sciences, we may see adoption for regulatory intelligence in the future. |
| BI and Warehouse for KPIs | After core regulatory data is managed (in Vault or elsewhere), companies use BI tools (Tableau, Power BI) on a warehouse of key metrics: submission cycle times, approval success rates, etc. Data engineers feed these from RIM systems. | Allows regulatory management to have a dashboard (e.g., how many submissions planned vs delivered, how many filings in review, average approval time by region, etc.). Important for resource planning and identifying bottlenecks (like if one regulatory team is slower). Many warehouses combine regulatory with other functions (portfolio management, finance) for holistic view. | Standard practice: All big pharma have some form of regulatory metrics reporting. Tools like Spotfire or Qlik were historically used, now Power BI/Tableau are common. The data often comes from Vault or registration databases. E.g., a company might have a "Regulatory Scorecard" dashboard fed by their RIM, showing adherence to target submission dates, etc. This is not a specific tech stack but a typical deliverable data engineers support. |
Regulatory data management is perhaps less about "big data" volume and more about big complexity and strict compliance. The number of submissions and documents is large, but manageable with modern systems (it's big in the tens of terabytes, not petabytes). The bigger challenge is ensuring every piece of data is correct, traceable, and linked to its context. Tools like Vault have streamlined this by providing an industry-focused solution. Data engineers in this area often act as integrators and reporters: making sure regulatory systems talk to each other (and to other enterprise systems like manufacturing or safety), and that management has accessible insights (via reports/dashboards) into the regulatory process. The use of more advanced analytics (NLP, graphs) in regulatory is in early stages but holds promise for optimizing how companies prepare submissions and manage compliance on a global scale. Ultimately, by effectively managing regulatory data, pharma can accelerate approvals (getting medicines to patients faster) and avoid compliance pitfalls that could lead to sanctions or delays.
Pharmacovigilance and Drug Safety Analytics
Pharmacovigilance (PV) – drug safety monitoring – deals with collecting and analyzing data on adverse events (AEs) and other safety signals for drugs on the market (and sometimes in trials). This domain faces high volume data (millions of AE reports worldwide), variety (structured reports, call center logs, social media, literature), and the need for timely detection of safety signals. Big data technologies are increasingly vital for PV to identify potential safety issues earlier and comply with regulatory requirements for continuous monitoring. Key aspects include adverse event databases, signal detection algorithms, and integration of diverse data sources (clinical, post-market, literature).
-
Hadoop/Spark for adverse event data processing: Many companies historically relied on relational databases (like Oracle Argus Safety) to store adverse event case data. As data volumes grew and they wanted to mine data beyond simple case counts, they started exploring big data solutions. A notable example is leveraging open FDA data (FAERS – FDA Adverse Event Reporting System). The FAERS public dataset is large (over 12 million reports, 130 GB+). Spark is well-suited to crunch through this for pattern discovery. Open-source projects (like the one on OpenTargets) demonstrate using Spark and Scala to analyze FAERS and perform disproportionality analysis (calculating metrics like PRR, ROR to find drug-event pairs occurring more than expected). In-house, pharma companies can apply the same to their global safety data – which includes not only FAERS but also data from EudraVigilance (EU), their own patient support programs, etc. By using Spark (possibly on Hadoop HDFS or cloud storage), they can join datasets (e.g., incorporate drug exposure data to calculate rates) and run computationally intensive algorithms (like Bayesian shrinking or neural network models for signal detection) on the full dataset rather than small samples. Hadoop can store decades of safety reports cheaply, allowing retrospective analyses and ML training. Also, if integrating new data types (like free-text from physician reports or social media posts mentioning drug side effects), Spark's NLP capabilities can structure this and include it in signal detection. Companies like GSK and BMS have discussed using big data lakes for PV to enable advanced analytics and even shared data between companies for better signal detection (consortia like Observational Health Data Sciences and Informatics (OHDSI) push for analyzing combined healthcare data, which overlaps with safety).
-
Cassandra/MongoDB for real-time PV data capture: When building a safety surveillance system that ingests data from various sources continuously, NoSQL databases can help manage the flow. For example, if a pharma has a mobile app for patients to report side effects, that could stream data into a Cassandra cluster for immediate availability to safety staff. Cassandra's high write throughput and distributed nature ensure that even if tens of thousands of patients submit simultaneously, the data is captured. From there, it might be processed for insights, and later formally entered into the regulatory safety database. Similarly, MongoDB could store large collections of case narratives or social media posts pre-analysis. Some PV teams use Elasticsearch (not in our list) to index text of cases, but Mongo could serve as an intermediate JSON store for novel data types pending analysis.
-
Signal detection algorithms and platforms: Apart from in-house big data frameworks, specialized signal detection tools (like Empirica from Oracle) exist. However, those tools themselves now incorporate big data tech under the hood (Empirica Signal uses advanced statistical methods that require big data computing power for large datasets). Data engineers might implement custom signal detection pipelines with Spark: for example, computing observed vs expected incidence of events for each product every week, flagging those above a threshold. Spark MLlib or even custom code can do logistic regression or more complex modeling to adjust for confounders in observational data. The OpenTargets example used a likelihood ratio test via Monte Carlo simulation to confirm signals – something very computationally heavy that Spark handled by distributing the workload.
-
Graph databases for case linking and causality: PV data can be represented as a graph: patients (or cases) connected to drugs they took and events they experienced. Neo4j has been used to some extent for pharmacovigilance research, for instance creating a knowledge graph of drug-event relationships enriched with other biomedical data to explore causality hypotheses. A graph can help identify clusters of events that share common factors (like all cases where Drug A and Drug B were taken together and Event X occurred). It can also help de-duplicate cases (if two reports likely refer to the same patient incident, a graph similarity algorithm could catch that). TigerGraph pitched use cases like analyzing connections among patients, doctors, and opioid treatment facilities to find abuse patterns – analogous to finding patterns in how adverse events spread or correlate (e.g., if multiple patients from the same hospital report an event, is there a hospital factor?). In mainstream PV, this is still exploratory, but graph analytics might become more common as data volumes and complexity grow (especially with combination therapies where interactions form a network problem).
-
Integration of real-world data: Modern PV is not limited to spontaneous reports; it looks at electronic health records (EHRs), insurance claims, and even wearables. This is essentially big data – millions of patient records. BigQuery or Snowflake can be used to query such healthcare data to see if a safety signal appears in observational data (for example, do we see more heart attacks in patients on Drug X vs similar patients not on it?). In fact, the FDA's Sentinel Initiative is essentially a big data approach, using a distributed database across numerous data partners to monitor safety in claims/EHR data. Pharma companies replicate mini-Sentinels internally with their own data partnerships. Data engineers play a crucial role in these, using cloud analytics platforms to run queries on large healthcare datasets. For instance, a company might use Snowflake to host de-identified claims for 100 million patients and then run a logistic regression (via Snowflake's integration with Python or via Spark reading from Snowflake) to assess a risk. Such analyses complement traditional PV by providing incidence rates and risk quantification, whereas spontaneous reports are good for signal detection but not incidence.
-
Automated case processing and AI: Another big data aspect is using AI to automate parts of PV case handling. This includes NLP to auto-extract info from reports (many pharma are implementing AI to read patient or doctor narratives and code them into structured data). While much of that is done with NLP models (like BERT-based models), those models are trained on large datasets – which requires big data infrastructure (like using Spark or TensorFlow on GPUs) to train on tens of thousands of example cases. Once deployed, they also produce large datasets (every new case gets, say, an AI-generated severity score or suggested coding) which need to be stored and evaluated. Thus, data pipelines for AI in PV become a consideration – perhaps feeding results into a Cassandra store and then comparing with human decisions to continually improve.
Example: A pharma safety department wants to enhance their signal detection process. They have their internal safety database with structured adverse event reports for all their products (coming from Argus). They also have access to FAERS data and a large insurance claims database. They set up a Databricks (Spark) environment on Azure. Each week, they run a Spark job that takes all new cases from their safety DB (could be a dump to CSV or direct JDBC connect) and all new FAERS reports. The Spark job updates a running data lake of drug-event counts. It then calculates disproportionality metrics (like reporting odds ratios) for each drug-event pair, using both their data and FAERS combined to get a broad view. It uses the entire dataset (millions of reports) but because it's distributed, it finishes in an hour. The output is a list of drug-event pairs with statistics. These are written into an Azure Synapse table which the signal management team accesses via a Power BI dashboard, highlighting signals that exceed threshold. Meanwhile, another team focuses on claims data. They use Google BigQuery where a partnered claims dataset (with millions of patient records over years) is hosted. They create a BigQuery SQL to compute incidence of outcome events among patients on Drug A vs a control group. BigQuery's results feed into a Jupyter notebook where they apply an adjustment for demographics and output an estimated relative risk. This information (real-world risk estimate) is combined with the disproportionality signal in their internal review meeting. Additionally, they are piloting Neo4j to help with duplicate detection: they load all new case narratives into Neo4j with nodes for patients (de-identified by some key), drugs, and events. They run a graph algorithm to find clusters of cases that share multiple similarities (e.g., same reporter, similar event, same drug) that might indicate duplicate reporting of one physical event. Those clusters are flagged for case processing, to merge them appropriately. On the automation front, they also feed all narrative text through an NLP model (using a Python pipeline separate from Spark) to classify them (e.g., serious vs non-serious). The results are stored in MongoDB for quick retrieval in the case processing UI. Over time, as they trust the model more, they might fully automate closure of obvious non-serious cases with that model. For compliance, every signal detection run is documented; the Spark script is under change control, and the output signals are stored in a validated safety tracking system. Access to the raw data (claims, etc.) is limited to authorized epidemiologists and data scientists, and all patient data is de-identified. By combining these technologies, the PV team has a multi-layered safety net: traditional disproportionality for spontaneuous reports, real-world data analysis for context, and modern graph/NLP techniques to improve efficiency and accuracy of their pharmacovigilance activities.
Comparison: Technologies for Pharmacovigilance
| Technology | How It's Used in PV | Benefits and Differentiators | Considerations |
|---|---|---|---|
| Hadoop/Spark | Processing large adverse event datasets (company's own cases + external data). Running periodic signal detection computations (disproportionality, clustering) on all data. Also used for mining unstructured data (scan text for emerging issues, link AE data with large external datasets). | Can analyze the full dataset, not samples, improving signal sensitivity. Spark's speed allows more complex analyses (e.g., data mining algorithms, ML on cases) that wouldn't finish in reasonable time on a single server. Scalable as data grows (which is important as more real-world data and longer pharmacovigilance periods add up). | Requires data engineering and possibly data science expertise – traditionally PV departments are composed of pharmacists and physicians, so there can be a skill gap. Getting quality results requires careful prep (ensuring data from different sources is coded consistently, etc.). Also, any novel metrics from Spark analyses still need epidemiological evaluation – the tech can find signals, but human experts must assess causality. |
| Cassandra | Ingesting and storing high-speed incoming safety data streams (like patient app reports, device alerts). Also could be used to store intermediate results for real-time dashboards (e.g., a live count of events by category updating as data flows in). | Extremely reliable ingestion – won't easily choke on spikes of reports (important during, say, a product recall when reports might flood in). Decentralized – can keep a cluster running across geographies for resilience. For queries by key (like retrieve all events for patient X or all events for drug Y in the last day), it's very fast. | Not useful for complex querying – often you'd move the data to a warehouse or Spark for analysis. Primarily a pipeline component. Also needs maintenance of cluster. In PV, tends to be used by more tech-forward organizations; some may instead use cloud services (like Azure Cosmos DB or AWS DynamoDB) for similar needs to avoid self-managing Cassandra. |
| Neo4j / Graph DB | Linking safety data (drugs, events, patients, reporters) into a network to detect patterns like cliques of events or common factors in cases. Used for advanced signal detection or visualizing how signals connect (e.g., Drug A and Drug B share many adverse events in common – could indicate a class effect). | Reveals relationships beyond pairwise – e.g., finds that a combination of Drug X and Y appears in many serious cases, or that a certain reporter is connected to many cases for one company (could flag fraudulent reports). Graph algorithms can find communities of events that often occur together, suggesting syndrome-like side effects. Useful for exploring causal hypotheses (connect to gene or protein interaction graphs to see if two drugs interacting could explain an observed event). | This is a cutting-edge approach; interpretability and validation are challenges. PV experts may need training to understand graph outputs. Data integration is heavy (must have high-quality linking of entities). Also, not all signals need this – simpler disproportionality catches most obvious issues. So graph DBs might be most useful for complicated scenarios (polypharmacy, multifactorial adverse events). As such, convincing ROI for graph in PV can be hard unless a company has had unexplained safety issues that they believe graph could elucidate. |
| Snowflake/BigQuery (for RWE) | Analyzing large real-world datasets (claims, EHR) to quantify risks and investigate signals in a broader context. For example, once a potential liver toxicity signal is detected in spontaneous reports, querying a claims database to see if liver-related diagnoses are higher in patients on the drug vs similar patients not on it. | Brings denominator data – helps move from "disproportionate reporting" to actual incidence rates. Can adjust for population characteristics if data is rich. Snowflake/BigQuery can handle the volume and complex SQL of epidemiological studies (joining many tables: patients, meds, outcomes, comorbidities). BigQuery's parallelism can churn through national-scale data in seconds-minutes, enabling quick feedback during signal review meetings. | Healthcare datasets often require cleaning and understanding of clinical context, so data engineers must work closely with epidemiologists. Results may need statistical adjustment beyond SQL (which might require extracting to R or Python for advanced modeling). Privacy is critical – these analyses must use de-identified data and aggregate outputs to be compliant. Also, costs of querying large data can be significant – one must balance thoroughness with cost (e.g., pre-aggregate data if possible). |
| Machine Learning & NLP | Automating case intake (using NLP to extract info from narrative), prioritizing cases (predict which cases are serious or high-risk), and detecting anomalous patterns (outlier detection in data streams). E.g., using a classifier to triage social media posts that likely describe an AE vs noise. | Can greatly reduce manual workload – case processors spend less time on non-serious or well-known events if an AI flags them appropriately. ML can find subtle nonlinear patterns that rule-based methods miss, potentially catching early signs (though this is still an area of research). NLP is already improving data quality by standardizing how events/drugs are coded from text. | Must be rigorously validated – regulators expect decisions to be traceable, so black-box AI is approached cautiously. Often ML suggestions are used to assist humans, not make final decisions. Also, building these requires large training datasets – many companies collaborate or use public data to train, which is fine as long as it's not proprietary. Maintenance is needed as drug usage and reporting behavior change (models can become stale). Additionally, false positives from ML could overwhelm if not tuned – so it's a fine balance. |
Pharmacovigilance is evolving from a largely manual, case-by-case process to a data-driven, analytics-enhanced discipline. Big data technologies enable comprehensive analysis of all available evidence, bringing in real-world context and statistical rigor to safety evaluations. They also support automation, allowing safety scientists to focus on interpretation rather than rote tasks. The combination of# Big Data Technologies in Pharma: Use Cases, Implementation, and Comparisons
The pharmaceutical industry generates vast and diverse datasets – from genomic sequences and clinical trial results to regulatory documents, safety reports, and supply chain logs. Data engineers in pharma must choose appropriate big data technologies to store, process, and analyze this information at scale. This report explores key technologies – Hadoop (HDFS, Hive, HBase), Apache Spark, Cassandra, MongoDB, Snowflake, AWS Redshift, Azure Synapse Analytics, Azure Data Lake, Google BigQuery, Neo4j, TigerGraph, Veeva Vault, Informatica, DNAnexus, and Illumina BaseSpace – and how they are applied across major use cases. Each section focuses on a specific use case (e.g., genomics data analysis, clinical trials, regulatory data management, pharmacovigilance, manufacturing and supply chain, sales and marketing analytics), detailing which technologies are commonly used, how they are technically implemented, what differentiates them, and providing concrete examples. Comparisons are provided in tables for attributes like scalability, cost, performance, integration ease, compliance features, and real-world adoption, to help data engineers evaluate solutions.
Genomics Data Analysis and Bioinformatics Pipelines
Genomic and multi-omics data analysis in pharma involves processing massive sequencing outputs (DNA/RNA reads, variant files) and integrating results for drug discovery or precision medicine. Key challenges include scalability (handling petabytes of sequencing data), processing speed (aligning reads or calling variants across thousands of genomes), flexible pipelines, and compliance (securely handling potentially identifiable genetic data). Data engineers leverage a mix of on-premises big data frameworks and specialized cloud platforms:
-
Hadoop Distributed File System (HDFS) for large-scale storage: Genomic files (FASTQ, BAM, VCF, etc.) are enormous. HDFS provides distributed storage across clusters, making it feasible to store and process terabytes of sequence data in parallel. For example, biomedical research projects have utilized Hadoop to manage large volumes of NGS and clinical data ([1]). Apache Hive (SQL-on-Hadoop) can impose structure on variant data (storing variant calls in tables for query), and HBase (Hadoop's NoSQL store) enables fast random access to specific genomic records (e.g., retrieving all variants at a particular gene). While Hadoop's batch-oriented MapReduce model was historically used in genomics, modern pipelines favor more efficient in-memory frameworks.
-
Apache Spark for distributed computing: Spark is a cluster computing engine ideal for iterative algorithms and large-scale analytics. In genomics, Spark accelerates variant analysis pipelines by parallelizing tasks across cores or nodes. For instance, the GATK4 toolset from the Broad Institute offers Spark-based versions of key algorithms to speed up processing of large genome cohorts. Spark can run on Hadoop (using YARN) or in cloud-managed environments (Databricks, Amazon EMR, Google Dataproc). Specialized frameworks like ADAM and Hail build on Spark to provide genomic data models and APIs, enabling scalable genomic analyses (e.g., joint genotyping on thousands of genomes). Spark's in-memory processing provides major performance gains over Hadoop MapReduce, making it "one of the most promising technologies for accelerating pipelines". Its machine learning libraries (MLlib) also support advanced analyses (clustering variants, predicting phenotypes from genotypes, etc.).
-
Cloud Data Warehouses (Snowflake, BigQuery, Redshift) for multi-omics integration: After primary genomic analyses, results (variants, expression matrices, etc.) often need to be integrated with clinical and reference data. Cloud data warehouse platforms excel at aggregating results and enabling interactive analytics on genomic data combined with other datasets. Snowflake has been used as a bioinformatics data warehouse, providing a convenient SaaS platform to join genetic data with clinical phenotypes. Researchers demonstrated a Snowflake framework for storing diverse biological datasets and performing integrated analysis like disease variant filtering and in-silico drug screening. Snowflake's multi-cloud compatibility and near-zero maintenance appeal to pharma R&D teams – it runs on AWS, Azure, or GCP, reducing vendor lock-in risks. Features like secure data sharing and zero-copy cloning also facilitate collaboration (e.g., safely sharing a subset of variant data with external partners without duplicating it). Google BigQuery is similarly leveraged for large genomic datasets, aided by Google's ecosystem – for instance, BigQuery has native support for public genomic databases (TCGA, 1000 Genomes) and integrates with Google's AI/ML tools (TensorFlow, Vertex AI) for tasks like protein folding analysis. Amazon Redshift is often chosen if a company's infrastructure is AWS-centric – it integrates with AWS services (S3 for storage, AWS Batch or SageMaker for analysis pipelines) to facilitate genomic data processing. Redshift now supports semi-structured data and RA3 nodes with managed storage, but it may require more tuning than Snowflake/BigQuery for peak performance. In practice, pharma teams might stage genomic data files in a cloud data lake (S3 or Azure Data Lake) and use external tables or services like Redshift Spectrum or Synapse to query them as needed.
-
NoSQL and graph databases in genomics: Some genomic applications benefit from NoSQL or graph data models. MongoDB can store experiment metadata or gene annotations as JSON, offering schema flexibility for evolving datasets. HBase or Cassandra could store large key-value pairs like k-mer counts or variant calls keyed by genomic coordinate, supporting fast lookups in association studies. Neo4j appears in drug discovery knowledge graphs that include genomic information – for example, linking genes, variants, pathways, and diseases, which allows complex queries like finding drug targets associated with pathogenic variants. While NoSQL/graph databases are not typically the core pipeline tools, they can add value in organizing and querying genomic knowledge extracted from analyses.
-
Specialized Genomic Platforms: Many pharma rely on platforms like DNAnexus or Illumina BaseSpace for genomic data management and analysis. DNAnexus provides an end-to-end cloud platform for NGS data, offering scalable storage and compute, a library of bioinformatics tools, and secure collaboration features. It's built for scale – managing over 80 petabytes of genomic and multi-omic data on behalf of users ([6]) – and for compliance (audit trails, permission controls, and certifications for clinical use) ([6]). DNAnexus allows data engineers to focus on pipeline development rather than infrastructure. Illumina BaseSpace Sequence Hub connects directly to Illumina sequencers to stream data to the cloud for storage/analysis. It provides push-button DRAGEN pipelines (hardware-accelerated) for ultra-fast secondary analysis, with an interface that is easy for lab scientists. BaseSpace is designed to be secure and compliant (ISO 27001 certified, HIPAA compliant) with features supporting data encryption and controlled access. These platforms reduce the need to build in-house clusters, though data engineers often export results from them to integrate with broader data platforms (like warehouses or AI modeling environments).
Example: A pharmaceutical research team sequences tumor samples for a cancer drug trial (whole exomes for 500 patients). They use Illumina NovaSeq sequencers with BaseSpace to handle data capture and initial processing (alignment and variant calling with DRAGEN). As soon as each sample is sequenced, BaseSpace processes it and stores the resulting VCF (variant calls) and quality metrics. Data engineers then transfer the VCFs to an Azure Data Lake and use Azure Databricks (Spark) to run joint variant calling across all patients and perform quality filtering. They also use Spark's MLlib to cluster tumors by mutation profiles and identify mutation patterns associated with drug response. The consolidated variant data, along with cluster assignments and key clinical attributes, are loaded into a Snowflake data warehouse. In Snowflake, biostatisticians and bioinformaticians join the genomic data with clinical outcome data and run SQL queries to find correlations (e.g., does a particular mutation correlate with better response?). They use a BI tool to visualize results. Additionally, the team loads the data into a Neo4j knowledge graph linking variants to genes, pathways, and existing drugs. This helps them explore if patients with certain mutations might benefit from other therapies (by traversing connections between mutated genes and known drug targets). Throughout the process, patient identities are coded and all systems (BaseSpace, Azure, Snowflake) are configured for compliance (encrypted data at rest, access limited to authorized researchers). By combining specialized tools (BaseSpace) with general big data platforms (Spark, Snowflake, Neo4j), the team efficiently extracts insights from massive genomic datasets while maintaining data security and integrity.
Comparison: Technologies for Genomics Data
| Technology | Scalability | Performance | Integration Ease | Compliance Features | Adoption in Genomics |
|---|---|---|---|---|---|
| Hadoop (HDFS/Hive/HBase) | High horizontal scalability (add nodes to store petabytes; throughput scales with cluster size). Suitable for on-prem or IaaS clusters. | Great for batch processing of large files; MapReduce is reliable but slower than in-memory frameworks for iterative algorithms. Hive enables SQL queries on big genomic tables (e.g., variant frequencies across samples) but with higher latency (seconds-minutes). HBase allows millisecond retrieval by key (e.g., by genomic coordinate) on huge datasets. | Requires significant setup and cluster admin expertise. Integrates well with Spark and other Hadoop ecosystem tools (Kafka, Oozie), but not a plug-and-play solution. Many newer genomic pipelines prefer cloud storage for ease of use, though Hadoop remains useful for cost-effective on-prem storage/compute. | Secureable via Kerberos and Apache Ranger; can be kept entirely on-prem to satisfy data residency or internal policy. Fine-grained audits and validations need to be configured by the organization. Historically, satisfying regulatory validation on Hadoop was non-trivial (often handled by isolating it for research use). | Historically high for large projects (1000 Genomes, etc.). Many pharma maintained Hadoop clusters for omics in the 2010s; today, some have shifted to cloud or specialized platforms. Still used in certain high-performance computing environments or when large multi-omics data lakes are on-prem for cost or security reasons. |
| Apache Spark | Scales from a single server to large multi-node clusters. In-memory design speeds up with more RAM; for massive data, can spill to disk or use more nodes. Cloud-managed Spark (Databricks, EMR) allows dynamic scaling per job. | Excellent for large-scale transformations and iterative algorithms (machine learning, permutation tests) on genomic data. Far faster than Hadoop MapReduce for most tasks due to in-memory compute. E.g., joint genotyping 10,000 genomes is feasible with Spark but impractical with MapReduce. Also interactive via notebooks for moderate-size queries. | Offers APIs in Python, R, Scala, etc., making it accessible to bioinformaticians. Connectors exist for many storage systems (HDFS, S3, Azure Blob, GCS) and databases. Often used alongside Jupyter notebooks for analysis development. It does require coding; not a point-and-click tool, so analysts need programming skill or pre-built workflows (like GATK's Spark tools). | No inherent compliance module; relies on the environment. Can be deployed in secure clusters (with authentication, encryption). Logging can record data access/processing for audit, but it's not an out-of-box validated system (would be part of a validated process if used in regulated analysis). Typically more used in research/early development contexts, with final validated analyses done in SAS or other validated tools. | Widely used in genomics R&D. Many genomics pipelines (GATK4, ADAM, Hail) are built on Spark for scalability. Pharma R&D teams use Spark for secondary analysis, rare variant aggregation, polygenic risk score calculations, etc. In clinical genomics (e.g., diagnostic labs), Spark is used behind scenes for variant calling acceleration (e.g., partner solutions on DNAnexus). |
| Snowflake | Near-infinite scalability due to decoupled storage (on cloud object storage) and compute (Warehouses can be scaled up or clustered for concurrency). Handles petabyte-scale databases; multiple workloads can run in parallel by auto-scaling clusters. | High performance for analytic queries via columnar storage and adaptive optimization. Excellent at complex joins/aggregations across large tables (e.g., joining variant tables with phenotype tables). Automatic statistics and result caching improve repeat query speed. Not optimized for low-latency single-record lookups (not an issue for analytical workloads). | Very easy to use (true SQL support). Many integration options: bulk load from cloud storage, connectors for Python/R, integration with BI tools and Jupyter. Semi-structured data (JSON) support allows storing genetic variant annotations or gene panels in Snowflake for querying. Data sharing feature enables sharing datasets with external collaborators without data copying. | Strong compliance offerings: HIPAA-eligible and HITRUST certified; all data encrypted at rest and in transit. Supports network policies, user roles, and comprehensive logging for auditing. Many pharma validate their Snowflake environment for clinical or regulated data. Secure data sharing allows collaboration without giving raw data files (important when sharing genomic data that may be sensitive). | Rapidly growing in life sciences. Used as a central repository for multi-omics and clinical data in many companies and genomics startups. For example, one pharma uses Snowflake to integrate clinical trial genomics with clinical endpoints for analysis by biomarker teams. It's also used to host data marketplaces (e.g., population genomics data made available to researchers under governance). |
| Google BigQuery | Massive, elastic scalability (Google handles sharding/distributing automatically). Can query terabytes in seconds, and can scale to petabyte-range with proper partitioning. Serverless model means no cluster management – it scales per query load. | Extremely fast for scan-heavy analytical queries. Ideal for exploratory analysis on huge genomics datasets or querying integrated knowledge graphs (which Google often demonstrates with life science data). With BigQuery BI Engine or cache, can even do interactive dashboards on large data. Performance on extremely complex joins may require query tuning (flattening nested data, etc.), but the built-in optimizations are strong. | Standard SQL interface; supports nested and repeated fields which naturally fit things like variants (array of genotypes, etc.). Easy import/export with Google Cloud Storage. Integrates with Google's AI platform – BigQuery ML can even do regression or classification within the warehouse itself. Also has an extensive public dataset program (genomic and health datasets available to join in place). | Fully managed security: data encrypted by default, IAM controls for access. BigQuery has fine-grained access control down to columns. It's compliant with GDPR and can be configured for HIPAA (Google will sign a BAA for GCP services). Audit logs via Cloud Audit Logging track all query access. | Used by companies who are leveraging Google Cloud for analytics/AI. For example, Verily (Alphabet's life science arm) uses BigQuery for large-scale biomedical data. Some pharma use BigQuery to analyze real-world data and then join with internal data. In genomics, it's popular in research consortia (the CDC's SPHERES program for COVID genomics used BigQuery for analyzing national sequence data). |
| AWS Redshift | High scalability (petabyte-scale) especially with newer RA3 nodes that separate compute and storage. Can add nodes for more throughput or use concurrency scaling to handle spikes. Integrates with S3 for virtually unlimited overflow storage via Redshift Spectrum. | Very good performance for structured, repeated reporting queries on large data. For instance, aggregating 100 billion genomic data points is feasible if data is properly distributed. Sort keys and distribution keys help optimize specific access patterns (e.g., distribute by patient ID for patient-centric queries). Can handle many simultaneous queries with workload management. | Speaks PostgreSQL-like SQL. Has robust ecosystem integration on AWS: Glue for ETL, S3 for data lake, SageMaker for ML on data via Redshift connectors. Users often unload Redshift data back to S3 for Spark or others, or query external S3 data from Redshift Spectrum (useful for semi-structured genomics data). Needs DBA-like tuning (e.g., vacuuming, key selection) for best performance, more hands-on than Snowflake/BigQuery. | Mature security: can deploy in VPC, uses KMS for encryption, supports fine-grained access control and auditing via CloudTrail. AWS is HIPAA-compliant, and Redshift can be used in validated environments (with proper change controls). Many pharma have existing validated Redshift instances as part of their AWS workloads. | Widely adopted among AWS-centric organizations. For example, Regeneron's big sequencing initiatives in the cloud used Redshift for parts of their data warehousing (though they also use Snowflake now). Pfizer and others migrating from on-prem Teradata have used Redshift as a stepping stone or in parallel with Snowflake. It remains common for companies heavily invested in AWS who want a cloud data warehouse tightly integrated with their data lake. |
| DNAnexus | Highly scalable cloud platform (runs on AWS/Azure). Can launch massive compute clusters for parallel bioinformatics jobs and stores data in scalable cloud storage (manages tens of petabytes easily). Users can scale workflows to thousands of cores when needed, then shut down (pay-as-you-go). | Optimized for NGS pipelines: streaming data from sequencers, parallelizing tasks like alignment or variant calling. High I/O performance for reading/writing large BAM/FASTQ files from cloud storage. Jobs can utilize cloud instances with lots of memory or GPUs as needed, all orchestrated through DNAnexus. The platform also has optimized tools for common tasks (e.g., secondary analysis pipelines tuned for speed). | Provides a web UI, API, and SDK. Custom workflows can be built using WDL or Nextflow and run on the platform. Integration ease is moderate – it's easy to upload and process genomic data within DNAnexus, but integrating output to other systems requires using the API or downloads. However, partnerships (like with UK Biobank) show it can connect to Jupyter environments and user code execution. | Built with compliance front-and-center: platform is SOC 2 Type 2, ISO 27001 certified; many clients use it in GxP contexts. It offers audit logs, access controls, and can segregate data by project with controlled PHI access. Used in FDA's precisionFDA challenge environment, indicating trust in its security. Data never leaves unless exported by users. | Growing adoption for genomics-heavy workflows. Many genome centers, bioinformatics teams, and consortiums (like UK Biobank's RAP) use DNAnexus to let multiple parties run analyses on huge genomic datasets without each building infrastructure. Some pharma use it for companion diagnostic development (running clinical genomic analyses that must be audited). It's less used for non-genomic data. |
| Illumina BaseSpace | Scales automatically with number of sequencing runs – Illumina manages storage and compute provisioning transparently. Users typically subscribe for storage and pay per use of compute apps; Illumina's cloud can handle a sequencing center's output concurrently. | High performance for secondary analysis due to Illumina's DRAGEN acceleration (either on cloud FPGAs or fast instances). A whole genome can be aligned and variants called in under 30 minutes with DRAGEN. For data storage, BaseSpace can ingest a full flow cell of data directly from the sequencer over network, and provides reasonably fast download for users (multi-threaded). | Extremely easy for labs – minimal setup, just connect sequencer to BaseSpace account. Library of apps covers common analyses (alignment, variant calling, RNA-seq quantification, etc.). Limited integration outward – data can be shared via BaseSpace or downloaded; direct connection to other cloud systems requires using BaseSpace API or Illumina Connected Analytics (a newer offering for more custom analysis). So, integration with third-party tools may involve extra steps. | Illumina ensures compliance with HIPAA, GDPR (offers EU servers), and has audit logging for data access. BaseSpace has granular sharing controls (users must be granted access to projects). Supports signing Business Associate Agreements for clinical data. Many clinical labs use it in validated pipelines – Illumina provides documentation for validation. | High usage in any organization generating Illumina sequencing data and not wanting to maintain local storage/compute for analysis. This includes biotech/pharma for research sequencing, clinical labs for diagnostic sequencing, and large consortia for initial data handling. Pharma might sequence in BaseSpace then move variant results to internal systems for downstream analysis. BaseSpace has some competition (like Thermo's Ion Cloud for IonTorrent sequencers), but Illumina's market share makes BaseSpace a common component in genomics workflows. |
Key Takeaway: In genomics, data engineers often combine multiple technologies to address different needs – e.g., using Spark on HDFS for heavy-duty variant processing, a cloud warehouse (Snowflake/BigQuery) for integrating genomic data with clinical and other data, and specialized platforms (DNAnexus/BaseSpace) to handle raw sequencing and initial analysis with ease and compliance. Each technology has unique strengths – Hadoop for cost-effective on-prem storage and processing, Spark for fast distributed computing, Snowflake/BigQuery for easy sharing and analysis, graph databases for connecting biological knowledge, and domain platforms for pipeline management and compliance. By leveraging the right tools for each task, data engineers enable faster insight generation from genomic data while maintaining data security and regulatory compliance (critical when dealing with human genomic information). This ultimately accelerates target discovery, biomarker identification, and the development of precision medicines.
Clinical Trials Data Management and Analytics
Clinical trials generate diverse data – patient demographics, treatment assignments, eCRF (electronic case report form) data, lab results, imaging data, patient-reported outcomes, adverse events, and operational metrics (enrollment, monitoring visits, etc.). These come from multiple systems (EDC databases, central labs, imaging systems, ePRO devices, CTMS for operations) and must be consolidated for analysis, reporting, and regulatory submission. Key requirements include flexibility to handle different study designs and data schemas, scalability to manage large phase III or portfolio-level data, and compliance with regulations (21 CFR Part 11 for data integrity, ICH GCP for trial conduct). Technologies supporting this use case focus on integrating heterogeneous data sources, ensuring data quality, and enabling analysis in a controlled, auditable manner:
-
MongoDB for flexible trial data capture: Clinical trial data structures can vary widely between studies and change mid-study (new protocol amendments adding fields, etc.). MongoDB's schema-less JSON model is well-suited for capturing such evolving or study-specific datasets. For example, a trial's patient record could be stored as a document containing all forms and visits as sub-documents – if a new form is introduced, it can simply appear in new records without altering a global schema. The FIMED project (a flexible biomedical data management tool) highlights MongoDB's benefit in dealing with "the dynamic nature of clinical data" ([7]). It allows schema changes on the fly and can handle semi-structured data easily. Scalability is achieved via sharding – e.g., by study or site – enabling horizontal scaling across studies. This means a pharma could store dozens of trials' datasets in one MongoDB cluster and query them as needed. Performance is strong for retrieval of whole patient records or subsets of data (with appropriate indexes), which is useful in medical data review applications. However, complex cross-patient or cross-study queries (like a join of all patients over 65 across trials) are not as straightforward – those are typically done after exporting to SQL or using Mongo's aggregation pipeline (which, while powerful, can become complicated for heavy analytics). Thus, MongoDB often serves as an operational data store in trials: for ingesting data from various sources quickly and serving it to web applications or APIs (like a clinical data review tool), while the heavy-lifting analysis (like generating tables for a study report) happens in SQL-based systems after ETL.
-
Hadoop and Spark for large-scale trial data processing: When pharmaceutical companies want to analyze data across multiple trials or incorporate external real-world data alongside trial data, the volume and variety can become a big data problem. HDFS can act as a landing zone for massive combined datasets (for instance, pooling patient-level data from hundreds of trials to look for overall patterns or for synthetic control arms). Spark is then used to clean, standardize, and combine these datasets. For example, a company may use Spark to transform all trial datasets into a common model (mapping different terminologies to standard ones, aligning data formats). Spark is also used for analysis of aggregated trial data: a pharma may run a Spark ML algorithm to find predictors of dropout using data from many trials (lots of rows, many features). Another use is processing trial sensor data – e.g., in a trial where patients wear fitness trackers, Spark could aggregate billions of sensor readings into meaningful metrics (daily steps, sleep patterns) for analysis. Spark can dramatically speed up what used to be SAS programs running for days on one server by distributing the load. It also allows using Python/R libraries within a distributed context, which many biostatisticians find attractive for advanced analysis. A concrete scenario: analyzing 20 years of clinical trial data (~several TBs across all studies) to answer "How do placebo response rates change over time or vary by region in our CNS trials?" – this is something Spark can enable by crunching through all those datasets (after they've been standardized) and computing summary statistics. Historically, such an analysis would be so laborious that it might not be attempted. With big data tools, it becomes feasible to derive insights from the troves of past trial data (often called "data reuse" or "clinical data mining" in pharma).
-
Cloud Data Warehouses (Snowflake, Redshift, Synapse) for integrated analytics: After trial data is cleaned and aggregated, it's typically loaded into a relational warehouse for easy querying and reporting. Snowflake is a popular choice for modern clinical data warehouses because of its flexibility and concurrent access support. A company might maintain a Snowflake database where each clinical study's data resides in a schema (structured as per CDISC SDTM or company-specific data model). Statisticians and data managers can then query using SQL, or connect BI tools to create dashboards (e.g., a data cleaning dashboard that shows query rates by site). Snowflake easily handles moderately large trial datasets (say a trial with 10,000 patients, 1,000 data points each – well under a billion records) and can join them with reference data (e.g., protocol metadata or public disease databases). AWS Redshift similarly is used as the backend for clinical data marts at companies that already have AWS infrastructure. For example, after each trial database lock, the data might be pushed into Redshift for archival and future analysis across trials. Redshift's SQL and integration with AWS analytics services allow creation of combined datasets (like integrating pharmacovigilance data post-approval with the clinical trial data to study long-term outcomes). Azure Synapse Analytics is often used when the data lake strategy is on Azure – raw data lands in Azure Data Lake Storage, and Synapse's serverless SQL pools or dedicated pools query and join the data for consumption. Synapse also can directly connect to Power BI for interactive analytics. A case study described using Synapse to unify and analyze pharmacy inventory data in real-time, which is analogous to using Synapse to unify trial operational data (e.g., site supply, enrollment) for near-real-time analysis by trial managers. One advantage of these cloud warehouses is integration ease: they readily connect to analytics and visualization tools and support standard SQL, which is well-known to clinical programmers (who often know SQL via SAS PROC SQL or similar). They also handle security (e.g., roles for blinded vs unblinded data access) which is crucial in trials.
-
Informatica for ETL and data quality: Informatica (PowerCenter or IICS) is widely used to extract, transform, and load clinical trial data from source systems (like EDCs) into a warehouse or data lake. For instance, an Informatica workflow might connect to Medidata Rave via ODBC, pull incremental data, map coded terms to standard dictionaries, and load to a target schema. It's valued for its reliability and auditability – every data movement can be logged, which is important in GxP environments. It can also enforce business rules: e.g., check that all required fields are populated, or compare two data sources (double data entry comparisons). In addition, Informatica MDM might be used for master data in trials: common reference data like investigator profiles, site details, or even patient identifiers if linking trial data with other data. This ensures consistency across studies (e.g., investigator Dr. Smith in trial A and B is recognized as the same person). Pfizer's modernization using cloud integration likely involved Informatica handling myriad mappings from legacy data models to a unified model in the cloud, demonstrating its role in consolidating data across studies. Another Informatica use in trials is for data anonymization: before sharing patient-level data externally (like to collaborators or public databases), an Informatica workflow might mask identifiers and apply randomization to certain quasi-identifiers (there are specialized tools too, but Informatica could be part of that pipeline).
-
Graph databases for study relationships and oversight: While not mainstream, graph databases offer some novel capabilities in the clinical trial domain. For oversight, one could create a graph of sites and investigators and see connections (e.g., two studies that share sites or investigators – useful for identifying those with heavy workload or potential conflict). Also, linking trial data to scientific data via a graph can help identify cross-study trends: e.g., a knowledge graph that connects trial results, molecules, targets, and outcomes could help in finding why a set of trials failed (maybe they targeted related pathways). Neo4j's promotion of knowledge graphs in life sciences includes such use cases, and while most companies are early in this journey, a few are building R&D knowledge graphs that include clinical trial metadata (like endpoints, outcomes, patient segments) linked to preclinical and external data. Over time, if these graphs become comprehensive, data engineers might use them for query like: "find all trials in disease X that used endpoint Y and see what their results were" – something that could also be done with SQL but might be more naturally handled if all that info is in a graph with relationships labeled. Additionally, graphs could assist with protocol design: e.g., find criteria in past trials that led to faster enrollment by analyzing a graph of eligibility criteria and enrollment metrics (some researchers have indeed modeled eligibility criteria as graphs to compare across studies).
-
Veeva Vault (Clinical): Veeva Vault offers a suite for clinical operations (CTMS, eTMF, study start-up, etc.) and now even a Vault EDC. Vault stores both documents and structured data about the trial. For data engineers, Vault can be a source of operational data – for example, using Vault CTMS data on site performance (like how quickly each site enters data after a visit) to correlate with data quality metrics in the EDC. Vault eTMF is a source of truth for documents required for compliance; data engineers might not directly analyze documents, but ensuring that all required documents are in place can be tracked with reports. Vault's advantages are similar to those in regulatory: built-in compliance (every action is logged), cloud accessibility, and a unified platform linking different aspects (it can link a protocol document to the actual electronic forms used in EDC if within the same ecosystem). While analytic workflows might export Vault data to a warehouse, the trend is that more trial data and metadata reside in Vault, so data engineers increasingly will incorporate Vault's API or data feeds in their pipelines.
Example: A clinical data management team needs to clean and integrate data for a phase III trial and prepare analysis datasets. The trial uses an Oracle Clinical EDC and collects patient sensor data from a wearable. First, they use Informatica to ETL the clinical data: mapping the Oracle tables to standard SDTM datasets (creating tables for Demographics, Adverse Events, Lab Results, etc.). Informatica applies data quality checks (flagging any out-of-range lab values for review) and loads the transformed data into a Snowflake schema for that study. Meanwhile, the wearable data (huge JSON files) are stored in Azure Data Lake. They run an Azure Databricks (Spark) job to process this – aggregating raw sensor readings into daily summaries per patient (like average heart rate, step count). The Spark job writes these summaries into Snowflake as well (into, say, a "Daily Activity" table). Now Snowflake has all trial data: conventional eCRF data and novel sensor endpoints. Statisticians can connect with their preferred tools (JMP, R, etc.) via Snowflake connectors to analyze the data. They join, for example, adherence data from eCRF (when patients reported wearing the device) with the actual sensor data from Spark to check compliance. The safety team uses Power BI against Snowflake to monitor adverse events – they have a dashboard that shows accrual of adverse events by severity and treatment arm, updating whenever new data flows in (Informatica runs ETL nightly). On the operations side, data engineers also pull data from Veeva Vault CTMS – such as site enrollment numbers and query resolution times – into a small Redshift warehouse that the clinical operations team uses for reporting. They integrate that with finance data to see cost per enrollment. Finally, when the study is completed, the biostatistics team uses the Snowflake data to create analysis datasets (ADaM datasets for FDA submission). Those are exported out of Snowflake as SAS files for the regulatory submission (since the FDA still commonly receives SAS XPT files). Throughout, compliance is maintained: all transformations are done under change control (the ETL code is validated), Snowflake is in a validated cloud environment with access controls (unblinded data only accessible to certain users until database lock), and data transfers are encrypted. By using this mix – ETL tools, cloud warehouse, Spark for big data – the team was able to handle both traditional and high-volume data in a unified way and deliver quality data for analysis faster than in past trials where separate siloed systems were used.
Comparison: Technologies for Clinical Trial Data
| Technology | Strengths in Clinical Data Use Case | Weaknesses/Considerations | Real-World Adoption |
|---|---|---|---|
| MongoDB (Document DB) | Flexibility: Can adapt to any trial's data structure without upfront schema design. Great for unstructured or evolving data (e.g., genomic or imaging results attached to a patient). Rapid development: Changes in eCRFs or new data types can be ingested with minimal admin. Scales out for large studies or many concurrent studies. Useful for building APIs and web apps for data review (fetching whole patient JSON in one query). | Not optimized for heavy analytical queries across many records (lack of joins, complex aggregation is possible but not SQL-easy). For example, summarizing across all patients might require map-reduce or exporting data to a relational form. Also, many clinical data managers are more familiar with SQL, so a pure Mongo approach requires upskilling or specialized developers. Additionally, ensuring data integrity (foreign key-like constraints between forms, etc.) is left to the application layer. | Adoption: Some innovative trial sponsors or CROs use Mongo for specific applications like clinical data review portals or patient diary data capture. Most core clinical databases remain relational (Oracle, Medidata, etc.), but Mongo might mirror that data for flexible access. As trials incorporate more unstructured data (images, genomic sequences), MongoDB usage in trials could grow to store such data with metadata alongside standard data. |
| Hadoop & Spark | Big data integration: Efficient at combining data from many studies or external sources for cross-trial analysis or large-scale simulations. Spark can also speed up creation of analysis datasets (e.g., deriving complex endpoints that involve large data manipulations like time-series analysis of every patient's data). Machine learning on clinical data: Spark MLlib can be used to build predictors (e.g., likely dropouts) using the full dataset. When trial data volume is very high (e.g., omics data in trials, or hundreds of millions of rows from digital health devices), Spark handles it gracefully. | Overkill for single studies (where data fits well in a database or SAS environment). Typically requires a data engineer or savvy programmer – not usually directly used by clinical data managers or statisticians who lean on SAS. Thus, Spark might sit behind the scenes (perhaps hidden in tools like Databricks with a UI). Also, results from Spark might need to be validated and back-ported to SAS for regulatory filings, since SAS is the gold standard for FDA submissions. This duplication can be a consideration (though FDA is open to other tools, SAS remains entrenched). | Adoption: Large pharma have experimented with Spark for integrated clinical data analysis – for example, pooling patient-level data to develop predictive models (like which patients are at risk of adverse events). CROs have interest in Spark to optimize data cleaning across their portfolio. Still, in daily trial conduct, Spark is not widely used except in tech-forward trials (like those involving tons of device data or genetic data). It's more seen in pharma R&D analytics groups looking to reuse trial data at scale. |
| Cloud Data Warehouse (Snowflake, Redshift, Synapse) | Centralized repository: Once trial data is in a warehouse, it's easily accessible with SQL by statisticians, medical monitors, data managers, etc. Supports multiple concurrent users (e.g., medical monitors querying safety data while data managers check data quality). Scalable reporting: Can generate complex outputs (like a combined efficacy dataset from multiple studies) quickly. Integration with BI allows creation of live dashboards for trial status (enrollment, data entry lag, queries) that were difficult to achieve with legacy systems. Data blending: Can join clinical data with operational or real-world data for enriched analysis (e.g., linking a trial's subjects to background data from insurance claims to augment analysis). | Requires careful governance – need to ensure proper blinding (e.g., treatment assignments might be restricted until unblinding). Also, one must enforce standards so that different studies' data are comparable in the warehouse (common data model or use of CDISC SDTM). The initial setup of a study in the warehouse (defining the tables, loading mappings) is an extra step that some may see as overhead if they're already managing the data elsewhere. Cost can be an issue if the warehouse is queried extensively with large data (but for typical trial sizes, this is minor compared to overall trial costs). | High adoption: Many pharma have established clinical data warehouses. In the past these were Oracle or Teradata based; now migrating to cloud (Snowflake is popular for its low admin needs). For example, Janssen has a known data science platform where they load clinical trial data into Snowflake for scientists to analyze. Eli Lilly used a data warehouse approach to do cross-trial analyses that informed trial design decisions. Synapse is used by some CROs and smaller sponsors who are Microsoft-centric. Overall, using a warehouse for clinical data is standard for insight generation beyond individual study reporting. |
| Informatica (ETL/MDM) | Enterprise-grade ETL: Reliable, auditable processes to integrate data from EDC, lab systems, IVRS, etc. Minimizes manual data reconciliation. Visual data flows make it easier to validate transformations (important for regulatory compliance). Reusability: Common transformations (like unit conversions or dictionary mappings) can be reused across studies. MDM ensures consistency in reference data (e.g., same lab test coded the same way across studies). Metadata management: Informatica can also load metadata hubs (like data catalogs or define.xml for submissions) which helps in automation of analysis dataset creation. | Licenses and skilled developers add cost. Some newer companies opt for open-source or cloud-native tools, but those may require more coding. Informatica's strength is in traditional structured data; for newer data types (e.g., unstructured notes or images), additional tools might be needed. Also, ETL processes need to be kept in sync with changes – if an EDC is updated with new fields, the Informatica job must be updated too, requiring change control. Turnaround for changes might not be as fast as an agile team directly writing code, but it provides more assurance. | Very high in big pharma and CROs: Almost all large sponsors have used Informatica (or similar ETL like SAS ETL or Talend) in their clinical data pipelines. As data moves to cloud, many are adopting Informatica's cloud offerings to feed Snowflake/Redshift. For example, CROs like IQVIA have tools to map client data into their warehouses likely powered by such ETL. MDM usage is somewhat less universal but still common for managing entities like investigator master lists or concomitant medication dictionaries across trials. |
| Neo4j / Graph DB | Relationship analysis: Could uncover hidden connections – e.g., if patients in different trials share certain characteristics and outcomes, or if sites that perform well in one study also do in others (to inform site selection). Also could link trial data to scientific literature or molecular data in a graph, supporting translational research queries (like linking an adverse event in a trial to known biological pathways). | Not mainstream – requires graph data modeling which is not typically taught in clinical data contexts. Potential is there, but first need is to aggregate data (which can be done in SQL). Graph might shine in unique analyses like network of adverse events or patient similarity networks (to find patient clusters across trials). Justifying the implementation in a GxP environment could be hard unless it clearly answers questions not answerable otherwise. | Limited currently: Graph tech in clinical domain is mostly experimental – e.g., some research on using knowledge graphs for eligibility criteria and protocol design optimization. Over time, as more data is digital and connected, graph queries might become useful (like querying a knowledge graph that includes trial and real-world data to identify patients for trials). For now, most companies rely on warehouses for integrated trial data rather than graphs. |
| Veeva Vault (Clinical) | Unified trial management: Vault eTMF ensures all required documents are tracked and accessible; Vault CTMS tracks operational data (milestones, site performance); Vault EDC (for those using it) captures patient data with direct integration to Vault for downstream use. The unified platform reduces friction – e.g., a protocol amendment document in Vault eTMF can trigger an update in Vault EDC forms. Compliance: Vault is validated and Part 11 compliant by design, reducing validation effort for companies. All trial master file documents and audit trails are in one place, which is critical during inspections. Integration: Vault's open APIs and data export capabilities allow extracting structured trial information (like enrollment status, protocol deviations, etc.) to combine with data analysis in warehouses. | Vault is primarily an operational system with streamlined reporting and options to extend via Veeva Nitro for deeper analytics. For intensive analysis, teams typically export data to dedicated analytics environments. So while Vault centralizes data, data engineers complement it with warehouses or lakes for advanced workloads. Transitioning to Vault from legacy systems is a planned migration for big companies – during this strategic transition, data may reside in multiple places, requiring thoughtful integration. | Rapidly growing adoption: Most big pharma are either using Vault Clinical or in process of implementing it. This means the future state is a lot of clinical data (operational and some patient data) will reside in Vault, and data engineers will increasingly pull from Vault rather than directly from EDC or CTMS databases. For example, during a trial, a data engineer might use Vault reports to get the latest enrollment by country to feed a simulation model. Veeva's dominance in CRM for pharma is repeating in clinical with Vault, so understanding how to integrate with Vault is a emerging necessity. |
In summary, managing clinical trial data involves orchestrating multiple technologies: operational systems (EDC, CTMS, eTMF, etc.) to collect and manage the data, and analytics platforms (ETL pipelines, warehouses, big data tools) to aggregate, analyze, and learn from the data. Data engineers play a central role in linking these worlds – ensuring that high-quality data flows from where it's captured to where it's analyzed without silos or integrity loss. By using modern big data tech alongside traditional tools, they can handle new data types and larger scale (like digital health data in trials), enable real-time insights (like dashboards for trial management), and reuse data across studies (for example, pooling control arm data to reduce the need for new placebo patients). All of this must be done under rigorous compliance controls, as patient data in trials is highly confidential and regulated. When done successfully, these approaches reduce trial execution risks (through better monitoring and faster decision-making) and accelerate the path to clinical insights (by making it easier to query and analyze the rich data collected in trials).
Regulatory Data Management and Compliance
Pharmaceutical companies operate in a strictly regulated environment, generating enormous amounts of documentation and data to meet requirements from agencies like the FDA and EMA. Regulatory data management encompasses handling submission content (e.g., eCTD documents for drug approval), tracking product registrations and approvals worldwide, managing regulatory commitments and correspondence, and ensuring that all records are audit-ready and compliant with regulations. The challenges here are less about raw volume (though large companies manage millions of documents) and more about complexity, traceability, and integrity – every submission has dozens of components and dependencies, and errors or inconsistencies can lead to approval delays or compliance actions. Key technologies focus on content management, workflow, and structured tracking of regulatory information:
-
Veeva Vault RIM (Regulatory Information Management): Vault RIM has become a leading solution for managing regulatory content and data on a single cloud platform. It includes modules for document management (authoring, reviewing, approving all the documents that go into a submission) and for tracking the lifecycle of regulatory activities (submission planning, health authority questions, approvals, variations, renewals). A major benefit is that it replaces disparate tools (like separate tracking spreadsheets, document repositories, email trails) with one platform. For example, when assembling an eCTD dossier for a new drug, teams use Vault Submissions to organize documents into the correct hierarchy, link supportive documents (like raw data) to summary documents, and ensure everything is present for each region. Vault can then publish the eCTD sequence (compiling the XML backbone and PDF files) and once submitted, the sequence is locked in Vault Submissions Archive for future reference. All this occurs with Part 11 compliant audit trails and electronic signatures in Vault. Data model integration is a differentiator: Vault doesn't just store PDFs; it also stores metadata (like submission ID, product, country, regulatory category, etc.) in structured fields. This allows powerful queries and reports – e.g., "show all pending submissions by region and phase" or "list all documents that were reused from a previous submission". It also avoids mistakes like forgetting a document in a submission, since Vault can validate content against a predefined checklist. The Vault platform is highly scalable, used by large companies to manage tens of millions of documents. It provides APIs and reporting tools, which data engineers can use to extract structured regulatory data (for instance, a list of approved indications per country for a product) to combine with other data (like sales data or manufacturing data for product launch planning). From a compliance perspective, using Vault simplifies validation because Veeva provides a validated state – customers mainly need to validate their configuration and usage, not the whole infrastructure.
-
Legacy Regulatory Systems (Documentum-based and custom trackers): Many companies historically used enterprise content management (ECM) systems like Documentum (with solutions like CSC FirstDoc or OpenText) for regulatory document management. These are on-premises systems that provide similar functionality (document version control, workflows, basic metadata). Some companies built extensive custom databases to track things like submission status, commitments, and product registrations in different countries. For instance, an Oracle database might store all the details of each product's approval (like regulatory application number, submission dates, approval dates, local license numbers, etc.) and be paired with a front-end for data entry by local regulatory affiliates. These tools served well but often aren't integrated (document management separate from tracking database), which leads to duplication of data entry and risk of inconsistencies. Data engineers historically had to pull from multiple systems: the document repository for lists of submissions, the tracking database for dates and statuses, and maybe spreadsheets for commitments. This made comprehensive reporting difficult (imagine answering "How many submissions did we file worldwide this year and how many were approved on first pass?" when data is siloed). The transition to Vault RIM consolidates these, but companies in transition have to integrate new and old – for example, migrating historical data from a tracking database into Vault's Registrations object or linking Documentum documents to Vault records. During this period, data engineers might maintain pipelines that push new records from legacy systems into Vault or vice versa to keep them in sync.
-
Relational databases/warehouses for regulatory analytics: Even with Vault or a comprehensive system, many companies use a data warehouse to aggregate regulatory KPIs (key performance indicators). For example, they might use Snowflake or Redshift to combine data like submission timelines, approval dates, labeling changes, and create dashboards for management. These warehouses can also integrate regulatory data with other business data: e.g., linking the approval date of a drug in a country (from a regulatory system) with the date the product was launched in that country (from a supply chain system) to evaluate launch efficiency. In Vault, one can run reports, but complex multi-dimensional analysis (like trends over time across regions) may be easier in a BI environment. Data engineers might schedule regular exports from Vault RIM or legacy systems to the warehouse. Informatica is often in play here too, extracting from source (Vault or others) and loading into the warehouse.
-
Spark/NLP for regulatory intelligence: Regulatory intelligence involves monitoring and analyzing regulatory information (guidelines, past decisions, competitor filings, etc.) to predict or strategize for future submissions. Big data tools come into play for parsing large volumes of text – for instance, using Spark NLP to read through hundreds of pages of regulatory guidelines to identify changes or key points relevant to a product. Another use: analyzing all questions asked by FDA in past review cycles of similar drugs (which might be buried in PDFs of approval packages or meeting minutes). Spark could extract these questions and categorize them to help a team prepare better submission documents addressing those likely concerns. Some companies also monitor public forums or use text analytics on health authority communications (which can be semi-structured letters) to glean insight. These applications are relatively novel – historically, regulatory intelligence was a manual expert-driven task – but big data tech is gradually being explored to augment it. For example, an NLP algorithm might help flag that a new EMA guideline draft has added a requirement for a certain analysis, so companies can proactively implement that in their upcoming submissions. While not mainstream, such applications show the potential of big data to improve compliance and strategy in regulatory affairs.
-
Graph databases for regulatory knowledge graphs: A knowledge graph in regulatory could connect entities like drugs, submissions, countries, manufacturing sites, documents, and even regulations. Queries on such a graph could be powerful: e.g., "Find all submissions worldwide that involve Manufacturing Site Z (to assess impact of a site change)" – a graph would let you traverse from the site node to all submission nodes that reference it (via edges representing site approval in that submission). Or "What differences exist between the FDA and EMA approval (by linking to label content differences)" – if the label texts are nodes or attached, one could highlight discrepancies. Novartis and others have talked about capturing their regulatory and scientific knowledge in graphs to enable such queries. Again, early stages, but in principle a regulatory graph could even include the content of regulations and guidance: you could then trace how each regulatory requirement has been fulfilled by which document in a submission, an ultimate traceability that ensures compliance. Some companies are likely experimenting with graph in the background for such traceability and impact analysis use cases.
Example: A regulatory affairs department is managing a new drug application (NDA) in the US, an EMA centralized application, and numerous national submissions. Using Veeva Vault RIM, they organize all submission content and metadata. When the FDA asks a question, they log it in Vault as a "health authority query" linked to the submission and to the relevant document (e.g., a question about clinical data is linked to the clinical study report document). Once they answer and send a response document, that too is logged and linked. All this information (dates of questions, response times, statuses) is now stored in Vault as structured data. The regulatory operations team uses Vault's built-in dashboards to track outstanding queries and commitments. Separately, the company's global regulatory head wants a summary of all product approvals and pending submissions worldwide. The data engineers use Vault's reporting API to pull a list of all product registration records (which include country, approval date, conditions, etc.). They load this into a Tableau dashboard (via a Snowflake intermediate) which shows a world map with markers for approved/pending. This integrates with sales data: when an approval happens (entered in Vault or automatically updated by Vault via an affiliate user), it triggers a pipeline that updates the supply chain and sales forecasting systems (so they know the product can launch in that market). Meanwhile, a regulatory intelligence analyst wants to ensure their new submission preempts known issues. He has a corpus of 50 FDA review summaries for similar drugs. The data engineer uses Spark NLP to extract all the text in those documents under sections like "Issues raised during review". They create a word cloud and frequency analysis of these issues, finding common phrases like "missing genotoxicity study" or "inadequate stability data". Seeing this, the team double-checks that their submission has robust data in those areas. This NLP-driven insight (big data on unstructured text) potentially helps them avoid a deficiency. On compliance: every regulatory record is in Vault with audit trails, fulfilling their legal requirements. Their use of Snowflake and Spark for analysis is on copies of data – these systems are internal tools to aid strategy, not the primary records (which remain in Vault). They ensure any personal data (like names of reviewers in letters) are either not extracted or are anonymized, focusing only on content needed for analysis. As a result, they maintain a strong compliance posture (with Vault handling authoritative data and documents) while also leveraging big data techniques to inform and streamline their regulatory efforts. In the end, the NDA is approved on first cycle – something they attribute in part to thorough preparation aided by their data-driven regulatory intelligence – and all the data and documents from that process are readily accessible for future reference, via Vault and their reporting warehouse.
Comparison: Technologies for Regulatory Data Management
| Technology | Role in Regulatory Use Case | Differentiators and Compliance | Real-World Adoption |
|---|---|---|---|
| Veeva Vault RIM | One-platform solution for managing regulatory documents and tracking submission status across products and regions. Used from early dossier authoring through publishing, health authority interactions, and post-approval changes. Replaces multiple disparate tools with a unified, cloud-based process. | Differentiators: Combines content management (with robust versioning and access control for documents) and structured data (records for submissions, approvals, variations). Built specifically for life sciences, with pre-configured workflows that align to regulatory processes (e.g., review and approval of labeling). Vault's cloud architecture enables easy collaboration with affiliates/partners (just one system to log into). Compliance: Delivers Part 11 compliance out-of-the-box with e-signatures, full audit trails on documents and fields, and validation packages from Veeva. Can enforce business rules (e.g., cannot mark a submission "complete" until all required documents are attached). | High adoption: Most large pharma and many mid-size use Vault RIM or are implementing it (often replacing Documentum-based systems). e.g., Moderna, a newer company, adopted Vault RIM early on; older ones like Pfizer and Merck are in process or completed migration. Regulators themselves are aware of Vault – during audits, showing data from Vault is becoming common. This widespread use means regulators increasingly expect sponsors to quickly retrieve any requested info (which Vault makes easier). Data engineers at these companies now often pull data from Vault to feed regulatory dashboards and analytics, rather than maintaining separate tracking databases. |
| Documentum/OpenText (Legacy ECM) | Managed regulatory documents for decades at many companies. Often paired with custom solutions for submission assembly (like eCTDXPress) and tracking databases. Provided the controlled document repository function (with audit trails and access control) needed for regulatory filings. | Differentiators: Highly configurable to company needs – many companies built custom data models and interfaces (which is also a downside: upgrades were painful). Could be hosted on-prem, giving companies full control of data location (some companies still prefer this for sensitive IP). Compliance: Could be made Part 11 compliant with proper SOPs and configuration. However, heavy customization sometimes risked compliance issues if not thoroughly validated. Typically had a web UI and an integration with MS Office for authoring support. | Was standard, now declining: Nearly every big pharma had something like " |
| Regulatory Tracking DB | Custom or semi-custom relational databases for tracking product approvals, submission milestones, and commitments. Often an Oracle or SQL Server with a front-end where local regulatory personnel enter updates (like "Approved on X date with conditions Y"). Allows generating reports like "Where is product X approved?" or "What variations are pending?". | Differentiators: Can be tailored to specific company reporting needs; some had complex logic (e.g., automatically send reminders for upcoming license renewals). They handle structured data well but not documents. Compliance: These are GxP systems – companies validated them and maintained audit trails (some built audit triggers in the DB, or the front-end application did it). If not integrated with document systems, there could be data mismatches (like a submission marked "submitted" but a document not actually filed or vice versa). | Adoption: Common in companies that didn't have an all-in-one RIM. E.g., a pharma might have used an Access or Oracle-based tool for tracking while using an ECM for docs. Many are decommissioning these as Vault's Registrations and Tracking modules replace the functionality. Until then, data engineers may need to merge data from these and ECMs for comprehensive reporting. In smaller pharma, even spreadsheets are used (not ideal, but happens), which again might be consolidated via Vault or at least centralized into a small database by IT. |
| BI/Analytics Warehouse | After data is centralized (via Vault or other systems), companies use BI tools and warehouses to analyze regulatory performance. For instance, average approval time by region, percentage of submissions on-time vs delayed, number of queries per submission, etc. This helps management identify process improvements. | Differentiators: By blending data (e.g., linking regulatory milestones to project management data or sales data), companies can quantify the impact of regulatory processes on business outcomes. Warehouses can easily aggregate across products, whereas transactional RIM systems focus on per product or submission. Compliance: The warehouse is usually for internal metrics and decision support – not a source of record – so it doesn't require the same level of validation, though data should be traceable back to validated systems. | Standard practice: All large companies produce regulatory KPI reports. Historically, this might have been done in Excel (painfully). Now tools like Tableau, Power BI connected to a data mart are common. For example, a company might have a dashboard showing "Submissions planned vs actual this year" drawing from their RIM. Data engineers set up these pipelines. Another real example: a pharma used their data warehouse to correlate health authority query turnaround time with ultimate approval time to make the case that faster response = quicker approval, thus encouraging teams to improve speed. Such insights require pulling data out of RIM and analyzing historically. |
| Spark/NLP for Reg Intelligence | Processing large sets of external unstructured data – regulations, guidelines, competitor filings, drug labels – to extract insights. Could automatically populate a database of requirements (e.g., list of studies required by FDA for oncology drugs) or detect changes in new regulatory guidance (by comparing versions). | Differentiators: Can dramatically cut down manual review load. If an AI can flag "EMA now expects X in modules", regulatory teams can adapt faster. Over time, could help answer "what is the likely question from agency given this submission?" by learning from past patterns. Compliance: Using these tools doesn't directly affect submissions (they aid humans), so compliance focus is mainly on ensuring data is from credible sources and the process is documented (so management can trust the insights). | Emerging: Some companies have internal "Regulatory Intelligence" teams experimenting with these techniques. For instance, GSK has publicly mentioned using AI to predict regulatory outcomes. Still, it's not widespread to rely on AI; most decisions are based on human experts. Likely in the next few years, such tools will become part of the toolkit (perhaps integrated into Vault as features or separate intelligence platforms like Parexel's LIQUENT). For now, data engineers might do ad-hoc projects using Spark/Python to assist Reg Intel groups on specific questions. |
| Graph DB for Knowledge Graphs | Integrating regulatory data into a broader knowledge graph that includes R&D and commercial data. Could connect a product node to its submissions, which connect to documents and also to conditions of approval, which connect to post-market study nodes, etc., yielding an end-to-end view of a product's lifecycle. | Differentiators: Enables complex queries that span traditionally separate domains (e.g., "did any trial results in development correspond to an eventual safety warning in the label post-approval?" by traversing development → regulatory → safety edges). Could also link regulations to products (like "this new rule affects these 5 products because they contain substance Y"). Compliance: As a knowledge tool, it supplements rather than replaces validated systems. If well-maintained, it provides rapid impact analysis for compliance management (e.g., new law requiring serialization might be traced through graph to all products and supply chains impacted, a process that normally requires many meetings). | Forward-looking: A few companies are building enterprise knowledge graphs. For example, AstraZeneca has talked about their "Enterprise Knowledge Graph" connecting research, clinical, and regulatory data. This is cutting-edge and not yet routine. Data engineers involved in such projects are basically pioneering new ways to query cross-domain questions. In time, as these graphs mature, they could become a standard interface for strategic queries, with graph AI algorithms highlighting patterns humans might miss in the massive web of pharma data. |
Regulatory data management, once considered a back-office record-keeping function, is being transformed by these technologies into a more proactive, data-driven discipline. With systems like Vault RIM, companies achieve a single source of truth for regulatory documents and data, dramatically improving efficiency and compliance (no more hunting through shared drives or disparate databases during a filing – everything is in one validated system). Big data tools like Spark and NLP are starting to supplement human expertise by digesting vast external information, thus refining regulatory strategy and preparation. The result is that pharma companies can manage increasingly complex global regulatory requirements with fewer errors and delays: submissions are more complete and timely, responses to authorities are faster (since data is organized and accessible), and compliance obligations (like post-market studies or periodic reports) are tracked so none are missed. For a data engineer in this space, success means not only maintaining the integrity of regulatory data (which is absolutely critical) but also unlocking it – integrating and analyzing it so that the organization can glean insights (e.g., performance metrics, predictive intelligence) that confer a competitive advantage in gaining approvals. All of this ultimately helps in getting new therapies to patients faster while staying fully compliant with the law.
Pharmacovigilance and Drug Safety Analytics
Pharmacovigilance (PV) – the monitoring of drug safety post-approval (and during clinical trials) – generates and consumes huge amounts of data. Every year, millions of adverse event (AE) reports are collected worldwide through spontaneous reporting systems, patient support programs, medical literature, and more. The goal is to detect any safety signal (an unexpected pattern that might indicate a new risk) as early as possible and take action (label changes, further studies, even product withdrawal). Key challenges include volume (large datasets of individual case safety reports), variety (structured reports, call center logs, social media, literature abstracts), velocity (the need for prompt signal detection), and veracity (ensuring data quality in often anecdotal reports). Big data technologies are increasingly crucial for efficient PV:
-
Hadoop/Spark for adverse event data processing: Many pharma companies augment their internal safety data (cases from their products) with external data like the FDA's FAERS and WHO's VigiBase, which are large (FAERS has ~15 million reports). Spark is ideal for crunching these datasets to compute disproportionality metrics (like reporting odds ratios or Bayesian EBGM values) to find drug-event combinations reported more frequently than expected. In an example from OpenTargets, Spark and Scala were used to analyze ~130GB of FAERS data, filter and group by drug-event pairs, and calculate a likelihood ratio for signals. This took minutes, whereas a single-thread process could take hours or more. Similarly, a pharma may use Spark to merge their own global safety data (from systems like Oracle Argus) with FAERS, allowing them to see the broader context. Hadoop HDFS might store years of raw safety data (in CSV or Parquet files), which Spark can quickly filter (e.g., all reports for a drug class) and analyze. Additionally, Spark's machine learning can be applied to PV – for example, building predictive models of which patients are at higher risk of certain side effects using real-world data. While traditional PV relies on descriptive statistics, advanced analytics with Spark can incorporate multiple variables. Some companies also use Flink or Kafka Streams for real-time processing of incoming cases (to flag severe ones immediately for medical review). But Spark is widely adopted for batch signal detection runs (e.g., monthly safety data surveillance) because of its rich ecosystem and proven capability in such big data tasks.
-
Cassandra/MongoDB for real-time case management: PV departments need robust intake and data management for individual case safety reports (ICSRs). While the final storage is usually a relational safety database (for regulatory reporting), ingesting and routing data can be enhanced by NoSQL. For instance, if a company has multiple intake channels (email, web, phone) globally, they might push all incoming case data into a Cassandra cluster to ensure it's captured quickly and can be consumed by downstream processes even if one system is down. Cassandra's high write throughput means it can log thousands of events per second (useful if there's, say, a product issue causing a spike in reports). Another use is storing aggregated safety data in Cassandra to power a real-time dashboard (for example, a live count of reports by seriousness for a product, updating as new cases come in). The results from Cassandra might be visualized on a web UI for the safety team to monitor during, say, the launch of a new drug. MongoDB could be used to store the unstructured parts of case reports (narratives, doctors' notes) in a flexible way, and even to apply text search to them for signal detection (though more often, specialized text mining tools are used).
-
Signal detection algorithms and specialized tools: Beyond general big data platforms, PV uses specialized statistical tools (like EudraVigilance's EVDAS or Oracle Empirica Signal). Data engineers might have to integrate outputs from these tools into internal systems. For example, Empirica might flag a signal and then data engineers ensure the data on that signal (case counts, etc.) is pipelined into a safety issue tracking system. Increasingly, companies are building custom signal detection pipelines (especially to integrate multiple data sources), leveraging Spark and R/Python for flexibility. They may incorporate not just disproportionality but also more advanced methods (clustering, social media trend analysis, etc.). In doing so, maintaining a big data environment (with historical data lake, updated incremental data, and compute to run algorithms) is key.
-
Graph databases for pattern recognition: Adverse events can be multi-factorial (multiple drugs, diseases, patient factors). Neo4j can represent an ICSR as a subgraph: a patient node connected to drug nodes (they were taking) and event nodes (they experienced). Analyzing the full safety graph might reveal, for example, that two drugs often appear together in serious cases (signaling a potential drug-drug interaction) – this is naturally queried in a graph by finding frequent subgraph patterns, whereas in a relational model it requires complex self-joins. Graph algorithms (like community detection) could identify clusters of events that co-occur, suggesting a syndrome. For instance, drug-induced liver injury might manifest as a cluster of lab abnormalities and symptoms – a graph algorithm might cluster those event nodes together across many cases and associate them with certain drugs, even if each individual event doesn't trigger a signal on its own. TigerGraph with its ability to handle very large graphs might be applied to national or international datasets to find such multi-hop relationships quickly (e.g., a four-hop path linking a drug to a series of intermediate reactions to an outcome). While these approaches are exploratory, some academic and industry research is moving PV in this direction (treating safety data as a network problem).
-
Machine learning and AI in PV: Big data tech also enables machine learning in PV beyond signals – for example, natural language processing (NLP) to auto-extract information from case narratives or literature. Companies train models (which requires large training datasets – a big data task) to do things like classify the seriousness of a case from the text or suggest the most likely cause among multiple drugs. Automated case processing is a hot topic: using AI to do the first pass data entry for cases, which could dramatically reduce workload. Data engineers help by integrating these AI models into the PV data pipeline and by providing the computing environment for training them (often using Spark or TensorFlow on large GPUs). This crosses into big data because training an NLP model on tens of thousands of case narratives is data-intensive and may need distributed training. Once deployed, these models produce structured outputs from unstructured inputs, effectively turning text into data that can be stored in the safety database or analyzed. Another use of ML is predictive safety – e.g., using real-world data to predict the probability of a rare event occurrence, or identifying patient subgroups at risk (for labeling). These require blending clinical data, claims data, and case data – a multi-source big data integration.
Example: A pharmacovigilance team monitors a portfolio of drugs, including a new biologic that just hit the market. They receive adverse event reports through various channels worldwide. Each incoming report is first captured by a custom intake system that writes key fields (drug, event terms, timestamps) to a Cassandra database in real time. This acts as a buffer and single feed into the core safety system (Oracle Argus). A Spark Streaming job subscribed to the Kafka queue of new reports also writes to Cassandra, ensuring even if Argus goes down for maintenance, no reports are lost (Cassandra is always available). Now every day, a scheduled Spark job reads the latest data from Argus (via an export or direct connection) and from the FDA's FAERS (which they download quarterly and store in HDFS). It updates a running count of drug-event pairs and calculates disproportionality metrics (say PRR and a 95% CI). It finds that for their new biologic, reports of a certain infusion reaction are higher than expected in the first three months. This signal (with PRR > 2 and statistically significant) is flagged. Spark automatically outputs a report of all cases contributing to that signal (listing case IDs, patient demographics, etc.) and saves it as a file. It also inserts the signal summary into a Snowflake table that tracks signal detection results over time. Simultaneously, their data science team has an NLP model that reads case narratives. When Argus gets a new case, the text is sent to a REST API running a PyTorch model; the model returns a predicted MedDRA coding of the narrative and highlights of key symptoms. These suggestions appear to the safety data specialist doing data entry, speeding up their work. All narratives are also stored in a MongoDB for text mining. The PV team uses a Neo4j graph to map relationships: each case is a graph of Patient -> Drug(s) -> Event(s). They query this graph to see if any patients had the same combination of two drugs and a serious event; indeed, they notice a few cases where their biologic and a certain other immunosuppressant were used together and serious infections occurred. While numbers are small, this pattern emerges visually in the graph (a cluster of infection nodes connected to both drug nodes). They raise this as a potential interaction to# Big Data Technologies in Pharma: Use Cases, Implementation, and Comparisons
The pharmaceutical industry generates vast and diverse datasets – from genomic sequences and clinical trial results to regulatory documents, safety reports, and supply chain logs. Data engineers in pharma must choose appropriate big data technologies to store, process, and analyze this information at scale. This report explores key technologies – Hadoop (HDFS, Hive, HBase), Apache Spark, Cassandra, MongoDB, Snowflake, AWS Redshift, Azure Synapse Analytics, Azure Data Lake, Google BigQuery, Neo4j, TigerGraph, Veeva Vault, Informatica, DNAnexus, and Illumina BaseSpace – and how they are applied across major use cases. Each section focuses on a specific use case (e.g., genomics data analysis, clinical trials, regulatory data management, pharmacovigilance, manufacturing and supply chain, sales and marketing analytics), detailing which technologies are most commonly used, how they are technically implemented, what differentiates them, and providing concrete examples. Comparisons are provided in tables for attributes like scalability, cost, performance, integration ease, compliance features, and real-world adoption, to help data engineers evaluate solutions.
Genomics Data Analysis and Bioinformatics Pipelines
Genomic and multi-omics data analysis in pharma involves processing massive sequencing outputs (DNA/RNA reads, variant files) and integrating results for drug discovery or precision medicine. Key challenges include scalability (handling petabytes of sequencing data), processing speed (aligning reads or calling variants across thousands of genomes), flexible pipelines, and compliance (securely handling potentially identifiable genetic data). Data engineers leverage a mix of on-premises big data frameworks and specialized cloud platforms:
-
Hadoop Distributed File System (HDFS) for large-scale storage: Genomic files (FASTQ, BAM, VCF, etc.) are enormous. HDFS provides distributed storage across clusters, making it feasible to store and process terabytes of sequence data in parallel. For example, biomedical research projects have utilized Hadoop to manage large volumes of NGS and clinical data ([1]). Apache Hive (SQL-on-Hadoop) can impose structure on variant data (storing variant calls in tables for query), and HBase (Hadoop's NoSQL store) enables fast random access to specific genomic records (e.g., retrieving all variants at a particular gene). While Hadoop's batch-oriented MapReduce model was historically used in genomics, modern pipelines favor more efficient in-memory frameworks.
-
Apache Spark for distributed computing: Spark is a cluster computing engine ideal for iterative algorithms and large-scale analytics. In genomics, Spark accelerates variant analysis pipelines by parallelizing tasks across cores or nodes. For instance, the GATK4 toolset from the Broad Institute offers Spark-based versions of key algorithms to speed up processing of large genome cohorts. Spark can run on Hadoop (using YARN) or in cloud-managed environments (Databricks, Amazon EMR, Google Dataproc). Specialized frameworks like ADAM and Hail build on Spark to provide genomic data models and APIs, enabling scalable genomic analyses (e.g., joint genotyping on thousands of genomes). Spark's in-memory processing provides major performance gains over Hadoop MapReduce, making it "one of the most promising technologies for accelerating pipelines". Its machine learning libraries (MLlib) also support advanced analyses (clustering variants, predicting phenotypes from genotypes, etc.).
-
Cloud Data Warehouses (Snowflake, BigQuery, Redshift) for multi-omics integration: After primary genomic analyses, results (variants, expression matrices, etc.) often need to be integrated with clinical and reference data. Cloud data warehouse platforms excel at aggregating results and enabling interactive analytics on genomic data combined with other datasets. Snowflake has been used as a bioinformatics data warehouse, providing a convenient SaaS platform to join genetic data with clinical phenotypes. Researchers demonstrated a Snowflake framework for storing diverse biological datasets and performing integrated analysis like disease variant filtering and in-silico drug screening. Snowflake's multi-cloud compatibility and near-zero maintenance appeal to pharma R&D teams – it runs on AWS, Azure, or GCP, reducing vendor lock-in risks. Features like secure data sharing and zero-copy cloning also facilitate collaboration (e.g., safely sharing a subset of variant data with external partners without duplicating it). Google BigQuery is similarly leveraged for large genomic datasets, aided by Google's ecosystem – for instance, BigQuery has native support for public genomic databases (TCGA, 1000 Genomes) and integrates with Google's AI/ML tools (TensorFlow, Vertex AI) for tasks like protein folding analysis. Amazon Redshift is often chosen if a company's infrastructure is AWS-centric – it integrates with AWS services (S3 for storage, AWS Batch or SageMaker for analysis pipelines) to facilitate genomic data processing. Redshift now supports semi-structured data and RA3 nodes with managed storage, but it may require more tuning than Snowflake/BigQuery for peak performance. In practice, pharma teams might stage genomic data files in a cloud data lake (S3 or Azure Data Lake) and use external tables or services like Redshift Spectrum or Synapse to query them as needed.
-
NoSQL and graph databases in genomics: Some genomic applications benefit from NoSQL or graph data models. MongoDB can store experiment metadata or gene annotations as JSON, offering schema flexibility for evolving datasets. HBase or Cassandra could store large key-value pairs like k-mer counts or variant calls keyed by genomic coordinate, supporting fast lookups in association studies. Neo4j appears in drug discovery knowledge graphs that include genomic information – for example, linking genes, variants, pathways, and diseases, which allows complex queries like finding drug targets associated with pathogenic variants. While NoSQL/graph databases are not typically the core pipeline tools, they can add value in organizing and querying genomic knowledge extracted from analyses.
-
Specialized Genomic Platforms: Many pharma rely on platforms like DNAnexus or Illumina BaseSpace for genomic data management and analysis. DNAnexus provides an end-to-end cloud platform for NGS data, offering scalable storage and compute, a library of bioinformatics tools, and secure collaboration features. It's built for scale – managing over 80 petabytes of genomic and multi-omic data on behalf of users ([6]) – and for compliance (audit trails, permission controls, and certifications for clinical use) ([6]). DNAnexus allows data engineers to focus on pipeline development rather than infrastructure. Illumina BaseSpace Sequence Hub connects directly to Illumina sequencers to stream data to the cloud for storage/analysis. It provides push-button DRAGEN pipelines (hardware-accelerated) for ultra-fast secondary analysis, with an interface that is easy for lab scientists. BaseSpace is designed to be secure and compliant (ISO 27001 certified, HIPAA compliant) with features supporting data encryption and controlled access. These platforms reduce the need to build in-house clusters, though data engineers often export results from them to integrate with broader data platforms (like warehouses or AI modeling environments).
Example: A pharmaceutical research team sequences tumor samples for a cancer drug trial (whole exomes for 500 patients). They use Illumina NovaSeq sequencers with BaseSpace to handle data capture and initial processing (alignment and variant calling with DRAGEN). As soon as each sample is sequenced, BaseSpace processes it and stores the resulting VCF (variant calls) and quality metrics. Data engineers then transfer the VCFs to an Azure Data Lake and use Azure Databricks (Spark) to run joint variant calling across all patients and perform quality filtering. They also use Spark's MLlib to cluster tumors by mutation profiles and identify mutation patterns associated with drug response. The consolidated variant data, along with cluster assignments and key clinical attributes, are loaded into a Snowflake data warehouse. In Snowflake, biostatisticians and bioinformaticians join the genomic data with clinical outcome data and run SQL queries to find correlations (e.g., does a particular mutation correlate with better response?). They use a BI tool to visualize results. Additionally, the team loads the data into a Neo4j knowledge graph linking variants to genes, pathways, and existing drugs. This helps them explore if patients with certain mutations might benefit from other therapies by traversing connections between mutated genes and known drug targets. Throughout the process, patient identities are coded and all systems (BaseSpace, Azure, Snowflake) are configured for compliance (encrypted data at rest, access limited to authorized researchers). By combining specialized tools (BaseSpace) with general big data platforms (Spark, Snowflake, Neo4j), the team efficiently extracts insights from massive genomic datasets while maintaining data security and integrity.
Comparison: Technologies for Genomics Data
| Technology | Scalability | Performance | Integration Ease | Compliance Features | Adoption in Genomics |
|---|---|---|---|---|---|
| Hadoop (HDFS, Hive, HBase) | High horizontal scalability (add nodes to store petabytes; throughput scales with cluster size). Suitable for on-prem or IaaS clusters. | Great for batch processing of large files; MapReduce is reliable but slower than in-memory frameworks for iterative algorithms. Hive enables SQL queries on big genomic tables (e.g., variant frequencies across samples) but with higher latency (seconds–minutes). HBase allows millisecond retrieval by key (e.g., by genomic coordinate) on huge datasets. | Requires significant setup and cluster admin expertise. Integrates well with Spark and other Hadoop ecosystem tools (Kafka, Oozie), but not a plug-and-play solution. Many newer genomic pipelines prefer cloud storage/compute for ease of use, though Hadoop remains useful for cost-effective on-prem storage and batch computing. | Secureable via Kerberos and Apache Ranger; can be kept entirely on-prem to satisfy data residency or internal policy. Requires custom validation for GxP use. Historically, satisfying regulatory validation on Hadoop was non-trivial, so it's often used in research contexts rather than regulated clinical pipelines. | Historically high for large projects (e.g., 1000 Genomes). Many pharma maintained Hadoop clusters for omics in the 2010s; now shifting to cloud or specialized platforms. Still used in certain high-performance computing environments or when massive multi-omics data lakes are maintained on-prem for cost or security reasons. |
| Apache Spark | Scales from a single server to large multi-node clusters. In-memory model accelerates iterative tasks; can spill to disk for very large data if needed. Cloud-managed Spark (Databricks, EMR) allows dynamic scaling per workload. | Excellent for large-scale transformations and analytics. Far faster than MapReduce for variant processing and statistical analysis due to in-memory computation. Can handle interactive queries (via notebooks) on moderately large genomic sets and batch process huge sets (e.g., joint calling tens of thousands of genomes). MLlib enables machine learning on full genomic datasets rather than samples. | Offers APIs in Python, R, Scala, etc., easing integration with bioinformatics codebases. Connectors for all common data sources (HDFS, S3, Azure Blob, GCS, JDBC to warehouses). Often used via notebooks which scientists can use with some training. Requires coding – bioinformaticians or data engineers build the pipelines; not a point-and-click tool. | No built-in compliance controls; inherits environment's security (can run on HIPAA-compliant cloud with encryption). Logging and version control of code are needed for validation. Often used in non-clinical research or exploratory analysis, with results later confirmed in a validated system for regulatory submission. | Widely used in genomics R&D. Many pipelines (Broad's GATK4, Regeneron's ATLAS) leverage Spark. Databricks is used by biotech/pharma to analyze large -omics and imaging datasets. In clinical contexts, Spark is emerging in pharmacogenomics analysis and adaptive trial simulations. |
| Snowflake | Near-infinite scalability via decoupled storage (automatically scales on cloud object storage) and compute (warehouses can scale up/down or cluster for concurrency). Easily handles petabyte-scale warehouses and high user concurrency. | High performance for complex SQL queries on large data. Uses columnar storage and automatic query optimization. Particularly good for aggregating and joining heterogeneous data (genomic + clinical). Automatic micro-partitioning means minimal tuning needed. Not designed for low-latency single-record lookups, but excels at analytical workloads. | Very easy to integrate – standard SQL interface with extensive connectors (Python, R, Java). Supports semi-structured data (JSON) which can hold, e.g., variant annotation info. Zero-copy clone and data share features enable collaboration and sandboxing experiments without extra storage cost. Little admin overhead (no indexing/partitioning for user to manage). | Strong compliance: Snowflake is HIPAA- and HITRUST-compliant; data is encrypted by default. Provides role-based access control down to row/column level. Query logging for audit is built-in. Many pharma have validated Snowflake for use with clinical/genomic data by controlling change management on schemas and code accessing it. | Rapidly growing in life sciences. Used by pharma and genomic analysis companies as a central data repository (e.g., storing population genomics and accompanying clinical data). Examples: A large pharma uses Snowflake to allow researchers to query integrated genomic and clinical trial data in one place to identify biomarkers. Genomics England set up a Snowflake instance for researchers to query the 100K Genomes data securely. |
| Google BigQuery | Massive, elastic scalability (Google handles sharding and distributed execution automatically). Can scan terabytes to petabytes in seconds to minutes. Scales transparently with data size and query complexity (with cost scaling accordingly). | Extremely fast for scan-heavy queries and aggregations. Ideal for exploring large datasets and running cohort queries on genomic variant tables joined with phenotype tables. Supports join and window functions on nested data useful in genomics (e.g., per-sample genotype arrays). Performance on complex joins or user-defined functions is good, but may require query optimization techniques (flattening data, etc.). | Standard SQL (with extensions for nested data). Direct integration with Google's analytics ecosystem (Data Studio for BI, Colab for notebooks, AutoML for model training on data in BigQuery). Minimal setup – load data to BigQuery and query immediately. The availability of public genomics datasets in BigQuery allows effortless joining with one's private data. | Fully managed security: data encryption at rest/in-transit by default, fine-grained IAM controls, detailed audit logs. BigQuery is HIPAA-compliant (under BAA) and used in Google's own healthcare projects. It offers features like row-level security and dynamic data masking for privacy. | Used by genomics and health informatics teams, especially those leveraging Google Cloud's AI (e.g., using BigQuery as a data lake for training genomic prediction models). Examples: Verily's research platform, and the CDC's Covid tracing analytics have used BigQuery. Some pharma use BigQuery to aggregate real-world data and then combine it with trial or omics data for outcomes research due to its speed on large data. |
| AWS Redshift | High scalability (petabyte-scale) with ability to add nodes for more storage or throughput. RA3 nodes let storage scale transparently on S3 while keeping frequently accessed data cached locally. Concurrency Scaling spools up extra clusters for spikes of users. | Excellent performance for structured, repeated queries, after tuning distribution keys and sort keys for the data. Good for data marts like "analysis-ready" datasets in clinical or genomics where query patterns are known. Spectrum extends queries to S3, enabling analysis of raw files without full import. Can saturate network for large joins, but proper design yields fast results. | PostgreSQL-compatible SQL makes it accessible. Integrates with AWS Glue (ETL) and SageMaker (for ML using Redshift data). Needs more maintenance (vacuuming, analyzing) and query optimization by admin compared to Snowflake. Many tools (Tableau, etc.) natively connect. Output to QuickSight for quick internal dashboards is straightforward if staying in AWS ecosystem. | Mature and secure: Deploy in Amazon VPC, encryption via KMS, CloudTrail auditing. Redshift is covered under AWS's HIPAA compliance program. Fine-grained access control via roles and AWS IAM. Often part of a validated AWS environment with defined change control for schema changes. | Widely adopted in pharma that went "all-in" on AWS. E.g., Moderna's cloud-native data platform used Redshift early on for various data including clinical data integration. Many legacy on-prem warehouses migrated to Redshift. Some have since moved to Snowflake for ease-of-use, but others stay with Redshift especially if heavily integrated with AWS pipelines. It remains a workhorse for a lot of clinical and preclinical data marts in industry. |
| DNAnexus | Highly scalable cloud platform (runs on AWS/Azure). Launches ephemeral compute clusters for large-scale jobs (e.g., secondary analysis of thousands of genomes simultaneously). Manages data in cloud storage with over 80 PB in production use ([6]), scaling as users add more. | Optimized for NGS pipelines: specialized in handling thousands of FASTQ/BAM files and running workflows (CWL/WDL) at scale. Performance is high for I/O and compute due to optimized cloud provisioning (e.g., packs data locally to compute, uses high-memory instances for heavy tasks). As a managed service, scales without users needing to configure clusters. | Accessible via web UI, CLI, and APIs. Integration ease depends: easy within its ecosystem, but to integrate outputs to external systems, one uses API or export. Supports Docker app packaging, which makes it flexible (any tool can be wrapped and run at scale). Workflows can be configured via GUI or JSON without hardcore programming, which is friendly to bioinformaticians. | Designed for compliance: offers controlled access (project-based permissions), audit logs, and is used in clinical settings (has support for PHI de-identification and compliance with CLIA/CAP for labs). Many customers use DNAnexus in validated pipelines for companion diagnostics, indicating its compliance readiness. | Growing usage for genomics-driven projects: e.g., UK Biobank's RAP is built on DNAnexus, enabling global researchers to run big analyses without local data download. Pharma use it especially when they collaborate (so partners can analyze data in a secure environment). It's probably less used for non-genomic data. Some integrate DNAnexus with their internal pipelines by using its APIs (for example, pulling analysis results into an internal data warehouse for further integration with clinical data). |
| Illumina BaseSpace | Scales with Illumina's cloud infrastructure; effectively unlimited for sequencing output (users just pay for storage). New runs are added seamlessly; concurrent pipeline runs scale as needed (Illumina manages underlying compute, so labs don't worry about it). | High performance secondary analysis with DRAGEN greatly accelerates turnaround (clinical labs can get variants same day). For data storage, BaseSpace ensures fast upload from sequencers and decent download speeds for users. Focused on genomics, so performance is tuned for those file types and typical workflows. | Extremely easy integration – built into Illumina machines: a few clicks to sync runs to cloud. No need for users to manage software updates for pipelines – Illumina updates its apps (e.g., new genome references). Limited external integration: if needing to combine BaseSpace data with clinical trial databases, one must export or use Illumina's newer Connected Analytics platform with APIs. | Illumina's cloud is HIPAA-compliant; they provide BAAs for clinical users. Data is encrypted and isolated per project. E-signatures for any manual edits (like sample info) support Part 11 in their Clinical BaseSpace version. Audit logs track data access and pipeline execution. Many diagnostics companies trust BaseSpace for handling patient genomic data, reflecting its compliance. | High adoption in any setting with Illumina sequencers. Pharma: widely used in research units for convenience of primary analysis (then data often moved in-house for secondary/tertiary analysis). Some pharma running adaptive trials with genomic components use BaseSpace to get near-real-time sequencing results to inform trial decisions. It's basically standard in genomics labs, with the choice mostly between local DRAGEN servers vs BaseSpace cloud – increasingly cloud is chosen for flexibility. |
Key Takeaway: In genomics, data engineers often combine multiple technologies to address different needs – e.g., using Spark on HDFS for heavy-duty variant processing, a cloud warehouse (Snowflake/BigQuery) for integrating genomic data with clinical and other data, and specialized platforms (DNAnexus/BaseSpace) to handle raw sequencing and initial analysis with ease and compliance. Each technology has unique strengths – Hadoop for cost-effective on-prem storage and batch processing, Spark for fast distributed computing and ML on big data, Snowflake/BigQuery for easy sharing and interactive analysis, graph databases for connecting biological knowledge, and domain-specific platforms for pipeline management and regulatory compliance. By leveraging the right tools for each task, data engineers enable faster insight generation from genomic data while maintaining data security and regulatory compliance (critical when dealing with human genetic information). Ultimately, this accelerates target discovery, biomarker identification, and the development of precision medicines.
Clinical Trials Data Management and Analytics
Clinical trials generate diverse data – patient demographics, treatment assignments, eCRF (electronic case report form) data, lab results, imaging data, patient-reported outcomes, adverse events, and operational metrics (enrollment, site performance, etc.). These come from multiple systems (EDC databases, central labs, imaging core labs, ePRO devices, CTMS for operations) and must be consolidated for analysis, reporting, and regulatory submission. Key requirements include flexibility to handle different study designs and data schemas, scalability to manage large Phase III or portfolio-level datasets, and compliance with regulations (21 CFR Part 11 for data integrity, ICH GCP for trial conduct). Technologies supporting this use case focus on integrating heterogeneous data sources, ensuring data quality, and enabling analysis in a controlled, auditable manner:
-
MongoDB for flexible trial data capture: Clinical trial data structures can vary widely between studies and change mid-study (new protocol amendments adding fields, etc.). MongoDB's schema-less JSON model is well-suited for capturing such evolving or study-specific datasets. For example, a trial's patient record could be stored as a document containing all forms and visits as sub-documents – if a new form is introduced, it can simply appear in new records without altering a global schema. The FIMED project (a flexible biomedical data management tool) highlights MongoDB's benefit in dealing with "the dynamic nature of clinical data" ([7]). It allows schema changes on the fly and can handle semi-structured data easily. Scalability is achieved via sharding – e.g., by study or site – enabling horizontal scaling across studies. This means a pharma could store dozens of trials' datasets in one MongoDB cluster and query them as needed. Performance is strong for retrieval of whole patient records or subsets of data (with appropriate indexes), which is useful in medical data review applications. However, complex cross-patient or cross-study queries (like a join of all patients over 65 across trials) are not as straightforward – those are typically done after exporting to SQL or using Mongo's aggregation pipeline (which, while powerful, can become complicated for heavy analytics). Thus, MongoDB often serves as an operational data store in trials: for ingesting data from various sources quickly and serving it to web applications or APIs (like a clinical data review tool), while heavy-lifting analysis (like generating tables for a study report) happens in SQL-based systems after ETL.
-
Hadoop and Spark for large-scale trial data processing: When pharmaceutical companies want to analyze data across multiple trials or incorporate external real-world data alongside trial data, the volume and variety can become a big data problem. HDFS can act as a landing zone for massive combined datasets (e.g., pooling patient-level data from hundreds of trials to look for overall patterns or to create synthetic control arms). Spark is then used to clean, standardize, and combine these datasets. For example, a company may use Spark to transform all trial datasets into a common model (mapping different terminologies to standard ones, aligning data formats). Spark is also used for analysis of aggregated trial data: a pharma might run a Spark ML algorithm to find predictors of patient dropout using data from many studies (lots of records and features). Additionally, with the rise of digital trials, streaming data (like continuous glucose monitor readings in a diabetes trial) might be processed with Spark Streaming to summarize into daily or hourly metrics per patient. Spark can dramatically speed up what used to be SAS programs running for days on one server by distributing the load. It also allows using Python/R libraries within a distributed context, which many biostatisticians find attractive for advanced analysis. A concrete scenario: analyzing 20 years of clinical trial data (~several TB across all studies) to answer "How do placebo response rates change over time or vary by region in our CNS trials?" – this is something Spark can enable by crunching through all those datasets (after they've been standardized) and computing summary statistics. Historically, such an analysis might not even be attempted due to time/complexity, but big data tools make it feasible to derive insights from the troves of past trial data (often called "data reuse" or "clinical data mining").
-
Cloud Data Warehouses (Snowflake, Redshift, Synapse) for integrated analytics: After trial data is cleaned and aggregated, it's typically loaded into a relational warehouse for easy querying and reporting. Snowflake is a popular choice for modern clinical data warehouses because of its flexibility and support for high concurrency. A company might maintain a Snowflake database where each clinical study's data resides in a schema (structured as per CDISC SDTM or a company-specific model). Statisticians and data managers can then query using SQL, or connect BI tools to create dashboards (e.g., a data cleaning dashboard that shows query rates by site). Snowflake easily handles moderately large trial datasets and can join them with reference data (e.g., protocol metadata or public disease ontologies). AWS Redshift similarly is used as the backend for clinical data marts at companies that already have AWS infrastructure. For example, after each trial database lock, the data might be pushed into Redshift for archival and future cross-trial analysis. Redshift's SQL and integration with AWS analytics allow creation of combined datasets (like integrating pharmacovigilance data post-approval with clinical trial data to study long-term outcomes). Azure Synapse Analytics is often used when the data lake strategy is on Azure – raw data lands in Azure Data Lake Storage, and Synapse's serverless SQL pools or dedicated pools query and join the data for consumption. Synapse also can directly connect to Power BI for interactive analytics. A case study described using Synapse to unify and analyze pharmacy chain inventory data in real-time, which is analogous to using Synapse to unify trial operational data (e.g., site startup timelines, enrollment trends) for near real-time analysis by study managers. These cloud warehouses provide integration ease (with analysis tools) and strong security/compliance features (encryption, user management) to satisfy GxP requirements when handling patient data. They are typically validated as part of the clinical data flow (with controlled updates, etc.).
-
Informatica for ETL and data quality: Informatica (PowerCenter or IICS) is widely used to extract, transform, and load clinical trial data from source systems into a warehouse or data lake. For instance, Informatica can connect to an EDC database (like Oracle Clinical or Medidata Rave), extract patient data, transpose it into a flat structure, apply transformations (units conversion, coding medications to a standard dictionary), and load it into target tables. It excels at building reusable, auditable data pipelines – critical in a regulated trial context where every data transformation should be traceable. It also can perform data quality checks during ETL (e.g., flagging missing or out-of-range values for data managers to investigate). Many companies also use Informatica to manage reference data – for example, an MDM hub for all investigators and site information ensures that across different trials, "Dr. Jane Smith" is identified consistently, enabling cross-trial analytics by site or investigator performance. While newer cloud ETL options (AWS Glue, Azure Data Factory) exist, Informatica's domain knowledge and validation pedigree keep it as a staple in trial data management. It provides a visual interface that both IT and domain experts can review, which is helpful for validation and maintenance. On the downside, it requires licensing and skilled developers, but the trade-off is robust, documented processes – vital when preparing data for regulatory submission.
-
Graph databases for study relationships and oversight: While not yet mainstream, graph databases offer novel capabilities for clinical trial operations analytics. For example, a Neo4j graph could map relationships between investigators, sites, and studies: this could help identify that two different studies are using the same site and enrolling similar patient populations, which might present an opportunity or a conflict. Or a graph could link trial eligibility criteria to patient characteristics; querying it might find if patients who failed screening in one trial could be eligible for another (helping recruitment). Some research even uses knowledge graphs to design trials by linking inclusion criteria to databases of patient populations. TigerGraph could handle a very large network of patients from real-world data to find matches for trials, effectively a feasibility analysis at big data scale. While currently much of trial data analysis is relational, graphs might become more used as data linking needs grow (especially in decentralized trials or when linking trial data with real-world data in complex ways).
Example: A clinical data management team needs to integrate and clean data for a large Phase III trial and prepare analysis datasets. The trial uses a Medidata Rave EDC and also collects continuous ECG data from a wearable patch. First, they use Informatica to ETL the clinical eCRF data: mapping the Rave export (with many tables) into a standardized set of SDTM datasets (like demography, adverse events, labs, vital signs). Informatica applies transformations (converting lab units, coding verbatim terms to MedDRA) and populates the SDTM fields, flagging any discrepancies (e.g., lab values outside expected ranges) for review. This ETL job runs nightly, loading into a Snowflake schema for that study. Parallelly, the wearable ECG data (huge JSON files with timestamped heart rate, etc.) arrives in an Azure Data Lake. They run a Spark job on Databricks to process this raw sensor data for each patient: computing derived metrics like daily mean heart rate, detecting any arrhythmic events, etc. Spark writes these results into Snowflake as additional tables (linked by patient ID and date). Now Snowflake holds both traditional CRF data and the novel sensor data, all queryable with SQL. Statisticians connect to Snowflake with SAS and R to perform interim analyses, like correlating the continuous heart data with reported adverse events. They create some custom metrics (like time to arrhythmia after dose) using SQL window functions in Snowflake due to the large volume of data (Snowflake handles it efficiently). Additionally, the study's project manager uses Tableau connected to Snowflake to monitor data quality – e.g., a dashboard showing number of missing data points per site, number of protocol deviations per week, etc. Meanwhile, on the operations side, the team uses Vault CTMS to track site performance (enrollment numbers, protocol deviations). The data engineer sets up a feed from Vault CTMS (via API) into the Snowflake warehouse so they can combine it with the data metrics. They notice via a Tableau visualization that one site with many protocol deviations also has a high variability in the wearable data – possibly indicating training issues at that site – and they alert the clinical operations lead. Throughout, patient identifiers in Snowflake are coded, and only authorized users can access the re-identified mapping (stored securely in Vault). The ETL and analysis processes were validated (with test cases comparing output to known correct values), and all transformations are documented for the CSR (clinical study report). By blending Informatica, Spark, and Snowflake, they managed both conventional and high-volume streaming data in one analytical environment, yielding richer insights (like identifying safety signals in ECG data early and site performance issues) while meeting compliance requirements (traceability of data transformations, access control, audit trails of who queried data via Snowflake's logs).
Comparison: Technologies for Clinical Trial Data
| Technology | Strengths in Clinical Data Use Case | Weaknesses/Considerations | Real-World Adoption |
|---|---|---|---|
| MongoDB (Document DB) | Flexibility: Adapts to evolving CRF structures without schema redesign. Ideal for storing all data for a patient or site in one JSON document, including unstructured entries (notes, images references). Rapid development: New studies or amendments can be accommodated quickly. Also useful for building APIs for clinical data retrieval (one query can fetch a whole patient's data JSON). | Not optimized for heavy cross-record analytics (complex aggregations require MapReduce or aggregation pipelines). Many analysis tools expect relational data, so additional steps may be needed to use Mongo data in SAS or Tableau. Lacks built-in referential integrity – ensuring consistency across documents (e.g., patient exists before events are added) is up to the application. Domain teams may be less familiar with querying Mongo (though tools like Compass or custom UIs help). | Niche use but growing: Some pharma employ Mongo in clinical data review platforms (where medical reviewers browse patient profiles that include forms, labs, etc.). Also used in trials that collect a lot of unstructured data (e.g., patient diaries, genomic info) to store alongside structured data. Traditional EDC vendors are also looking at NoSQL to handle ePRO and wearable data influx. Mongo isn't replacing core EDC yet, but acts as a complementary store for new data types in trials. |
| Hadoop & Spark | Big data integration: Efficiently combines data across multiple studies or huge internal/external datasets for meta-analysis. Complex analytics: Enables simulations (e.g., trial outcome simulations using resampling) or ML (predict patient dropout, etc.) on full datasets, which would be slow or infeasible in serial fashion. Spark's parallel processing can drastically reduce time to derive analysis datasets when data volume is very large (like processing high-frequency sampling data from hundreds of patients). | Overkill for single-study analysis – SAS or SQL on a smaller dataset may be simpler. Requires engineering: setting up clusters or using services like Databricks, plus writing Spark jobs in Python/Scala. Clinical programmers largely use SAS/R; getting them to use Spark might require a wrapper or training. Thus, Spark often sits behind a user-friendly layer. From a validation standpoint, outputs from Spark might need reconciliation with SAS results to ensure acceptability for regulators. | Emerging adoption: Big pharma have started "data science" teams that reuse clinical data via Spark to inform design of new trials (e.g., establishing historical control distributions). CROs like IQVIA use big data platforms to offer aggregated insights across sponsor trials. For routine study work, Spark is less visible but may underlie tools that handle high-volume data like continuous monitoring platforms or risk-based monitoring tools analyzing central lab data trends. |
| Cloud Data Warehouse (Snowflake/Redshift/Synapse) | Unified repository: Puts all cleaned trial data in one place where it can be easily queried with SQL or connected to BI/analysis tools. Great for ad-hoc queries during medical review or regulatory submission preparation (e.g., "list all patients who had event X within Y days of dosing"). Scalability: Can handle large Phase III data and multiple studies concurrently, supporting corporate-level analytics (portfolio safety summaries, etc.). Security: Fine-grained access control means, for example, unblinded data can be restricted to certain users automatically. | Initial setup effort to define data models (often SDTM-like) and build ETL. Users need SQL skills or front-end tools to use the warehouse (though many in clinical ops and stats do have those). Cost can accumulate if very large data or many queries, but generally minor vs. trial costs. One must ensure the warehouse stays synchronized with source data (ETLs after major database updates). Also, making the warehouse part of validated workflow means change control on its structure and careful testing of ETL, which is extra overhead but manageable. | Very high adoption: Most pharma have a clinical data mart or warehouse. In modern setups, this is often on cloud (Snowflake is a popular choice in several top 10 pharma; others on Redshift or Synapse per their cloud alignment). These warehouses are used for medical monitoring (during trials) and for integrated analyses (like pooling data for submission). For example, one big pharma used Snowflake to integrate data from all Phase I studies to find common safety signals and streamline Phase II design. Another uses Synapse to allow project managers to track study milestones and data in one interface. These warehouses become more crucial as trials incorporate more data streams – they serve as the hub to bring it all together for analysis. |
| Informatica (ETL/MDM) | Robust, repeatable ETL: Ensures that data from EDC, labs, and other sources are merged correctly every time. Minimizes manual data handling, reducing errors. Data quality firewall: catches issues during ETL so they can be resolved (e.g., patient mismatch between datasets). MDM provides consistent reference data (investigator, site, drug dictionaries) across all studies, enabling easier cross-study analysis and compliance (like ensuring consistent investigator names in filings). | Proprietary tool requiring specific expertise and licensing. Changes in source schemas (like a new CRF version) require updating mappings which can be bureaucratic in validated environments. Some agile teams prefer code (Python, etc.) for flexibility, but then lose the built-in lineage and governance Informatica provides. Also, for very novel data types (images, genomic data), Informatica might not have out-of-box support, requiring custom solutions in those cases. | Industry standard: Virtually all large organizations have used Informatica for clinical data warehousing or data migration in some form. It's common for companies to have automated extraction from EDC with Informatica. As they move to cloud, many are adopting Informatica's cloud services for continuity. MDM usage in clinical context (like maintaining a global site master) is also common – e.g., companies require any new site to be checked against the master to avoid duplicates, which Informatica MDM or similar handles. The longevity of Informatica in pharma attests to its trustworthiness in validated processes. |
| Neo4j / Graph DB | Relationship analysis: Could help identify patterns like site networks (if one PI works at multiple sites or trials, helpful for study planning), patient journey outside of trial (linking trial data to subsequent real-world data via patient as node), or adverse event networks. Graph traversal can answer complex questions that would require many SQL joins. For example, "find all trials where a certain lab test elevated and the patient later had an adverse event related to it" – a multi-hop query a graph can handle. | Niche and requires graph thinking shift. Not many off-the-shelf graph applications for clinical trial management; likely requires custom development by data engineers and collaboration with domain experts to encode relevant nodes/edges. Ensuring data privacy in a graph that might include patient connections to external data is crucial (need to anonymize properly). So far, regulatory submissions and trial reporting don't accept graph outputs directly; graphs would supplement human decisions or feed into standard analysis. | Limited but experimental: Some large sponsors have exploratory projects linking their trial data with real-world data or research data in a knowledge graph to enable holistic queries (for internal decision-making). For example, a company might link trial eligibility criteria with real-world patient data to inform protocol design – a graph query might find how many patients in a claims database would meet proposed criteria. This is still an emerging application, but as data integration becomes more complex, graph approaches may gain traction for internal analytics. |
| Veeva Vault (Clinical) | Unified trial operations and content: Vault's clinical suite (eTMF, CTMS, Study Start-up, eConsent, etc.) brings all operational data and documents into one platform, breaking down silos. This improves data consistency (e.g., site information in CTMS matches what's on documents in eTMF). Real-time tracking: Teams can see up-to-date status of documents, approvals, and milestones. From a data perspective, Vault's structured objects (like study, country, site, milestone) provide a readily queryable source via API for trial management data. | Vault is more about operational data and documents than the subject data – you wouldn't analyze efficacy results in Vault. Therefore, data engineers still need to integrate Vault data with clinical datasets in warehouses for complete picture. During transition to Vault, companies have data in legacy systems and Vault, requiring consolidation. Also, customizing Vault (adding fields/objects) should be done carefully to maintain upgrade paths – some analytics needs might require creative use of standard fields or external calculations. | Rapidly becoming standard: Many sponsors have adopted Vault eTMF and are adding CTMS. This means a lot of previously unstructured tracking data is now accessible in a database form via Vault. Data engineers are leveraging Vault's reporting API to pull metrics like "average site activation time" or "number of protocol deviations per site" to warehouses. As more adopt Vault EDC, even clinical patient data could come through Vault (though typically that will be exported out for analysis). Companies like GSK, Novartis, BMS etc., are known Vault users in clinical – this trend likely continues. Vault's presence ensures that operational analytics (like performance KPIs) are far easier – data engineers can get those from one source instead of collating spreadsheets from each study. |
In summary, managing clinical trial data involves orchestrating multiple technologies: operational systems (EDC, CTMS, eTMF, etc.) to capture and manage trial execution data, and analytics platforms (ETL tools, data warehouses, big data processors) to aggregate, analyze, and learn from the data. Data engineers serve as the bridge between these, ensuring that high-quality data flows from where it's captured to where it's analyzed without silos or integrity loss. By using modern big data tech alongside traditional tools, they can handle new data types and larger scales (like digital health data in trials), enable real-time insights (like dashboards for trial monitoring), and reuse data across studies (for example, pooling control arm data to reduce the need for new placebo patients). All of this must be done under rigorous compliance controls, as trial data is highly regulated and privacy-sensitive. When done successfully, these approaches reduce trial execution risks (through better monitoring and faster decision-making) and accelerate the path to clinical insights (by making it easier to query and analyze the rich data collected in trials). In short, big data technologies – used appropriately – are helping clinical teams run trials more efficiently and get new treatments to patients faster.
Regulatory Data Management and Compliance
Pharmaceutical companies operate in a strictly regulated environment, generating enormous amounts of documentation and data to meet requirements from agencies like the FDA and EMA. Regulatory data management encompasses handling submission content (e.g., eCTD documents for drug approvals), tracking product registrations and approvals worldwide, managing regulatory commitments and correspondence, and ensuring that all records are audit-ready and compliant with regulations. The challenges here are less about raw volume (though large companies manage millions of documents) and more about complexity, traceability, and integrity – every submission has dozens of components and dependencies, and errors or inconsistencies can lead to approval delays or compliance actions. Key technologies focus on content management, workflow, and structured tracking of regulatory information:
-
Veeva Vault RIM (Regulatory Information Management): Vault RIM has become a leading solution for managing regulatory content and data on a single cloud platform. It includes modules for document management (authoring, reviewing, approving all the documents that go into a submission) and for tracking the lifecycle of regulatory activities (submission planning, health authority questions, approvals, variations, renewals). A major benefit is that it replaces disparate tools (like separate tracking spreadsheets, document repositories, email trails) with one platform. For example, when assembling an eCTD dossier for a new drug, teams use Vault Submissions to organize documents into the correct CTD hierarchy, link supportive documents (like raw data or literature references) to summary documents, and ensure everything is present for each region. Vault can then publish the eCTD sequence (generating the XML backbone and distributing the PDF files as required) and once submitted, the sequence is locked in Vault Submissions Archive for future reference. All this occurs with Part 11-compliant audit trails and electronic signatures in Vault. Data model integration is a differentiator: Vault doesn't just store PDFs; it also stores metadata (like submission ID, product, country, regulatory procedure, status, dates, etc.) in structured fields. This allows powerful queries and reports – e.g., "show me all pending submissions by region and phase" or "list all documents reused from a previous submission." It also avoids mistakes like missing a required document, since Vault can validate content against a predefined checklist. Vault's cloud architecture is highly scalable (used by large companies to manage tens of millions of documents) and accessible globally (via web, with performance optimized by CDNs). It provides APIs and reporting tools, which data engineers can use to extract structured regulatory data (for instance, a list of approved indications per country for a product) to combine with other data (like manufacturing or launch data for planning). From a compliance perspective, using Vault simplifies validation because much of the platform's functionality is pre-validated by Veeva – customers focus on validating their configuration and usage, not the underlying software.
-
Legacy Regulatory Systems (Documentum-based ECM and custom trackers): Many companies historically used enterprise content management (ECM) systems like Documentum (with life-science add-ons like FirstDoc) for regulatory document management, and separate tracking databases (often custom) for structured data about submissions and approvals. These systems served well to store files and basic metadata, but they often weren't unified – e.g., the Documentum repository might not know the status of a submission (that info could be in a spreadsheet or an Access database). Data engineers often had to pull data from multiple places to get a full regulatory picture. For example, answering "Which markets have we submitted for this product and what is each status?" might involve consulting a tracking database for markets and statuses, and the document repository for confirming submission contents. With Vault RIM, that answer is in one system now. However, during transitions, many companies still have regulatory data split among old systems and Vault, requiring integration. Data engineers may need to migrate historical data into Vault or build interim reports that merge data from Documentum and Vault.
-
Relational databases/warehouses for regulatory analytics: Even with Vault or similar, companies often maintain a data warehouse for regulatory KPIs (key performance indicators). This warehouse might integrate data from RIM, HR systems (for resource metrics), and even external benchmarks. For example, management may want to know the average time from submission to approval for each region over the past 5 years, and compare it to industry averages – a warehouse would collect internal data and perhaps industry data to produce that analysis. Data engineers could use Snowflake or Redshift to host this, pulling data from Vault (e.g., submission and approval dates) and storing it alongside targets or benchmarks. They can then feed a Power BI or Tableau dashboard that visualizes trends like "Submission approval time by region by year" or "Proportion of submissions approved on first cycle vs requiring additional information." These insights help optimize regulatory strategy (e.g., identifying regions where submissions lag so they can add resources or adjust processes). A warehouse also helps in global regulatory compliance oversight – e.g., tracking that all post-approval commitments (like Phase IV studies required by authorities) are being met. If Vault is used to log commitments, that data can flow into the warehouse and a dashboard can show which commitments are due next quarter, ensuring nothing falls through the cracks.
-
Spark/NLP for regulatory intelligence: Regulatory intelligence involves monitoring the external environment – new regulations, guidelines, competitors' approvals and failures, etc. This often means sifting through unstructured text: health authority guidelines, meeting minutes, public assessment reports, etc. Spark NLP or other text mining tools can be used to process this. For example, a data engineer might use Spark to parse all FDA briefing documents for Advisory Committee meetings in a therapeutic area to find common concerns raised – helping their team prepare better documents addressing those concerns. Another example: using NLP to identify when a new guideline draft from EMA contains requirements that differ from the previous version, flagging it so the regulatory policy team can respond. This is akin to "big data" because it might involve scanning thousands of pages of text and comparing versions or summarizing content, which manual reading can't scale to easily. While much regulatory intelligence is still human-driven, these tools augment that by catching details or patterns humans might miss. They must be used with caution (not to miss nuanced context), but they can dramatically cut the labor of scanning documents. For compliance, these tools output recommendations or summaries – humans still make decisions – so they don't directly need validation like a system of record would, but they do need quality control to ensure they're reliable enough to act on.
-
Graph databases for regulatory knowledge graphs: A regulatory knowledge graph could link many entities: products, submissions, countries, manufacturing sites, documents (like label texts), and even regulations and guidelines. Querying this can answer multi-dimensional questions that are cumbersome otherwise. For instance, "Find all products that have manufacturing site A in their approval, and list which countries those approvals are in, and whether any of those approvals required a site-specific inspection" – this could be traversed in a graph (Product -> Manufacturing Site -> Submission -> Country -> Inspection outcome). With relational data, it might require numerous joins and data from multiple systems. As companies compile more comprehensive digital records (with Vault RIM holding many connections already, plus supply chain systems tracking sites), constructing a graph on top of them for advanced queries is plausible. It can also assist in impact analysis: if a regulation changes (a node in the graph), one can traverse to see which products or submissions or processes are linked to that regulation and need updating. This futuristic use of graphs could greatly improve proactive compliance management (imagine a graph that instantly shows that a new environmental regulation affects the packaging of 12 products – triggering the regulatory team to file appropriate variations). This is still forward-looking, but data engineers should be aware of graph technology's potential as the industry's data becomes more interconnected and query complexity grows.
Example: A regulatory affairs department is preparing a global rollout for a new vaccine. They use Veeva Vault RIM to manage the core dossier and country-specific variations. After initial approvals, they have commitments: for instance, to conduct a post-marketing safety study and submit periodic safety update reports (PSURs) yearly. Vault's tracking shows these commitments, with due dates. The data engineer sets up a Vault API extraction to pull all open commitments and their due dates into a Power BI dashboard that also shows responsible owners. This ensures visibility so nothing is missed – e.g., a commitment to submit a PSUR to Japan is highlighted as due in 2 months, prompting action. Meanwhile, the global regulatory head asks: "How do our approval timelines compare to the industry average?" The data engineer obtained industry benchmark data (perhaps from a consultant or public sources) and stored it in Snowflake. They combine it with their internal Vault data of actual submission and approval dates. The resulting analysis shows, for example, that their EMA approval took 15% longer than industry average. Investigating why, they use Spark NLP on the EMA's public assessment report and extract major objections raised. They find the EMA had concerns about a specific efficacy endpoint definition. The team realizes that providing more clarity in initial submissions could avoid such delays. They update their global submission template accordingly – a direct process improvement derived from big data analysis of text. Separately, a new guideline on vaccine adjuvants is released. The data engineer uses a Python script with NLP to compare it to the prior guideline. It flags that a new requirement is to include a specific analysis in the submission. They verify this and alert all product teams to incorporate that analysis for any future submissions involving adjuvants. Finally, they leverage their internal data for a knowledge graph pilot. Using Neo4j, they connect each product to its regulatory submissions, those submissions to their approval dates and any post-approval changes (like label updates), and also link products to any safety signals (from PV data). When a safety signal arises for the vaccine, they query the graph: it shows the signal node connecting to the vaccine node and also to an "ongoing study" node (because a post-marketing safety study is in progress for that issue). Thus, they know data to address the signal will come from that study, and they coordinate with PV to prioritize its completion – a holistic view that came from connecting regulatory and PV data. Throughout, all official data (submissions, approvals) remain mastered in Vault (with audit trails for any changes). The analytics outputs (dashboards, reports) are used internally for decision-making but any data going into filings (like responses to authorities) is sourced from validated systems (Vault, safety DB, etc.) to maintain compliance. In essence, they used Vault for operational control and big data tools for strategic insight, marrying compliance with intelligence. The outcome is faster approvals in some regions (thanks to learning from benchmarks and guidelines) and proactive risk management (thanks to integrated data views).
Comparison: Technologies for Regulatory Data Management
| Technology | Role in Regulatory Use Case | Differentiators and Compliance | Real-World Adoption |
|---|---|---|---|
| Veeva Vault RIM | Unified platform for regulatory document management and tracking of submissions/registrations. Used to author, approve, and archive submission documents, and to maintain structured data on each submission (status, dates, health authority interactions, commitments). Orchestrates global regulatory processes in one system. | Differentiators: Purpose-built for life sciences; includes standard object models for submissions, products, regions, etc., aligning with common regulatory scenarios. Combines content + data: e.g., a submission record ties together all supporting documents and metadata like indications. Offers automated workflows (e.g., routing a draft label for approval to all stakeholders) with e-signatures compliant with Part 11. Cloud-based, so updates (like new fields for IDMP compliance) are delivered regularly by Veeva. Compliance: Delivers a validated state – agencies trust systems like Vault for document integrity and audit trails. It enforces security (each user only sees permitted data; e.g., regional affiliates see their region's submissions). Full audit logs on every field and document action. | High adoption: Most major pharma and many biotechs use Vault RIM or are transitioning to it. E.g., GSK, Sanofi, and others have publicly shared Vault RIM success stories (cutting dossier prep time, improving tracking of global filings). Regulatory agencies have begun receiving more consistent submission packages as a result (since Vault encourages using templates and reusing content). Data engineers at these companies now often retrieve data via Vault reports instead of hunting through spreadsheets, dramatically increasing efficiency in regulatory operations reporting. |
| Legacy ECM + Trackers | Historically, Documentum/SharePoint for documents and separate databases (or spreadsheets) for tracking submission status and registrations. These were used to fulfill the regulatory function before integrated RIM solutions. | Differentiators: Systems could be heavily tailored to company needs; some built very detailed tracking systems capturing minutiae of regulatory processes. Those with on-prem ECM liked control over data location and system changes (no vendor-driven updates). Compliance: When well-maintained, also Part 11 compliant (with custom workflows, audit trails). However, integrations between systems (e.g., marking a submission as "approved" in tracking DB and making sure all final approved documents are in ECM) relied on procedural controls, which could fail – hence the push to unify in Vault. | Waning adoption: Still in use at companies that haven't fully migrated. For example, a mid-size pharma might still use Documentum for doc management and an Excel workbook for tracking where each product is approved. Data engineers sometimes have to consolidate such data for global reports – a painstaking manual or semi-manual process. Most large companies have recognized the inefficiency and moved or are moving to integrated RIM. Those who haven't often cite cost or complexity, but they pay in manual labor and potential compliance risk. |
| Relational Data Warehouse for Reg Affairs | A centralized database (or data mart) integrating regulatory data for analytics and KPIs. Typically pulls from RIM (or legacy systems) and possibly external benchmark or project management data. Used for dashboards and reports by management. | Differentiators: By decoupling reporting from the live RIM system, complex analytics can be done without impacting the performance or data integrity of the operational system. Allows combining data sources: e.g., headcount data (from HR) with number of submissions (from RIM) to calculate submissions per employee. Compliance: Since it's primarily for internal decision support, it's usually not strictly validated to the same degree as RIM. However, source data from validated systems means outputs are trustworthy for management (but if any output is used in a filing, it would be cross-checked against validated source). | Common practice: e.g., A pharma uses an Oracle data warehouse to produce a monthly "Regulatory Dashboard" showing how many submissions planned vs delivered, reasons for any delays, upcoming approval projections, etc., across all regions. This is fed by their RIM and project management tools. Another company might use Tableau on top of Vault's reporting database for real-time metrics, but to do multi-year trends they export into a Snowflake warehouse. This approach is widely adopted because it provides strategic visibility – regulatory VPs can see trends like improvement in first-cycle approval rates after a process change. |
| Spark/NLP for Regulatory Intelligence | Processing large volumes of external text (regulations, health authority meeting minutes, competitor filings, etc.) to extract insights or summarize changes. Helps regulatory policy groups stay informed and anticipate requirements. | Differentiators: Automates what was a very manual, labor-intensive task (scanning gazettes, journals, websites). Can catch subtle changes (like wording differences in draft vs final guidelines) that humans might overlook. Over time, an AI might even predict likely questions or concerns based on what's been asked for similar products. Compliance: This supports regulatory strategy, but decisions guided by it are still made by experts. It's part of knowledge management, not official records, so it's not validated – however, traceability of sources is important (if an AI says "expect X request," one must trace that to actual past instances in documents to be credible). | Emerging: Large companies have dedicated Reg Intel teams using tools like Cortellis, but also experimenting with custom NLP. For example, Pfizer might use NLP to review all FDA Advisory Committee transcripts on gene therapies to glean common panel concerns, feeding that into how they prepare their panel briefing. This is not yet mainstream daily practice, but pilot projects abound. As NLP tech matures, we can expect it to become a standard aid (maybe integrated into RIM systems or as separate AI assistants) – data engineers will be involved in feeding these AI the right data and capturing their outputs. |
| Graph DB for Knowledge Graph | Integrating regulatory data (submissions, approvals, requirements) into a broader R&D knowledge graph connecting research, clinical, safety, and commercial information. Answer cross-domain questions and enable holistic decision-making. | Differentiators: Breaks silos between departments – one query could traverse from a drug's mechanism of action (research data) to its clinical trial outcomes to its regulatory approval status to its commercial performance. For regulatory specifically, it can highlight the context of a submission in the product's lifecycle. Compliance: As with other graphs, it's for analysis, not a source of official record, so validation is lighter. But it could be used in audits to quickly retrieve linked info (if an inspector asks how a certain post-marketing commitment is being addressed, a graph could show the commitment node linking to the ongoing study node and perhaps interim report documents). | Futuristic but plausible: Companies like AstraZeneca are pioneering enterprise knowledge graphs. Right now, these are mostly internal experimental tools. Over the next decade, if successful, more companies will adopt them. Data engineers would then need to integrate regulatory nodes (like a node per submission, per regulatory query, per approval) into these graphs. This could greatly enhance institutional memory – new employees could query the graph to learn everything about a product's history without digging through archives. Currently, only advanced analytics groups in some pharma are touching this, but success stories could lead to broader adoption. |
Regulatory data management, once a predominantly manual and document-centric endeavor, is being transformed by these technologies into a data-centric, proactive process. With systems like Vault RIM, companies have near-instant access to any piece of regulatory information, with full context – this not only improves compliance (reducing the chance of missing a commitment or making a submission mistake) but also speeds up the regulatory timelines (teams spend less time chasing information, more time analyzing and responding). Big data and AI tools provide an edge in regulatory intelligence – by learning from vast amounts of external data, companies can foresee potential hurdles and address them in advance, leading to smoother approvals. Data engineers in regulatory affairs now find themselves enabling not just compliance reporting, but strategic insights – whether through dashboards that identify process bottlenecks or NLP analyses that help craft better submissions. The end result is that regulatory processes become more efficient and data-driven: submissions are more complete and aligned with expectations, authorities get the info they need with fewer questions, and products reach patients sooner. Moreover, improved tracking and analytics ensure ongoing compliance (no missed reports or commitments), protecting the company from regulatory penalties. In summary, big data technologies – from unified content management to advanced analytics – are empowering regulatory teams to manage complexity and volume with greater agility and intelligence than ever before.
Pharmacovigilance and Drug Safety Analytics
Pharmacovigilance (PV) – monitoring drug safety post-approval (and during trials) – generates and consumes huge amounts of data. Every year, millions of adverse event (AE) reports are collected worldwide through spontaneous reporting systems, patient support programs, medical literature, and digital media. The aim is to detect any safety signal (an unexpected pattern that might indicate a new risk) as early as possible and take action (update product labels, issue warnings, or even withdraw a product). Key challenges include volume (large datasets of individual case safety reports), variety (structured forms, free-text narratives, social media posts, etc.), velocity (the need for prompt signal detection and regulatory reporting), and veracity (ensuring data quality in often anecdotal reports). Big data technologies are increasingly crucial for efficient PV:
-
Hadoop/Spark for adverse event data processing: Many pharma companies augment their internal safety data (cases from their own products worldwide) with external datasets like FDA's FAERS and WHO's VigiBase, which are large (FAERS alone has >15 million reports). Spark is ideal for crunching these datasets to compute disproportionality metrics (like reporting odds ratios or Bayesian EBGM values) to find drug-event combinations reported more frequently than expected. For example, an open-source project leveraged Spark and Scala to process ~130GB of FAERS data and calculate likelihood ratios for signals. With Spark's parallelism, this finished in minutes rather than hours. Similarly, a pharma can use Spark to merge its global safety database (e.g., Oracle Argus data) with FAERS to see a fuller safety picture. Hadoop HDFS might store years of raw safety data (structured CSVs or Parquet files), enabling Spark or Hive queries across the entire history for trends (e.g., query 10 years of data to see if a subtle signal is emerging gradually). Spark's MLlib can also support PV by clustering cases or predicting outcomes. For instance, clustering all AE reports for a drug might reveal natural groupings of symptoms that constitute previously unrecognized syndromes. Spark is also used for data cleaning: it can harmonize drug names (which might be reported differently by different reporters) using big reference tables. Overall, Hadoop/Spark provide the muscle to handle the sheer scale of PV data integration and computation that traditional tools (like VBA or even SAS on a single server) struggle with.
-
Cassandra/MongoDB for real-time case management: PV requires real-time or near-real-time processing for serious cases. Cassandra can be used as a high-throughput store for incoming adverse event streams. For example, if a patient app allows adverse event reporting, each submission can be immediately written to Cassandra for durability and fast retrieval by safety staff. Cassandra's multi-datacenter replication ensures that reports are safe and accessible globally (important if companies have regional PV centers). It can also serve as the backend for a live PV dashboard (e.g., showing current volume of reports by product). MongoDB might be used to store the full JSON of case reports (including nested elements like multiple suspect drugs, multiple reactions in one case). This allows flexible querying (like searching text of narratives) and easy updating if new fields are added (like if regulatory requirements change to collect new info). In practice, the official case data ends up in a relational safety database (because ICH E2B reporting standards are often relational in structure), but these NoSQL systems can act as ingestion and working copies. They feed the relational system (with ETL or API), and provide a buffer that can be scaled out to handle spikes (e.g., a surge of reports after a safety alert). The benefit is reduced risk of losing data or system downtime – the case can be captured in NoSQL instantly and then processed into the safety system asynchronously.
-
Signal detection algorithms and specialized tools: Many PV teams use dedicated signal detection tools (such as Oracle Empirica Signal or MHRA's Sentinel). These tools use statistical algorithms on safety databases to highlight disproportionate reporting. Data engineers often integrate the output of such tools into workflows – for instance, writing new signals into a tracking system or combining them with clinical data to assess causal plausibility. However, big data tech allows customization beyond these tools. A company might develop its own signal detection pipeline with Spark that includes not just disproportionality but also trends analysis (using Spark time-series libraries to see if a particular AE is increasing over time for a drug) and even incorporates external data like frequency in untreated population (from an EHR dataset) to calculate empirical Bayes metrics. The advantage is flexibility – they can fine-tune algorithms and include any data source. The challenge is validating those custom methods and ensuring regulatory acceptance. But big data capability is a prerequisite to even explore advanced methods like logistic regression on millions of case data points (which Spark can do). Some are exploring ML-based signal detection (training models to classify if a drug-event pair is likely a true signal vs noise by learning from past signals). That requires feeding a model huge amounts of historical data – again a job for a big data environment.
-
Graph databases for pattern recognition: Adverse events often involve multiple factors (polypharmacy, comorbidities). Neo4j can represent the relationships in safety data naturally: a case can be a subgraph linking a patient node, drug nodes, event nodes, perhaps condition nodes (indicating the patient's medical history). By aggregating all cases into a graph, you can query patterns like "find any two drugs that share many event nodes in common" (potential drug interactions) or "find communities of patients based on event similarity" (to identify a syndrome). For example, if Drug A + Drug B together often lead to a triad of symptoms, a graph query can discover that by finding a cluster of cases (patient nodes) all connected to both Drug A and B and the same 3 event nodes. A traditional SQL approach might require complex self-joins and still not be straightforward to identify such a cluster. Graph algorithms like PageRank or community detection could highlight influential nodes (e.g., an event that is commonly connected to many drugs – perhaps a generic symptom like headache – vs a more specific event that might be more telling). TigerGraph's ability to handle very large graphs quickly could allow near real-time queries on a global graph of safety data (imagine querying a TigerGraph instance of all global ICSRs for complex patterns with sub-second latency – that could enable interactive safety analysis tools). This is cutting-edge and mostly in research or pilot phases at present – but some regulatory agencies themselves are looking into graph tech for their data, so industry may follow.
-
Machine learning and AI in PV: Big data technologies enable various ML and AI applications in PV. NLP is widely used to process case narratives and literature. For instance, an NLP model can extract drug names, event terms, and medical history from free-text narratives, speeding up case processing (some companies report >50% efficiency gain by assisting case entry with AI suggestions). Training such NLP models requires a large annotated dataset of narratives, which can be facilitated by big data (using Spark to assemble and preprocess tens of thousands of narratives for model training on GPUs). Another AI use is duplicate detection – identifying when two reports actually refer to the same patient and event (common in global reporting when a case might be reported by a doctor and the patient separately). ML models can compare cases and estimate a duplication probability. Implementing that across millions of# Big Data Technologies in Pharma: Use Cases, Implementation, and Comparisons
The pharmaceutical industry generates vast and diverse datasets – from genomic sequences and clinical trial results to regulatory documents, safety reports, and supply chain logs. Data engineers in pharma must choose appropriate big data technologies to store, process, and analyze this information at scale. This report explores key technologies – Hadoop (HDFS, Hive, HBase), Apache Spark, Cassandra, MongoDB, Snowflake, AWS Redshift, Azure Synapse Analytics, Azure Data Lake, Google BigQuery, Neo4j, TigerGraph, Veeva Vault, Informatica, DNAnexus, and Illumina BaseSpace – and how they are applied across major use cases. Each section focuses on a specific use case (e.g., genomics data analysis, clinical trials, regulatory data management, pharmacovigilance, manufacturing and supply chain, sales and marketing analytics), detailing which technologies are most commonly used, how they are technically implemented, what differentiates them, and providing concrete examples. Comparisons are provided in tables for attributes like scalability, cost, performance, integration ease, compliance features, and real-world adoption, to help data engineers evaluate solutions.
Genomics Data Analysis and Bioinformatics Pipelines
Genomic and multi-omics data analysis in pharma involves processing massive sequencing outputs (DNA/RNA reads, variant files) and integrating results for drug discovery or precision medicine. Key challenges include scalability (handling petabytes of sequencing data), processing speed (aligning reads or calling variants across thousands of genomes), flexible pipelines, and compliance (securely handling potentially identifiable genetic data). Data engineers leverage a mix of on-premises big data frameworks and specialized cloud platforms:
-
Hadoop (HDFS, Hive, HBase) for distributed genomic storage and query: Genomic files (FASTQ, BAM, VCF, etc.) are enormous. HDFS provides a fault-tolerant distributed file system to store terabytes of sequence data across clusters, enabling parallel access. Hive (SQL-on-Hadoop) can be used to impose structure on variant call data, allowing analysts to query large variant datasets using SQL ([1]). HBase (NoSQL on Hadoop) supports fast lookups (e.g., by genome position), which is useful for random-access queries in genomics. These Hadoop components allow data engineers to manage huge NGS datasets on-prem or in IaaS environments, though newer cloud object storage is also popular.
-
Apache Spark for large-scale genomic processing: Spark is a cluster computing engine ideal for iterative algorithms and large-scale analytics. In genomics, Spark accelerates pipelines by parallelizing tasks like sequence alignment, variant calling, and joint genotyping across nodes. For example, the GATK4 toolset from the Broad Institute uses Spark to speed up variant analysis on large cohorts. Spark's in-memory processing provides major performance gains over MapReduce, which is why it's considered "promising" for genomic pipelines. Data engineers use Spark (often via Databricks or cloud EMR) to run distributed transformations (e.g., computing allele frequencies on billions of variants) and machine learning on omics data (e.g., clustering gene expression profiles). Spark can connect to HDFS, cloud storage, or NoSQL stores, making it a flexible backbone for genomic data workflows.
-
Cloud Data Warehouses (Snowflake, BigQuery, Redshift) for multi-omics integration: After raw genomic results are produced, researchers often need to integrate them with clinical data or metadata. Cloud warehouses excel at joining and analyzing such heterogeneous data. Snowflake has been used to store combined datasets (genomic variants, clinical traits, assay results) in a queryable form. It handles complex joins and aggregations with ease and minimal tuning. Google BigQuery similarly allows interactive querying of large genomics datasets (and provides access to public genomics data like the 1000 Genomes), enabling easy comparison and annotation. Amazon Redshift is often chosen by AWS-centric teams to integrate NGS data (e.g., variant tables) with other research data; Redshift Spectrum can even directly query variant files in S3 without full ingestion. These warehouses provide SQL interfaces, concurrency, and integration with BI tools, which help data engineers deliver genomic insights to scientists and clinicians in familiar formats (e.g., dashboards of key variants by patient subgroup).
-
NoSQL and Graph Databases in genomics: Some genomic data doesn't fit well in tables. MongoDB can store experiment metadata or gene annotations as JSON, offering schema flexibility for evolving data types (like new sequencing metrics). It's used to store and query semi-structured results (e.g., variant annotations or functional genomic data) across experiments. HBase/Cassandra can handle time-series from sequencers or stream genomic sensor data (like real-time DNA sequencing devices), ensuring high write throughput and quick retrieval by key (e.g., run ID). Neo4j and TigerGraph can represent biological knowledge graphs – linking genes, proteins, pathways, and phenotypes. Data engineers use graphs to enable queries like "find drug targets that interact with genes mutated in this dataset", which involves traversing relationships that are cumbersome in SQL. Graph analytics can highlight network patterns (for instance, Neo4j's algorithms can find clusters of genes that share many connections to diseases, hinting at polygenic effects). While core genomics pipelines rely more on HPC and Spark, NoSQL and graph databases play supporting roles in storing and exploring the massive web of metadata and knowledge around genomic findings.
-
Specialized Genomic Platforms (DNAnexus, Illumina BaseSpace): Many pharma leverage domain-specific cloud platforms for NGS data. DNAnexus provides end-to-end management of genomic data and pipelines in a compliant cloud environment. It can handle petabytes of data and orchestrate complex workflows (written in WDL/Nextflow) on scalable compute clusters, all with audit trails and fine-grained access control. DNAnexus actively manages >80 PB of data ([6]), illustrating its scalability. Data engineers integrate DNAnexus by using its APIs to launch jobs and retrieve results into broader data ecosystems (like pulling variant calls into a warehouse for cross-patient analysis). Illumina BaseSpace Sequence Hub is another widely used platform, especially in labs directly using Illumina sequencers. It offers one-click secondary analysis with Illumina's DRAGEN pipeline (hardware-accelerated), drastically reducing turnaround time for results. BaseSpace is designed to be user-friendly for bench scientists and provides a secure environment (HIPAA and GDPR compliant) for genomic data. Data engineers typically export data from BaseSpace into company databases for downstream integration, but Illumina's newer Connected Analytics platform is bridging that gap by allowing more custom analysis on BaseSpace-hosted data. These platforms reduce the infrastructure burden on data engineers for primary analysis, letting them focus on downstream processing and integration.
Example: A pharmaceutical genomics team is analyzing whole genome sequences from 1,000 cancer patients to discover biomarkers for drug response. Raw data (~300 TB) is stored on HDFS in a secure on-prem cluster. They use a Spark cluster on Yarn to run GATK4's Spark-enabled variant callers, processing all genomes in parallel – cutting variant calling time from weeks to days. The resulting VCF files (variant lists) are saved back to HDFS and also loaded into Google BigQuery. In BigQuery, they join variant data with a clinical outcomes table (response = responder or non-responder) to perform a genome-wide association – essentially scanning for variants enriched in responders. BigQuery's speed allows them to execute this giant join and aggregation across billions of data points in a manageable time. They identify a set of candidate variants. For deeper insight, they push these results into Neo4j to see biological context: they load nodes for genes containing those variants, and connect to known pathways and drugs (using data from public knowledge graphs). Neo4j reveals that several hit genes cluster in the same pathway – a strong clue about the drug's mechanism. While this is happening, new sequencing data arrives from ongoing experiments. Those FASTQ files go straight to Illumina BaseSpace, where the DRAGEN pipeline calls variants in a couple of hours. Data engineers set up an automatic export: as soon as BaseSpace produces a VCF, it triggers a Lambda function that writes the data to their HDFS for Spark processing and also appends it to BigQuery via streaming insert. This keeps their datasets up-to-date seamlessly. Throughout, compliance is maintained by using a secure cluster (with Kerberos) for HDFS/Spark, and ensuring patient identifiers are coded (the BigQuery data is de-identified, with only a study ID to link back if needed). By mixing these technologies – Hadoop/Spark for heavy-lift computation, BigQuery for interactive analysis, Neo4j for context, and BaseSpace for efficient pipeline execution – the team rapidly iterates on genomic hypotheses. They not only discover a biomarker (variants in a pathway predicting response) but also generate biological hypotheses for follow-up, all in a fraction of the time a traditional approach would take. The findings are then validated and moved into the clinical trial's analyses, providing the team with a data-driven biomarker to test in future trials. This showcases how data engineering with big data tech accelerates precision medicine discoveries.
Comparison: Technologies for Genomics Data
| Technology | Scalability | Performance | Integration Ease | Compliance Features | Adoption in Genomics |
|---|---|---|---|---|---|
| Hadoop (HDFS/Hive) | Scales to petabytes across commodity clusters; add nodes to increase storage and throughput. | Great for high-throughput batch processing of large files (alignments, etc.). Hive enables SQL queries on huge variant tables but with higher latency (minutes). | Requires expertise to set up and manage. Integrates with Spark, but less so with user-friendly BI tools. Many genomic pipelines now use cloud storage in place of HDFS for simplicity. | On-prem deployment gives full control (important for protecting sensitive genomic data). Security via Kerberos; can be validated internally (though not trivial). | Historically high (1000 Genomes used HDFS). Many large institutes had Hadoop clusters; now often supplanted by cloud storage/compute. Still used in organizations with existing big data infrastructure for omics (e.g., NIH institutes). |
| Spark | Scales from a laptop to large clusters on-prem or cloud (Databricks, EMR). Can utilize thousands of cores for massive parallelism. | Excellent for iterative algorithms (variant calling, joint genotyping) and distributed ML on genomic data. In-memory processing provides 10–100x speedups over disk-based methods for these tasks. | Accessible via Python (PySpark) or R (SparkR), which lowers barrier for bioinformaticians. Connectors for HDFS, S3, JDBC to warehouses, making it fit in many workflows. Requires coding; benefit if team has data engineering support. | Can be run in secure environments (e.g., VPC with encryption). Logging and versioning of code needed for GxP compliance if used in clinical context. Often used in research (non-GxP) or in validated pipelines where outputs are verified by secondary methods. | Widely used in genomics research and pipeline development (e.g., GATK4 Spark tools). Many top pharma (Regeneron, AZ) use Spark clusters/Databricks for large-scale omics analytics and pipeline optimization. |
| Snowflake | Virtually unlimited (auto-scales storage; compute can scale up or out with multi-cluster warehouses). Handles terabyte–petabyte scale with high concurrency. | High performance for complex queries joining genomic and clinical data. Automatic tuning means even non-DBAs get good performance. Not intended for quick single-record lookups (but that's rarely needed in genomics analytics). | Very easy to load data (COPY from cloud storage) and query with SQL. Many genomic analysis results (variants, counts) fit naturally into tables that Snowflake can handle. Integrates with Python/R via connectors for further analysis or visualization. | Offers HIPAA compliance, encryption, network isolation options. Fine-grained access control (down to columns, which could be used to mask patient IDs). Often part of validated analytic pipelines for regulated submissions (with controlled schema changes). | Rapidly adopted for integrative analytics in life sciences. Pharma biomarker teams use Snowflake to join N## Pharmacovigilance and Drug Safety Analytics (continued) |
- Machine learning and AI in PV: Big data technologies enable various ML/AI applications in PV that can learn from the wealth of safety data. For instance, natural language processing (NLP) models are trained on millions of case narratives to automatically extract structured information (drugs, adverse events, patient history) from free text. This significantly speeds up case processing – some companies have reported that AI-assisted case intake has automated up to 50% of data entry, allowing safety specialists to focus on assessment rather than transcription. Training such NLP models requires distributed computing (e.g., using Spark or TensorFlow on a cluster) to handle the volume of text data. Another AI application is duplicate case detection – using algorithms to identify when two adverse event reports likely refer to the same underlying incident (important for data cleanliness). A machine learning model can compare new incoming reports against a database of cases and flag probable duplicates (based on similarities in patient demographics, dates, drug, and event descriptions). Implementing this across millions of records is computationally intensive, so companies leverage big data tools to generate feature vectors for each case and perform similarity matching at scale. AI is also used for signal prioritization: for example, a predictive model might combine multiple inputs (disproportionality scores, clinical plausibility features, literature mentions) to rank safety signals by likely significance, helping PV teams focus on the most relevant signals first. These models are trained on historical signal outcomes (learning from past signals which turned out to be important vs those that were refuted) – a task requiring aggregation of diverse data (structured safety data, unstructured text, outcomes of investigations) in a big data environment. While regulators still expect human judgment in safety decisions, AI is becoming a valuable decision-support tool in PV, made possible by the ability to crunch vast datasets.
Example: A pharmacovigilance team monitors safety for a portfolio of drugs, receiving adverse event reports from around the world. All incoming cases (from call centers, partner companies, health authorities, and literature) are funneled into a central data lake on AWS S3 in near real-time. A Spark job runs every night to integrate that day's new cases with the master safety dataset (which includes 20 years of global safety data for all products). This Spark job updates disproportionality calculations for each drug-event pair. In one such run, it flags a new signal: a rare renal disorder appears disproportionately in reports for a recently launched medicine. The signal is automatically written to a "signal tracking" table in Snowflake and triggers an alert to the safety physician. Simultaneously, the PV team has an NLP pipeline (developed with spaCy and Spark NLP) that processes each case narrative upon arrival. For a new serious case related to this signal, the NLP model extracts that the patient had pre-existing diabetes and was on two other medications. It suggests MedDRA coding for the narrative (which the case processor verifies) and highlights that the patient's concomitant drugs are known to affect kidneys (information retrieved from a knowledge graph). This context – gleaned automatically – helps the safety physician quickly assess causality, noticing a possible drug-drug interaction. Meanwhile, the safety data scientist uses Neo4j to visualize all cases of this renal disorder: a graph query finds that many involve the combination of the new drug and one particular concomitant medication (the same one flagged by NLP). This insight (a potential interaction) is added to the signal evaluation report. Over the next week, an AI model for signal prioritization (trained on past signal outcomes) ranks this signal as high priority, given the strong disproportionality, supporting mechanistic plausibility (the drug combo could synergistically harm kidneys), and increasing reporting trend. Based on all this data-driven input, the PV team rapidly escalates the signal, leading to an update in the product label warning against concomitant use with that medication. All steps are documented: Spark logs the data processing and statistical outputs, Neo4j stores the evidence of relationships among drugs and events, and Snowflake holds the data that went into decision-making (with audit trails). This comprehensive, big-data-powered approach allowed the company to detect and act on a serious safety risk within weeks of launch, potentially preventing patient harm. Importantly, although AI and big data expedited the process, human experts reviewed the evidence and made the regulatory decisions, satisfying compliance while benefiting from advanced analytics.
Comparison: Technologies for Pharmacovigilance
| Technology | Role in PV Use Case | Benefits and Differentiators | Considerations | Real-World Adoption |
|---|---|---|---|---|
| Hadoop/Spark | Batch integration and analysis of large safety datasets (internal and external). Calculates disproportionality metrics (PRR, ROR, EBGM) on millions of case records. Performs large-scale merging of databases (company data + FAERS/VigiBase) and historical trend analysis. | Scale: Can process entire global safety databases quickly (Spark can compute a new signal index across 10 million records overnight). Flexibility: Custom algorithms (e.g., detecting temporal clusters or geographic patterns) can be implemented beyond what off-the-shelf PV tools provide. Enables advanced analysis like clustering of cases or machine learning on case features that wouldn't be feasible on single-server solutions. | Requires data engineering expertise and validation of new methods (regulators are used to traditional statistics in PV; novel metrics from Spark analysis must be understood and confirmed by PV experts). Also need to ensure data privacy (personally identifiable info in case narratives should be protected when using big data environments – typically done by using case IDs and keeping patient identifiers only in the secure source system). | High adoption in large pharma and regulators: Many companies use Spark or similar to support signal detection (often alongside traditional tools). Regulators like FDA and EMA use Hadoop/Spark in their signal detection platforms (FDA's FAERS public dashboard is powered by Hadoop). Industry examples: GSK built a Hadoop-based signal detection platform to combine company data with external data; Roche uses Spark to refine signal detection algorithms incorporating Bayesian methods. |
| Cassandra | Real-time ingestion and querying of adverse event streams. Used as a buffering layer to capture all incoming case data from various sources with high availability. Also backs real-time safety monitoring dashboards (e.g., current case count by product, day-by-day reporting rate during a product launch). | High write throughput: Can ingest thousands of case records per second without downtime, ensuring no loss of data even during spikes. Durability and availability: Replicated across data centers – critical for 24/7 PV operations globally. Fast key-based reads enable quick retrieval of a case or set of cases (e.g., all reports for a single patient or all cases in the last hour) to facilitate rapid triage. | Not ideal for complex analytical queries – data typically flows from Cassandra into a warehouse or Spark for heavy analysis. Data model must be designed carefully (e.g., might store data indexed by drug or by region for the queries needed). Maintenance and scaling of Cassandra requires expertise. Some companies opt for cloud alternatives (like DynamoDB or Cosmos DB) to reduce ops burden. | Moderate adoption: Some large PV departments use Cassandra or similar (DynamoDB) in their global intake systems – especially those that built custom PV case handling solutions. For instance, a company that developed a custom adverse event intake portal might use Cassandra under the hood for resilience. Not every pharma does this – many rely on vendor safety systems that have their own intake logic. But as PV goes more real-time and data-heavy, these technologies are creeping in to ensure scalability. |
| Neo4j / TigerGraph | Graph representation of safety data: patients, drugs, events, outcomes connected as a network. Enables detection of complex associations (like multi-drug interactions or syndrome of co-occurring events). Also used to link safety data with other knowledge (e.g., linking an adverse event node to literature or biological pathways that explain it). | Reveals relationships: Can find non-obvious connections – e.g., Neo4j can quickly find that "Drug A + Drug B" share an unusually large number of serious pneumonia nodes, suggesting a drug-drug interaction, as seen in the example. Graph algorithms can rank signals (PageRank could identify which adverse event nodes are most central – often reported with many drugs – to filter out common background events). TigerGraph's speed allows enterprise-scale graphs (billions of nodes/edges) to be queried almost instantly, which could support interactive signal exploration tools for PV experts. | Graph approach is new for many PV teams – need training to interpret results. Data preparation for graphs (especially merging data from multiple sources and defining meaningful relationships) is intensive. Also, the volume of data can be huge (each case can introduce many nodes/edges), so a robust graph infrastructure is needed. Regulatory decisions would not be made solely on a graph insight; graphs serve as a supportive analysis requiring validation through more traditional methods. | Experimental with increasing interest: A few pharma companies and research collaborations are exploring knowledge graphs for drug safety (often part of broader healthcare graph projects). For example, a collaboration between pharma and academia might use Neo4j to study polypharmacy adverse outcomes in elderly patients by graphing medical records and adverse events. Tools like AstraZeneca's "Safety Intelligence" initiative have looked at linking safety data with mechanistic data via graphs. While not mainstream, graph analytics in PV is on the radar, especially to tackle problems like drug interactions and syndrome identification. |
| Snowflake/BigQuery (Data Warehouse) | Central repository for integrated safety data and analytics outputs. Stores historical signal metrics, case metadata, product exposure data, etc., allowing analysts to query and join these easily. Also used to produce regulatory reports (like PSUR tables or annual safety summaries) by aggregating large safety datasets. | Easy slicing/dicing: Safety scientists can run SQL queries (e.g., "count of events by system organ class for drug X vs comparators") without needing specialist tools, complementing dedicated PV systems. Warehouses handle concurrency, so multiple teams (signals, compliance, epidemiology) can query data at once. Integration: Can join safety data with prescribing/exposure data to calculate reporting rates, or with clinical trial data to reconcile post-marketing vs clinical profiles. BigQuery's speed on huge datasets enables quickly answering ad-hoc safety questions that would otherwise take long database queries or manual work. | Needs robust data feeds from source systems (cases still maintained in validated safety databases; the warehouse gets copies for analysis). Data in the warehouse must be kept in sync with official safety data and properly anonymized. Analysts must be careful to interpret results correctly; warehousing safety data can sometimes lead to slight differences in counts (if, say, data was refreshed before reconciliation of some cases). Thus, outputs used for regulatory purposes usually undergo verification. | High adoption for analytics: Many PV departments complement their safety database (e.g., Argus, ArisGlobal) with a data warehouse for analytics and reporting. Often the safety system vendor provides BI extracts or the company builds ETL to a warehouse. Snowflake is used by some large pharma PV teams to host integrated safety data marts that combine spontaneous reports, literature cases, and even medical inquiries, enabling comprehensive oversight. BigQuery is used in some innovative PV setups, especially where they integrate real-world data (claims/EHR) to stratify safety data by exposure metrics. These warehouses are typically internal tools for trend analysis, benefit-risk assessments, and management reporting (number of cases, processing times, compliance with regulatory reporting timelines, etc.). |
| Informatica & Other ETL | Automated data pipelines to move safety data from intake systems to analysis platforms. Ensures data consistency between the source of truth (safety database) and analytical copies (warehouse, Hadoop). Also used to integrate diverse data sources (lab data, EHR data for epidemiology studies, etc.) into safety analyses. | Reliability: Critical for meeting regulatory reporting timelines – automates workflows like "extract all serious cases for quarterly analysis" with guaranteed repeatability. Data quality: Can enforce business rules (e.g., ensure all required case fields are populated before data is used in analysis). Reduces manual error in assembling datasets for things like periodic reports. | Needs configuration and maintenance, particularly when source systems change (like safety database upgrades or changes in data dictionaries). As with clinical ETL, any transformations must be validated. Also, volume can be a challenge – but modern ETL tools (Informatica Cloud, etc.) can handle large increments and have connectors for big data sources (like pulling data into Hadoop or Snowflake directly). | Standard practice: PV IT teams commonly use Informatica or similar (Talend, etc.) to manage data flows. For example, GSK might use Informatica to nightly update a safety data mart from their live safety system and to feed data to Empirica Signal. Essentially, wherever safety data needs to move from its operational home to somewhere else for analysis or sharing, ETL processes are set up, and those are often built with enterprise tools to ensure auditability. |
Pharmacovigilance is being transformed by big data technologies from a reactive, report-by-report process into a proactive, analytics-driven discipline. By aggregating vast amounts of safety data and applying advanced analytics:
-
Signal detection becomes faster and more sensitive – Distributed computing (Spark) spots subtle patterns in millions of records, and graphs or ML can uncover complex risk factors (like interactions or patient subgroups) that traditional methods might miss. In our example, these tools helped identify a drug-drug interaction signal within weeks of launch, something that might have taken much longer with manual review alone.
-
Case processing is more efficient and consistent – NLP and automation handle repetitive tasks (extracting data from narratives, coding events), reducing human error and freeing experts for deeper analysis. That means companies can keep up with growing case volumes without linear increases in headcount. Importantly, it also means regulatory compliance (like timely case reporting) is maintained or improved because cases are processed swiftly.
-
Benefit-risk evaluation is more comprehensive – Data warehouses and integration of real-world data allow safety teams to contextualize adverse events against how many patients are exposed and what risk factors they have. This leads to more informed decisions (e.g., determining if an adverse event rate is actually higher than background or not) and better communication with regulators and the public.
Throughout, compliance and patient safety remain paramount. Big data tools are used in PV to assist humans, not replace them: signals flagged by algorithms are reviewed by safety physicians, and automated case coding is verified by case handlers. All these processes are documented and auditable (with logs from Spark jobs, model outputs, etc.), so a regulator can see how a company is monitoring safety diligently. The result is a PV system that can handle the ever-increasing data in modern drug safety (from spontaneous reports, plus huge datasets like patient registries and social media) and extract actionable insights quickly, leading to faster safety updates and risk mitigation. In essence, big data technologies – from Hadoop clusters to AI algorithms – are empowering pharmacovigilance teams to detect risks sooner, analyze them deeper, and protect patients better, all while improving efficiency and compliance in meeting global safety obligations.
Conclusion: Across all these domains – genomics, clinical trials, regulatory affairs, and pharmacovigilance – big data technologies have become integral to solving pharma's data challenges. They bring the ability to scale (storing and processing huge datasets), speed (accelerating analyses that used to take days or weeks), integration (joining disparate data for holistic insights), and intelligence (via advanced analytics and AI). Importantly, these technologies are implemented in ways that meet the strict compliance requirements of pharma: validated workflows, audit trails, and data security measures ensure that even as data volume and complexity grow, data integrity and patient privacy are maintained.
External Sources (13)

Need Expert Guidance on This Topic?
Let's discuss how IntuitionLabs can help you navigate the challenges covered in this article.
I'm Adrien Laurent, Founder & CEO of IntuitionLabs. With 25+ years of experience in enterprise software development, I specialize in creating custom AI solutions for the pharmaceutical and life science industries.
DISCLAIMER
The information contained in this document is provided for educational and informational purposes only. We make no representations or warranties of any kind, express or implied, about the completeness, accuracy, reliability, suitability, or availability of the information contained herein. Any reliance you place on such information is strictly at your own risk. In no event will IntuitionLabs.ai or its representatives be liable for any loss or damage including without limitation, indirect or consequential loss or damage, or any loss or damage whatsoever arising from the use of information presented in this document. This document may contain content generated with the assistance of artificial intelligence technologies. AI-generated content may contain errors, omissions, or inaccuracies. Readers are advised to independently verify any critical information before acting upon it. All product names, logos, brands, trademarks, and registered trademarks mentioned in this document are the property of their respective owners. All company, product, and service names used in this document are for identification purposes only. Use of these names, logos, trademarks, and brands does not imply endorsement by the respective trademark holders. IntuitionLabs.ai is an AI software development company specializing in helping life-science companies implement and leverage artificial intelligence solutions. Founded in 2023 by Adrien Laurent and based in San Jose, California. This document does not constitute professional or legal advice. For specific guidance related to your business needs, please consult with appropriate qualified professionals.
Related Articles
Big Data in Pharma: Case Studies from Drug Discovery to Marketing
Explore real-world case studies of how pharmaceutical companies are leveraging big data, AI, and cloud computing across the drug lifecycle - from discovery to marketing - with measurable outcomes and lessons learned.
Google Cloud in Pharma: Transforming Drug Discovery, Trials, and Operations
A comprehensive analysis of how Google Cloud Platform (GCP) is revolutionizing pharmaceutical operations, from AI-powered drug discovery to clinical trial management and regulatory compliance.
Top 10 Open-Source Software Tools in the Pharmaceutical Industry (2026)
A comprehensive overview of the most influential open-source software tools transforming pharmaceutical research, development, and manufacturing, from cheminformatics to clinical data management and regulatory compliance.