
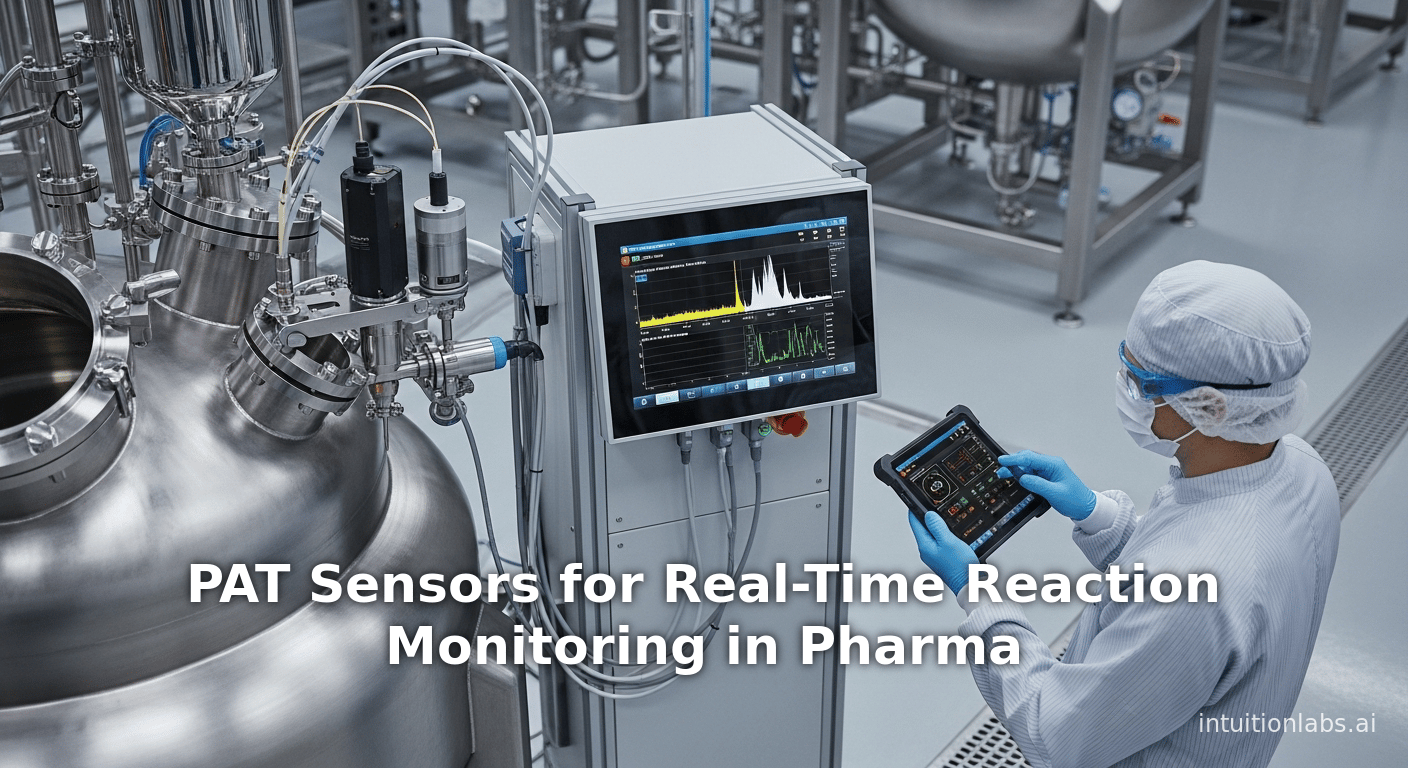
PAT Sensors for Real-Time Reaction Monitoring in Pharma
[Revised April 25, 2026] — Updated to reflect ICH Q13 (Continuous Manufacturing) adoption progress, FDA's 2024 final guidance on real-time release testing context, and refreshed pharmaceutical manufacturing market figures.
Executive Summary
Pharmaceutical manufacturing is transforming from traditional batch processing and end-point quality testing toward real-time, in-situ monitoring of chemical reactions using advanced sensors and data analytics. Regulatory initiatives such as the FDA’s 2004 guidance on Process Analytical Technology (PAT) have driven this shift, promoting continuous measurement of Critical Process Parameters (CPPs) and Critical Quality Attributes (CQAs) during production ([1]) ([2]). In practice, PAT systems integrate sensors such as near-infrared (NIR), Raman, FTIR, UV/Vis spectrometers, mass spectrometers, and even benchtop NMR into reactors and process lines, enabling continuous tracking of reaction progress, concentration profiles, and impurity formation ([3]) ([4]). For example, in one case a five-step continuous flow synthesis of the antibiotic ciprofloxacin employed in-line FTIR and Raman probes coupled with multivariate (PLS) models to predict intermediate and product concentrations with high accuracy (root-mean-square error ~2–3% of concentration) ([5]). Similarly, deploying NIR spectroscopy in a microreactor for an exothermic esterification allowed safe real-time monitoring of reactants and products; this not only expanded the experimental design space but also doubled the space–time yield compared to traditional batch reactors ([6]) ([7]).
These sensors feed live data into advanced control systems (distributed control, SCADA, cloud-based platforms) and analytical engines (chemometric models, AI/ML algorithms) to enable closed-loop control of reactions. Real-time data analytics (e.g. PCA, PLS, neural networks) extract quantitative information from complex spectra ([8]) ([9]), support predictive models, and detect anomalies or drifts on the fly. By linking sensor outputs to automated actuation (temperature, flow, feed rates), manufacturers achieve immediate adjustment of reaction conditions. The outcome is significantly improved process understanding, shorter cycle times, higher yields, and reduced waste – in effect enabling “real-time release” of drug products without waiting for end-of-batch testing ([10]) ([1]).
While the benefits are compelling, implementation also brings challenges: sensor calibration and fouling, data integration across heterogeneous systems, and meeting regulatory validation requirements. Nevertheless, the Industry 4.0 paradigm – embedding IoT connectivity and AI in pharma – promises a future of smart, digitalized plants. Integrated sensor networks and digital twins will further enhance predictive control and agility ([11]) ([9]). This report provides an in-depth review of current sensor technologies, data analysis methods, and real-world applications for reaction monitoring in large-scale drug production, along with case studies, data-driven evidence, and outlook on future developments.
Introduction and Background
History of Pharmaceutical Manufacturing and Quality Control
Pharmaceutical production is a complex, high-stakes industry, with a global market on the order of $600–700 billion per year and continuing to grow ([12]). Historically, drug manufacturing relied on batch processes with extensive post-production testing. In a typical batch plant, chemists would take discrete samples from reaction vessels or intermediates and analyze them in the laboratory (e.g. by HPLC, GC, titration) to assess conversion, potency, and purity ([13]) ([14]). Only after these end-point results could batches be released. This “Quality by Testing” paradigm meant that process deviations were identified after they occurred, often when large quantities of material were already processed. The Food and Drug Administration (FDA) and other agencies recognized this inefficiency and risk. For example, an industry commentator noted in 2008 that “potato chip manufacturers use more advanced manufacturing technology than pharmaceutical manufacturers,” highlighting that many other sectors had dramatically improved efficiency and control (e.g. semiconductor fabs achieving >10,000% efficiency gains) while drug plants remained comparatively static ([15]). In response, regulators initiated the Quality by Design (QbD) and Process Analytical Technology (PAT) frameworks to modernize pharmaceutical manufacturing.
In September 2004, the FDA formally issued its guidance "PAT — A Framework for Innovative Pharmaceutical Development, Manufacturing, and Quality Assurance” ([1]). This guidance encouraged the design, analysis, and control of product and process parameters in real time by measuring and controlling CPPs and CQAs. Simply put, manufacturers were urged to move from end-of-line testing toward in-process monitoring using modern analytical tools. The goal was higher process understanding and consistent product quality. In parallel, the ICH (International Council on Harmonisation) released its Q8–Q10 guidelines (2006–2008), codifying QbD principles (systematic process design and risk management) and promoting the concept of a “design space” of operating parameters that assures quality. More recently, ICH Q13 ("Continuous Manufacturing of Drug Substances and Drug Products") was adopted in November 2022 and formally implemented by FDA, EMA, and PMDA across 2023–2024, providing the first internationally harmonised framework for continuous manufacturing of small molecules and therapeutic proteins — a regulatory milestone that effectively requires the kind of real-time PAT-based control strategies surveyed in this report ([16]) ([17]) ([18]). Together, these initiatives transformed pharmaceutical engineering from an empirical “science of the batch” into a data-driven discipline.
Indeed, by around 2010 the definition of PAT and QbD had become standardized across agencies and industry organizations. ASTM International formed PAT committees, ISPE and USP worked on implementation guides, and companies began realigning their process validation strategies away from 3-batch formulas toward continuous verification and real-time release testing. As one review noted: “PAT could be a fundamental tool for the present QbD and CPV [Continuous Process Verification] to improve drug product quality” ([19]).
Industry 4.0 and Digital Transformation in Pharma
Concurrently, the broader trend of Industry 4.0—or the Fourth Industrial Revolution—has reached pharma manufacturing. Industry 4.0 combines the Internet of Things (IoT), artificial intelligence (AI), robotics, and advanced computing to create “smart factories” ([20]). In pharma, this means embedding sensors and computing throughout the plant so that all processes are autonomously monitored and controlled.For example, the IoT envisions a network of interconnected sensors, instruments, and equipment that continuously digitize data on raw materials, environmental conditions, machine status, and process performance ([21]). This digitization of previously manual Q.C. data creates a rich data lake. With advanced storage (cloud, big data platforms) and analytics, the plant can apply machine learning and AI to detect patterns, predict deviations, and optimize operations across scales ([22]) ([9]).
The pharmaceutical sector has been somewhat conservative in adopting full Industry 4.0, due to regulatory and complexity hurdles. However, recent analyses emphasize clear benefits: increased agility, safety, product quality, and yield while reducing waste ([23]) ([24]). As one commentator summarized: “Internet of things, artificial intelligence, robotics… have the potential to dramatically increase the agility, efficiency, flexibility, and quality of industrial production of pharmaceuticals” ([23]). Building the smart factory requires several technologies: reliable data capture (sensors), robust data storage (genomic and historical archives), and advanced analytics (simulation, AI, digital twins). Key research highlights that digitization is the first step – converting analog signals (e.g. handwritten test records) to real-time digital feeds ([21]). Only with high-fidelity digital data can higher-level capabilities (predictive control, end-to-end optimization, “lights-out” manufacturing) be achieved ([22]) ([9]).
In summary, modern drug production is shifting toward an integrated sensor/analytics paradigm. Process Analytical Technology is now an essential enabler of this digital transformation ([2]) ([10]). The following sections survey the range of sensor types and data technologies being applied, illustrate their use in large-scale reaction systems, and discuss the implications for drug manufacturing now and in the future.
Sensor Technologies for In-Line Reaction Monitoring
Modern PAT relies on a variety of in-line and at-line analytical tools to interrogate chemical reactions in real-time. The choice of sensor depends on the reaction type, phase (solid, liquid, gas), and target metrics (concentration, conversion, impurity levels, physical properties). In practice, the most widely used sensors for chemical reactions include spectroscopic probes (NIR, Raman, FTIR, UV/Vis), spectrometric detectors (mass spectrometry, NMR), and physical-chemical probes (pH, temperature, pressure, conductivity). Emerging technologies (optical particle analyzers, acoustic sensors, microfluidic chips) also play roles in specific contexts. Below we detail the main categories.
Near-Infrared (NIR) Spectroscopy
Near-Infrared (NIR) spectroscopy analyzes overtone and combination vibrational bands of molecular bonds (typically C–H, O–H, N–H) in the 800–2500 nm range. NIR probes can be fiber-optic coupled and inserted directly into a reactor or pipe, enabling non-invasive, in-situ measurements ([25]). Because NIR penetrates relatively deep into samples, it can quantify concentrations of organics (drug substances, solvents, impurities) or measure moisture content in heterogeneous mixtures. NIR is exceptionally fast (milliseconds), allowing high scanning frequency and near-continuous data flow ([25]). It is also nondestructive and requires no reagents, making it especially useful for real-time monitoring.
NIR has become a cornerstone of PAT for continuous and batch processes alike. Studies note that “NIR spectroscopy established itself as a powerful tool for real-time reaction monitoring” due to its rapid, nondestructive sampling ([25]). For example, in the continuous development of active pharmaceutical ingredients (APIs), NIR probes have been installed on flow reactors to track reagent depletion and product formation. A recent microreactor example demonstrated inline NIR plus chemometric PLS models could accurately predict reactant and product concentrations in an acid-catalyzed esterification; this enabled real-time calculation of conversion and space–time yield ([6]). The same data revealed that the microreactor setup achieved double the yield of a comparable batch reactor, directly linking process monitoring to improved productivity ([6]) ([7]). Long-duration manufacturing runs also rely heavily on NIR: in one published 28-hour continuous tablet compaction case, over 12,600 NIR spectra were collected in real time, resulting in highly repeatable control of blend concentration (101.17% of label claim, SD 2.17%) ([26]).
In practice, NIR data typically require multivariate calibration (e.g. PLS regression) because the absorbance bands are broad and overlapping. Nevertheless, advanced chemometrics can extract quantitative concentrations even in complex mixtures ([6]) ([25]). NIR’s speed and fiber-applicability make it ideal for monitoring aqueous and solvent-phase reactions, crystallization, and granulation processes in pharma. It is often supplemented by other sensors when more specificity is needed, but as a frontline PAT tool its use is ubiquitous ([25]) ([27]).
Raman Spectroscopy
Raman spectroscopy provides complementary molecular information to NIR. It is based on inelastic scattering of laser light, yielding sharp “fingerprint” vibrational spectra that are highly specific to chemical structures. Modern immersion Raman probes (e.g. fiber-optic Raman) can be inserted into reactors to monitor both liquids and solids in real time. A key advantage of Raman is its insensitivity to water, making it effective even in aqueous reactions. Additionally, Raman can often distinguish among structural isomers or polymorphs that might appear similar in NIR/IR.
In pharmaceutical PAT, Raman is frequently cited for its ability to detect intermediates and determine reaction end-points ([28]). Liu et al. demonstrate this for a complex multi-step synthesis: Raman spectra were used to identify unstable intermediate formation and track endpoint progression in real time, data that would be difficult with classical offline HPLC sampling ([28]). The same study also notes that Raman (like NIR) allows simultaneous monitoring of solids and solution phases, making it versatile for slurry or crystallization chemistries ([28]). In practice, industry case studies have deployed Raman probes in continuous reactors: for example, real-time Raman monitoring was used to verify steady-state operation in a continuous flow reactor, and transient exothermic events were observed by correlating Raman signal changes with reaction progress ([29]).
Raman does have limitations: fluorescence interference, laser safety (for large-scale use), and the need for relatively clear optical access can restrict its usage. Nonetheless, its high chemical specificity has made it indispensable in many PAT applications ([28]) ([29]). Common use cases include monitoring aromatic or nitrile-blanketed molecules, polymerizations, and any reaction where water-rich media preclude IR. Despite these challenges, “the tools exist” for closed-loop Raman monitoring, as one expert put it, and integration with advanced data models enables actionable feedback ([30]) ([28]).
Infrared (IR) Spectroscopy (FTIR/ATR-FTIR/ATR-UV)
Infrared (IR) spectroscopy, particularly Fourier-transform IR (FTIR), has long been used in process monitoring. Attenuated Total Reflectance (ATR) probes allow IR analysis of a small “window” in contact with the reactor fluid. Whereas NIR measures overtone bands, mid-IR (∼400–4000 cm^-1) yields fundamental vibrational absorptions, providing rich chemical detail. ATR-FTIR is especially useful for tracking species with strong IR bands (carbonyls, double bonds, etc.). For example, Zhang et al. applied an ATR-FTIR probe to a cooling crystallization process, correlating IR spectra with solution concentration to model nucleation zones ([31]).
ATR-UV/Vis probes (absorbing in the ultraviolet/visible range) are also used as PAT tools, though more common in monitoring colored compounds or transitions (e.g. charge-transfer complexes, metal catalysts). The ACS Omega lifitegrast study notes UV/Vis as a candidate for new inline monitors alongside IR and Raman ([32]).
In large-scale reactors, ATR-FTIR offers real-time monitoring of solution composition (e.g. functional groups or intermediates). However, it can be sensitive to scattering by solids or bubbles and typically requires periodic cleaning of the crystal window. Inline IR is often paired with chemometrics or used specifically when NIR channels yield insufficient information ([32]) ([28]). Combined approaches (e.g. dual ATR-FTIR and Raman) have been demonstrated for detailed monitoring of organic synthesis steps, leveraging the strengths of each modality ([29]) ([6]).
Mass Spectrometry (MS) and Ion Mobility
Mass spectrometry brings exceptional sensitivity and specificity to reaction monitoring, though it typically requires sample introduction or ionization devices. Recent advances have led to “on-flow” or on-line sampling MS techniques that can sample reactor streams continuously. One example is ESI (electrospray ionization) coupled with ion mobility (ESI-IM-MS): this technique was used to monitor a reductive amination reaction in real time ([33]). Johnston et al. showed that an ESI-IM-MS setup could record full reaction profiles over just 300 seconds, measuring starting materials, intermediates, and products with µM detection limits ([33]). Notably, ion mobility separation revealed mechanistic details (e.g. a hemiacetal intermediate) that conventional methods missed ([34]). Such examples illustrate that advanced MS techniques can provide dynamic species-level insight far beyond what spectroscopic PAT alone offers.
Other MS-based approaches include Direct Inject LC-MS, desorption MS, and probe-based mass analysis. While powerful, these often involve trade-offs (e.g. need for dilution or chromatography) and so are more common in development labs. Nonetheless, MS yields the ultimate chemical specification (exact mass of species) and is finding niche use for small-volume flow screening or impurity tracking ([33]) ([27]). In the context of continuous production, on-line or at-line MS requires robust automation (autosamplers or direct injectors) and usually closed-loop with chemometric calibration.
Nuclear Magnetic Resonance (NMR) Spectroscopy
NMR spectroscopy provides direct quantitation of molecular structures and concentrations. Traditionally a lab technique, benchtop NMR instruments have now been adapted as process sensors. These compact NMR devices (often permanent-magnet based) can be placed in-line or at-line to analyze flow streams, offering full spectral fingerprints of mixtures without needing a reference compound.
For example, Eichinger et al. (2019) developed a continuous manufacturing platform utilizing an inline benchtop NMR spectrometer to monitor a metal-organic reaction ([4]). The NMR served as a calibration reference for an NIR model, providing highly reliable composition data that were used to iteratively optimize the process yield and profitability ([4]). In that study, the NMR sensor enabled real-time, adaptable control: it not only validated product quality but also guided an online optimization algorithm to maximize plant profit. Such use cases highlight NMR’s value as a high-accuracy sensor (though at higher cost). The authors noted that this combination of NMR with other PAT tools supported plug-and-produce modular setups, and was successfully demonstrated on a pilot-scale production line ([4]).
In summary, NMR offers chemical-id and quantitation of complex mixtures (similar to HPLC but much faster), often replacing multiple wet-chem steps. Its downsides are cost, complexity, and occasionally limited sensitivity compared to MS. However, its development for PAT means some manufacturers now use it for critical API reactions and for calibrating/validating simpler sensors like NIR ([4]) ([27]).
Physical-Chemical Probes (Temperature, Pressure, pH, etc.)
Beyond spectroscopy, traditional reactor probes remain fundamental PAT inputs. Temperature and pressure sensors are ubiquitous on reactors: they measure key CPPs that must remain within design limits. High-precision thermocouples, RTDs, and pressure transducers feed into control loops to maintain safe operation (especially for exothermic reactions). For example, in the NIR-monitored esterification microreactor, resistive temperature devices (RTDs) were co-located with the NIR probe to ensure isothermal conditions ([35]). Continuous monitoring of these physical parameters is a prerequisite for safe control.
pH and conductivity sensors are also used when the chemistry involves ionizable species. Zero-dead volume pH probes can track acid-base titrations or fermentation parameters continuously. In large-scale reactors, however, pH glass probes typically serve more in bioprocesses than in harsh organic chemistries (due to fouling concerns). Similarly, mass flow meters and level sensors track feed addition and tank inventories in real-time. These sensors do not directly measure concentration, but they inform mass balances and actuations.
While their data are simpler, physical probes play a critical role. For instance, a sudden deviation in temperature or pressure can indicate a runaway reaction or a blockage. Often, multiple single-point sensors must be interpreted in concert. This limitation motivates the use of richer PAT sensors (as noted below).
Advanced and Emerging Sensors
As PAT matures, newer sensor modalities are emerging for specialized use:
-
Acoustic Resonance (Silent) Sensors: Piezoelectric or acoustic probes (e.g. Acoustic Resonance Spectroscopy, ARS) can monitor particulate movement or crystallization in a reactor. For example, acoustic sensors have been used to detect granule formation in fluidized beds ([36]). In liquid phase, their use is less common, but research explores them for viscosity or agitation detection.
-
Laser-based Particle Monitors (FBRM/SFVA): Focused Beam Reflectance Measurement (FBRM) or Spatial Filter Velocimetry (SFV) are used mainly for crystallization/precipitation processes. Though not chemical analysis, they can infer crystal size and count in real time – useful when reaction outcome depends on solid formation.
-
Thermal Imaging: In some cases, infrared cameras or fiber-optic thermal sensors can map temperature distributions on reactor surfaces. This can reveal “hot spots” not captured by a single RTD.
-
Mass/Dielectric Sensors: In slurries, in-line mass or permittivity probes can sometimes correlate to concentration (e.g. low or high frequencies) ([37]).
-
Sensor Arrays / Electronic Noses: For multicomponent gas monitoring (e.g. solvent vapors or headspace CO₂), sensor arrays with pattern recognition are used. These analogues of electronic noses can detect leaks or byproduct formation.
-
Microfluidic and Miniaturized Sensors: Lab-on-a-chip sensors (fluorescence, field-effect transistors, etc.) are being developed for small-scale or tethered sampling. One study created a microfluidic reaction device with integrated injection and optical detection to measure kinetics of fast reactions, with detection limits of tens of µg/mL ([38]). Such systems demonstrate that even bench-scale PAT can acquire kinetic data in real time for process modeling.
Each of these emerging sensors has potential, though most remain at pilot or niche levels in pharma. However, they point to a future where nearly every aspect of a reactor (concentration, phase, heat release, mixing) can be monitored in real time.
Summary of Sensor Modalities
To summarize, Table 1 lists key sensor types used in pharmaceutical reaction monitoring:
| Sensor / Technique | Measured Parameter | Applications/Example | Advantages | Limitations | References |
|---|---|---|---|---|---|
| NIR Spectroscopy | Organic compound concentrations; moisture; blend uniformity | Liquid/solid reaction streams; crystallization; continuous blend compaction | Fast, non-destructive, fiber-optic probes; in situ, simultaneous multi-species sensing ([25]) ([6]) | Broad overlapping bands; requires chemometrics; weaker signal (esp. H₂O interference) | [60] [54] [23] |
| Raman Spectroscopy | Molecular fingerprints; concentration of reactants/products | Aqueous reactions; tracking intermediates; polymorph/duality detection | Highly specific to structure; works in water; solid and liquid compatible ([28]) ([29]) | Fluorescence interference; laser safety concerns; probe fouling risks | [9] [46] |
| ATR-FTIR / (UV-Vis) | Specific functional groups; concentration of IR-active species | Monitoring reactions with strong IR bands; online colored species | Detailed specificity (fundamental vibrational absorps); real-time data | Sensitive to scattering; window fouling; UV only for certain chromophores | [9] [52] |
| Mass Spectrometry (MS) | Exact mass of ions; species identification | Fast reaction screening; impurity tracking; gas streams (GC, MS) | Ultimate specificity; identify unknowns; sensitive (ppb–ppm) ([33]) | Often require sample prep/separation; slower; complex instrumentation | [41] [52] |
| NMR Spectroscopy | Quantitative molecular structure; concentrations | Continuous flow organics; final product ID; calibration of other sensors | Label-free quantitation; rich molecular info; linear response | High cost; lower throughput; bulky (though benchtop systems exist) ([4]) | [52] |
| Reaction Calorimetry | Heat flow / total enthalpy of reaction | Safety timing (explosives); scale-up thermal modeling | Direct measure of exotherms; no chemical calibration needed | Cannot distinguish causes (e.g. reaction vs side-reaction) ([39]); slow integration | [54] |
| pH / Conductivity | H⁺ concentration; ionic strength | Acid-base reactions; fermentation; solvent switches | Direct measure of ionizable species; robust and standard | Primarily aqueous; possibly slow response; probe fouling | (General knowledge) |
| Temperature / Pressure | Reactor heat and pressure | All chemical reactors (e.g. exothermic control, gas-phase reactions) | Fundamental safe-guarding; fast response | Indirect info on chemistry; single-point measures | (General knowledge) |
| Dielectric / Permittivity | Bulk permittivity (water/solvent content) | Dilution monitoring; mix uniformity | Bulk, bulk liquid measure; often low-cost | Non-specific; requires correlation models | [57] (bioprocess context) |
| Optical Particle Sizing | Particle size/distribution | Crystallization; precipitation monitoring | Real-time PSD info (e.g. FBRM) | Only reports solids; requires interpretation | [58] (blending ref.) |
Table 1. Selected in-line sensor technologies and their roles in monitoring pharmaceutical reactions. “Applications” illustrates typical use-cases; “References” cite representative studies.
As seen above, spectroscopic sensors dominate chemical reaction monitoring. NIR and Raman are workhorses for concentration tracking, while FTIR and UV/Vis fill niche roles. Mass spec and NMR provide complementary detail when needed. Traditional probes (T, P, pH) remain essential even where they don’t directly measure composition. The references illustrate real-world use: for instance, Eichinger et al. describe an NMR-integrated continuous synthesis platform ([4]), and Johnson et al. use NIR + chemometrics in a microreactor ([6]). All these generate continuous data streams, often requiring multivariate analysis to convert raw sensor signals into actionable quality information.
Data Analysis and Process Control
Collecting real-time data is only half the battle; extracting insight and control signals from the sensor streams is equally critical. Modern PAT leverages advanced data analysis (chemometrics and machine learning) and control architectures (DCS/SCADA, MES) to turn raw signals into actionable intelligence.
Chemometric and Multivariate Analysis
Spectroscopic sensors typically produce rich, multivariable data (e.g. absorbance spectrum, Raman spectrum). Direct interpretation (peak-by-peak) is often impractical during continuous runs. Instead, chemometric models such as Principal Component Analysis (PCA) and Partial Least Squares Regression (PLSR) are standard for real-time processing ([6]) ([25]). These methods derive quantitative models of concentration or quality as functions of spectral inputs. For instance, in the ciprofloxacin flow process, two separate PLS models (built offline) were deployed online: one mapping FTIR spectra to intermediate concentration (RMSEP ~2.2 mg/mL, i.e. 2.8% relative error) and another mapping Raman spectra to final API concentration (RMSEP ~0.9 mg/mL) ([5]). During the continuous 11 h production, these models ran in “Solo_Predictor” software, continuously predicting product concentrations and enabling immediate verification of process performance ([5]).
Similarly, in the microreactor esterification, PLS models were built that could predict the concentrations of acetic acid, methanol, methyl acetate, etc. from inline NIR spectra ([40]) ([7]). With these models, the reactor’s conversion and yield were calculated on-the-fly, and deviations could be detected by comparing spectral scores via PCA ([6]) ([7]). The study noted that such real-time analytics “facilitated the determination of conversions, space–time yields, and effective reaction rate constants” and helped identify experimental anomalies ([7]).
Other multivariate techniques are also used. Principal Component Regression (PCR), clustering, and more recently nonlinear methods (neural networks, Gaussian processes) have been applied. If the process dynamics are complex (nonlinear kinetics, multiphase flows), methods like artificial neural networks (ANNs) or random forests may offer better predictive power ([41]) ([42]). For example, researchers have demonstrated that Recurrent Neural Networks (RNNs) can effectively model the evolution of a continuous pharmaceutical process for use in model predictive control ([41]). In general, the trend is toward hybrid and AI models that combine first-principles knowledge and real data (sometimes called "digital twins" or grey-box models) to forecast process trajectories ([9]) ([43]).
Key performance metrics in PAT modeling include prediction error (RMSEP or relative error), sensitivity (detection limits), and robustness to noise. The cited case studies report impressive figures: sub-3% relative errors in concentration, micromolar detection limits ([5]) ([44]). These metrics justify the use of such models for control – if a PAT model predicts product concentration within specification tolerance, the process can be released with high confidence.
Process Control Architectures
In an industrial setting, PAT sensors feed into the plant’s control system. Typically, this means integration with a Distributed Control System (DCS) or Programmable Logic Controllers (PLCs) via analog/digital I/O or OPC connections. Sensor signals are routed into the SCADA/MES layer, which provides a unified dashboard for operators and links to databases. Advanced architectures even involve cloud-based databases for storing high-volume PAT data, enabling cross-facility benchmarking and advanced analytics ([22]).
A key concept is the closed-loop control strategy. In batch processes, PAT data may simply be recorded and used post-run (with feedback into the next batch design). In continuous processes, high sampling rates allow intra-process corrections. As discussed above, multivariate SPSS (Soft Sensor) outputs can automatically adjust valve positions, temperatures, or feed rates. This second-level (supervisory) control aligns all unit operations, as opposed to only local control loops for pumps or reactors ([45]). The PharmTech review notes that effective continuous control requires not just in-line sensors but a coordinated strategy: “the entire process flow must be coordinated and equipped with second-level control systems that supervise and align the work of individual unit operations” ([45]).
Software platforms (e.g. AspenOnline, AVEVA, or vendors’ proprietary tools) manage the data pipeline. SPC charts and alarms can be overlaid on sensor trends. Real-time release testing (RTRT) approaches may be employed, where a final release decision is made algorithmically based on cumulative PAT data, rather than waiting for offline assays ([46]). This requires thorough process understanding; minor model drift or sensor faults must be caught and corrected. To that end, many PAT campaigns include redundancy (e.g. two spectrometers monitoring the same attribute to cross-verify) ([47]) and cross-validation.
Data Challenges and Solutions
High-frequency PAT generates very large and complex data sets. Terabytes of time-series data, spectra, and images can accumulate even in a single campaign. Key challenges include: ensuring data quality (de-noising, baseline correction, calibration updating), synchronizing disparate streams (aligning sensor time stamps), and cybersecurity for connected networks. Especially in regulated pharma, data integrity and traceability are paramount. Any automated system must comply with 21 CFR Part 11 (electronic records) and validated in the context of GMP.
Machine learning approaches are addressing some of these challenges. For instance, process-informed forecasting models (which embed physical constraints into ML architectures) have shown more robust predictive control under sensor noise ([9]). Such hybrid models combine first-principles (e.g. heat/mass balances) with neural nets, improving accuracy and plausibility. Similarly, unsupervised learning can detect sensor faults or outliers: if a PAT sensor drifts, a PCA model may signal divergence from the calibration manifold, triggering maintenance. One study noted that PCA classification could identify invalid spectra and deviations in an ongoing reaction ([7]).
Another trend is the development of soft sensors, where an easily measured quantity (e.g. reactor power consumption, or NIR at one wavelength) is used via model to infer a more difficult variable (like impurity level). This reduces reliance on expensive hardware for every attribute and can be updated dynamically.
Overall, the marriage of PAT sensors with modern data science is what yields evidence-based control. Table 2 illustrates concrete examples of this synergy in practice (see next section).
Case Studies: PAT in Action
The following case studies illustrate how sensors and real-time data are used in large-scale or industrially-relevant pharmaceutical syntheses. Each example shows specific sensors employed and the measurable impact on process understanding or performance.
| Case / Process | Sensors / Techniques | Monitored Outputs | Outcomes / Benefits | Reference |
|---|---|---|---|---|
| 1. Continuous 5-step flow synthesis of ciprofloxacin (antibiotic) | In-line ATR-FTIR and fiber-optic Raman spectrometers; PLS chemometric models | Intermediate and final API concentrations (mg/mL) in-stream | Real-time prediction of concentrations with high accuracy (RMSEP ~2.2 mg/mL, ~2.8% error). Enabled continuous process verification and reactive adjustments ([5]). High product quality sustained over 11-hr run. | Miyai et al., 2021 ([5]) |
| 2. Batch synthesis of a lifitegrast intermediate (ophthalmic drug, multi-step) | Combined NIR and Raman spectroscopy (ASTM-approved optical probes); PLS regression | Reactant and intermediate concentrations; endpoint detection | Replaced hazardous offline HPLC sampling for hot reaction. Allowed determination of reaction endpoints in real time, reducing overreaction/impurities ([13]) ([28]). Improved safety and throughput. | Liu et al., 2024 ([13]) ([28]) |
| 3. Continuous direct compaction (tableting) – 28 h run | In-line NIR spectroscopy (transmission probe); multivariate models | Blend API concentration (% label claim) in real time | 12,633 on-line NIR spectra collected. Achieved average API content 101.17% (±2.17%) in blend, tablets 100.86% (±0.40%), confirming uniformity ([26]). Demonstrated robustness of PAT at industrial throughput. | Ierapetritou et al., 2018 ([26]) |
| 4. Microreactor esterification (Acetic acid + MeOH) | In-line FT-NIR (Antaris II) with ATR probe; off-line GC for calibration; PLS and PCA | Reactant (acetic acid, MeOH) and product (methyl acetate) concentrations; conversion; space–time yield | Enabled safe mapping of reaction kinetics over high-temperature range. Predicted concentrations via PLS matched GC. Real-time data revealed achieved STY up to 2× higher vs. batch, expanding viable operating envelope ([6]) ([7]). | Harding et al., 2025 ([6]) ([7]) |
| 5. Automated reaction monitoring (development scale) – reductive amination | Continuous-flow ESI-ion mobility MS; high-speed data acquisition (seconds) | Concentrations of starting materials, intermediates, and product (µM) | Recorded full reaction profile within 300 s with µM sensitivity. Discovered a hemiacetal intermediate and optimized reaction time. Showed MS-based PAT provides mechanistic insight beyond chromatography ([33]) ([48]). | Johnston et al., 2013 ([33]) ([48]) |
| 6. Continuous metal-organic reaction (pilot) | Benchtop ^1H NMR with automated sampling; NIR spectrometer for cross-calibration | Real-time % composition of reactants/products | NMR used to calibrate NIR model and drive online optimization. Iterative adjustments based on NMR/NIR data maximized profit (via higher yield) and quality. Demonstrated plug-and-produce flexibility in a modular plant ([4]) ([27]). | Eichinger et al., 2019 ([4]) ([27]) |
Table 2. Example implementations of in-line monitoring in pharmaceutical chemical synthesis. Cases span batch and continuous processes; sensor outputs feed predictive models and control actions. Performance metrics (e.g. prediction error, yield improvement) are cited. References provide detailed case data.
Taken together, these examples underscore key themes:
- Accuracy and Efficiency: Inline models can achieve sub-5% errors in concentration prediction ([5]) ([33]). The ciprofloxacin flow run, for instance, achieved 2.8% error relative to high-performance liquid chromatography (HPLC) standards ([5]), which is comparable to typical lab uncertainty. This level of accuracy means the PAT system can essentially “stand in” for offline assays, enabling real-time release testing.
- Process Safety: Monitoring hazardous conditions becomes feasible. The lifitegrast study highlighted that taking samples from a hot reactor is dangerous; by using in-situ Raman/NIR, they avoided this risk entirely ([13]). Similarly, the microreactor esterification (an exothermic reaction) could be explored safely across a wide parameter range because the sensors detected early signs of deviation ([6]) ([7]).
- Yield and Throughput: Real-time feedback facilitates optimization. In the esterification case, knowing concentrations allowed calculation of conversion and space–time yield in real time; this revealed that the continuous microreactor was dramatically superior to batch. In the NMR case, the feedback loop directly maximized yield/profit by adjusting conditions. Such data-driven optimization can shorten development time and increase throughput substantially.
- Regulatory Compliance: All cited implementations are compatible with GMP frameworks. They employ validated models and audit trails. For instance, [23] noted that their NIR monitoring gave nearly identical results to off-line FT-NIR on tablets, providing regulators confidence in the method. The FDA and EMA have explicitly approved submissions using PAT/QbD approaches, viewing them as complementary (or superior) to traditional QC when properly demonstrated.
Impact, Discussion and Future Directions
Quality and Productivity Gains
The collective impact of real-time reaction monitoring on pharmaceutical production can be assessed through multiple lenses: product quality, operational efficiency, and economic value. By continuously tracking critical quality attributes, manufacturers gain assurance that every output unit meets specifications. For example, one real-world continuous compounding line reported a 0.4% standard deviation on final tablet API content (compared to ±2% in the blend) ([26]). This consistency is largely credited to the closed-loop control enabled by PAT.
Waste reduction is another quantifiable benefit. A PAT-monitored process can often detect off-spec conditions before large volumes are affected, so that adjustments or quarantines are applied promptly. In contrast, a traditional batch might require discarding entire batches after release testing. Case study data support this: in a PAT-equipped continuous line, all tablets from the major 28-h run met specification (average content 100.86% ±0.40%) ([26]), implying near-zero scrap. In an even more striking example, the microreactor variant of an often-dangerous reaction not only eliminated the need for off-spec disposal but actually increased yield by two-fold ([6]) ([7]). Every percentage point of yield boost is significant for expensive APIs.
Time-to-market can also be shortened. Traditional process optimization requires iterated trial batches with off-line analysis. Sensor-based real-time data accelerate this loop: conversion versus temperature/flow charts can be generated in hours, not days. The microreactor study explicitly noted expanding the experimental “design space” was only practical with in-line PAT ([6]). Similarly, Eichinger et al. used NMR and NIR data to adjust parameters almost continuously, achieving optimal runs faster than multiple batch campaigns ([4]).
From a regulatory viewpoint, real-time monitoring aligns with Continuous Process Verification and Real-Time Release Testing (RTRT). Agencies have stated that robust PAT frameworks improve assurance of consistent quality ([1]) ([19]). In fact, Rubin et al. (2018) project that the industry will increasingly treat process validation as an ongoing (rather than one-shot) activity, enabled by continual PAT data collection ([49]). The FDA’s Quality maturity model envisions a future where “real-time release of drug products” is routine, and advanced PAT will be key to making that practicable ([50]).
Challenges and Considerations
Despite strong incentives, implementing sensor-based monitoring in large-scale drug synthesis is non-trivial. Technical and organizational hurdles include:
-
Sensor Robustness and Calibration: Industrial reactors expose probes to harsh chemicals, pressure, and temperature cycles. Sensor fouling, window coating (for optical probes), and drift are real issues. Regular calibration with standards is required. For spectral methods, a sufficient calibration dataset covering expected process variation must be collected (often via factorial experiments) before deployment ([27]) ([6]). Developing and maintaining robust PLS models across production scales remains work-intensive.
-
Data Integration: Large-scale plants often have a variety of automation systems from different eras/vendors. Connecting PAT instruments (often third-party) to legacy DCS/SCADA can necessitate custom interfaces. Ensuring synchronized time-stamping and secure, audit-compliant data storage is challenging. Moreover, the volume of PAT data demands scalable IT infrastructure and analytics. Mismanagement can lead to data silos or analysis bottlenecks.
-
Regulatory Validation: While regulators encourage PAT, they also require that any PAT-based release decision be justified. This typically means validating the sensor/method equivalently to a lab assay. For a new drug, intense documentation is needed to show the PAT system is reliable (calibration, accuracy, worst-case performance). There is still some conservatism: many firms use PAT for monitoring and process control, but still do a final offline test for legal release. Widespread real-time release remains an aspirational goal.
-
Cost and Expertise: Deploying new sensors and software has significant upfront cost (equipment, installation, training). Small or older facilities may find it hard to retrofit. Additionally, skilled personnel are needed to build models and interpret results. As one reviewer noted, organizational culture can lag; staff used to “batch mindset” may resist continuous monitoring paradigms ([51]) ([52]). Technical training and change management are therefore essential.
-
Interference and Selectivity: In complex mixtures, sensor selectivity can be limited. Overlapping spectral bands or co-eluting species can confound simple interpretation. This is why chemometric mathematics and multiple redundant sensors are often used. Nevertheless, occasional false alarms or “blind spots” can occur. For example, a transient Raman signal could indicate a harmless side reaction, or a drift in calibration might mimic a concentration shift. Robust multivariate monitoring (like PCA control charts) is needed to detect subtle anomalies ([7]).
-
Cybersecurity: As manufacturing data moves to networks and possibly the cloud, protecting intellectual property and ensuring process integrity is critical. A malicious data or command injection could disrupt production or compromise products. Pharma facilities must implement strong cybersecurity alongside their PAT infrastructure.
Future Directions
The future of chemical reaction monitoring in drug production will further integrate emerging technologies:
-
Advanced Analytics and AI: Beyond PCA/PLS, adaptive machine learning (deep neural nets, reinforcement learning) will be used to continuously learn process behavior and optimize in situ. For example, techniques like “process-informed forecasting” embed physics-based priors into AI models to improve reliability ([9]). Reinforcement learning controllers might one day adjust reaction inputs to maximize yield in real-time. Already, “smart PAT” that routinely scans for quality drift and self-calibrates is under development.
-
IoT and Cloud Connectivity: Higher connectivity means sensor data can be pooled across sites. Cloud-based MES platforms could manage PAT data centrally, allowing remote monitoring. Digital twins – virtual replicas of reactors that run in parallel to the physical process – could ingest real-time data to predict future outcomes and recommend controls. This vision is consistent with forward-looking industry reports asserting that cyber-physical systems are the endgame for a digital pharma factory ([22]) ([50]).
-
Miniaturized and New Sensor Platforms: Advances in microelectromechanical systems (MEMS) and nanotechnology may yield novel sensors. For instance, microfluidic sampling can allow multiple analysis techniques (optical, electrophoresis, biosensors) on a tiny chip in-line. Fiber lasers and enhanced Raman (SERS) could boost sensitivity. Ultrasensitive calorimeters could localize heat release. All these could open new ways to observe reaction pathways with high resolution.
-
Continuous Manufacturing Expansion: As more processes move from batch to continuous (both in small molecules and biologics), PAT will extend to new areas like fully integrated end-to-end manufacturing lines. Here, spectral sensors might be used in every step (reactor, crystallizer, granulator, dryer) to maintain an “in-control” status throughout. Real-time monitoring will also become important in late-stage formulation (e.g. monitoring amorphous solid dispersions by NIR or near-IR imaging).
-
Regulatory Evolution: Regulators are now actively rewarding PAT usage. The implementation of ICH Q13 (continuous manufacturing, Step 4 in Nov 2022; FDA published final guidance in March 2023) explicitly supports PAT-based control strategies and real-time release testing as core enablers for continuous processes. The FDA's Emerging Technology Program (ETP) and EMA's PRIME / Innovation Task Force continue to grant accelerated review pathways to filings that incorporate well-justified PAT-based control. In parallel, FDA's draft guidance on Artificial Intelligence in Drug & Biological Product Manufacturing (issued December 2024) sets expectations for validating AI/ML-based soft sensors and chemometric models in GMP environments — a direct extension of PAT validation principles. Cross-industry data sharing (secure, anonymized) is being explored through consortia such as the BioPhorum and the National Institute for Innovation in Manufacturing Biopharmaceuticals (NIIMBL) to help regulators benchmark quality metrics.
In essence, the gap between lab R&D monitoring and full-scale production monitoring will continue to narrow. Technologies that once seemed “academic” (e.g. on-line NMR) are finding real industrial use. As one review notes, PAT is not just a “nice to have” but the foundation for 21st-century competitiveness ([53]) ([30]).
Conclusion
The integration of sensors and real-time data into pharmaceutical chemistry marks a profound shift in manufacturing. By transforming opaque batch processes into transparent, data-rich operations, PAT and related Industry 4.0 technologies allow unprecedented control over drug quality at scale. Numerous case studies demonstrate tangible gains: higher yields, fewer rejects, and accelerated development timelines. As the evidence cited here shows, data-driven monitoring is no longer a niche capability but a proven cornerstone of modern drug production ([5]) ([6]).
Moving forward, we expect that every large-scale drug chemical reactor will routinely have multiple in-line probes (spectroscopic and physical) feeding continuous analytics. The adoption of machine learning, cloud computing, and AI will only enhance this trend, ultimately realizing visions of autonomous, self-optimizing factories. However, realizing this potential requires continued focus on data integrity, standards, and workforce skills. Collaboration among industry, instrument vendors, and regulators will be key.
In summary, using sensors and real-time data to monitor chemical reactions is reshaping pharmaceutical manufacturing. Historical constraints of offline quality testing are giving way to agile, information-driven processes. The implications are vast: better quality, reduced costs, faster delivery of therapies to patients. As one synthesis chemist might put it, we have moved from “make it and test it” to “monitor it as we make it.” This report has explored the current landscape of this evolution, providing an in-depth view of the technologies, data strategies, and outcomes that characterize the state-of-the-art—and pointing to a future where fully automated, always-on production of medicines is the norm.
References: As in-text linked citations (e.g. ([5])) throughout text. Detailed source information is provided in the context of each reference marker above.
External Sources (53)

Need Expert Guidance on This Topic?
Let's discuss how IntuitionLabs can help you navigate the challenges covered in this article.
I'm Adrien Laurent, Founder & CEO of IntuitionLabs. With 25+ years of experience in enterprise software development, I specialize in creating custom AI solutions for the pharmaceutical and life science industries.
DISCLAIMER
The information contained in this document is provided for educational and informational purposes only. We make no representations or warranties of any kind, express or implied, about the completeness, accuracy, reliability, suitability, or availability of the information contained herein. Any reliance you place on such information is strictly at your own risk. In no event will IntuitionLabs.ai or its representatives be liable for any loss or damage including without limitation, indirect or consequential loss or damage, or any loss or damage whatsoever arising from the use of information presented in this document. This document may contain content generated with the assistance of artificial intelligence technologies. AI-generated content may contain errors, omissions, or inaccuracies. Readers are advised to independently verify any critical information before acting upon it. All product names, logos, brands, trademarks, and registered trademarks mentioned in this document are the property of their respective owners. All company, product, and service names used in this document are for identification purposes only. Use of these names, logos, trademarks, and brands does not imply endorsement by the respective trademark holders. IntuitionLabs.ai is an AI software development company specializing in helping life-science companies implement and leverage artificial intelligence solutions. Founded in 2023 by Adrien Laurent and based in San Jose, California. This document does not constitute professional or legal advice. For specific guidance related to your business needs, please consult with appropriate qualified professionals.
Related Articles
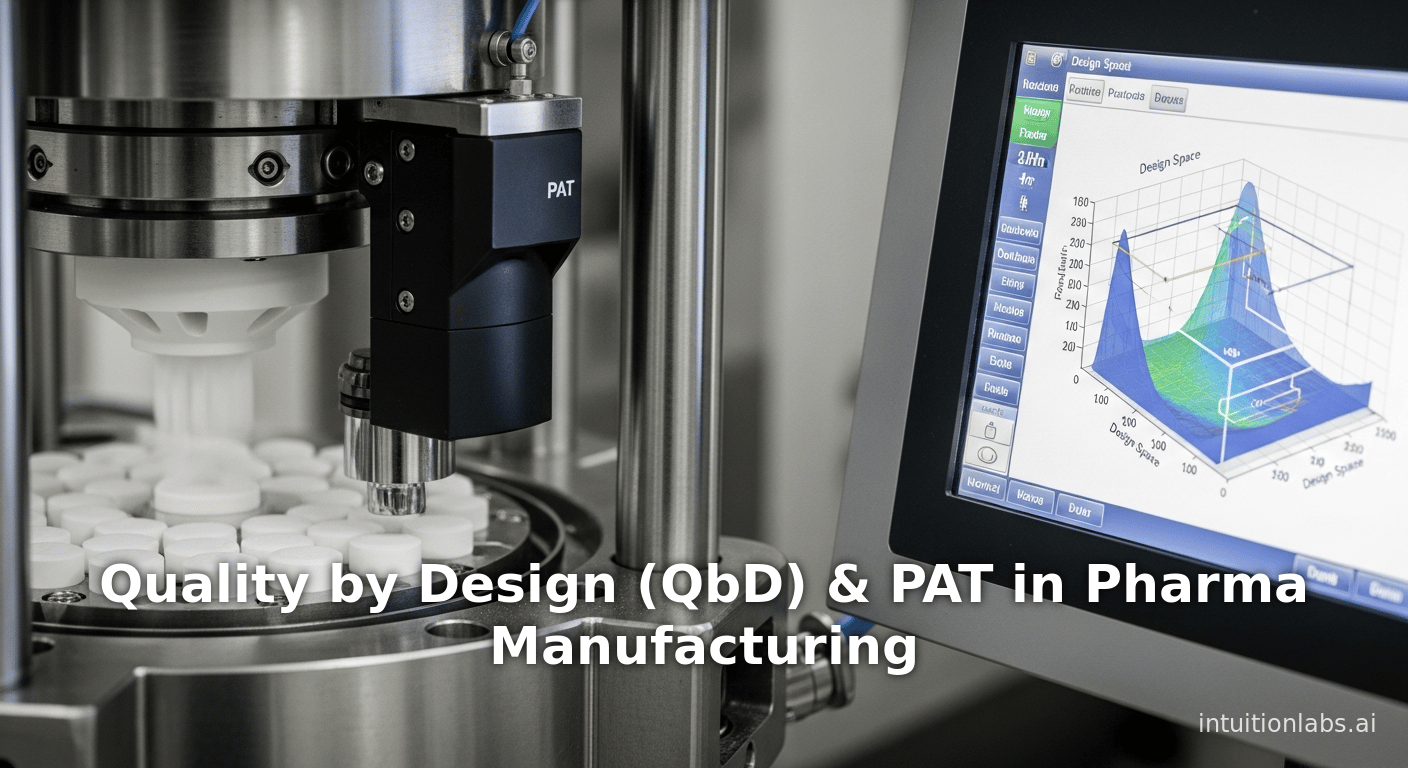
Quality by Design (QbD) & PAT in Pharma Manufacturing
Learn how Quality by Design (QbD) and IT systems are shifting pharma from end-product testing to real-time quality assurance with PAT and data analytics.
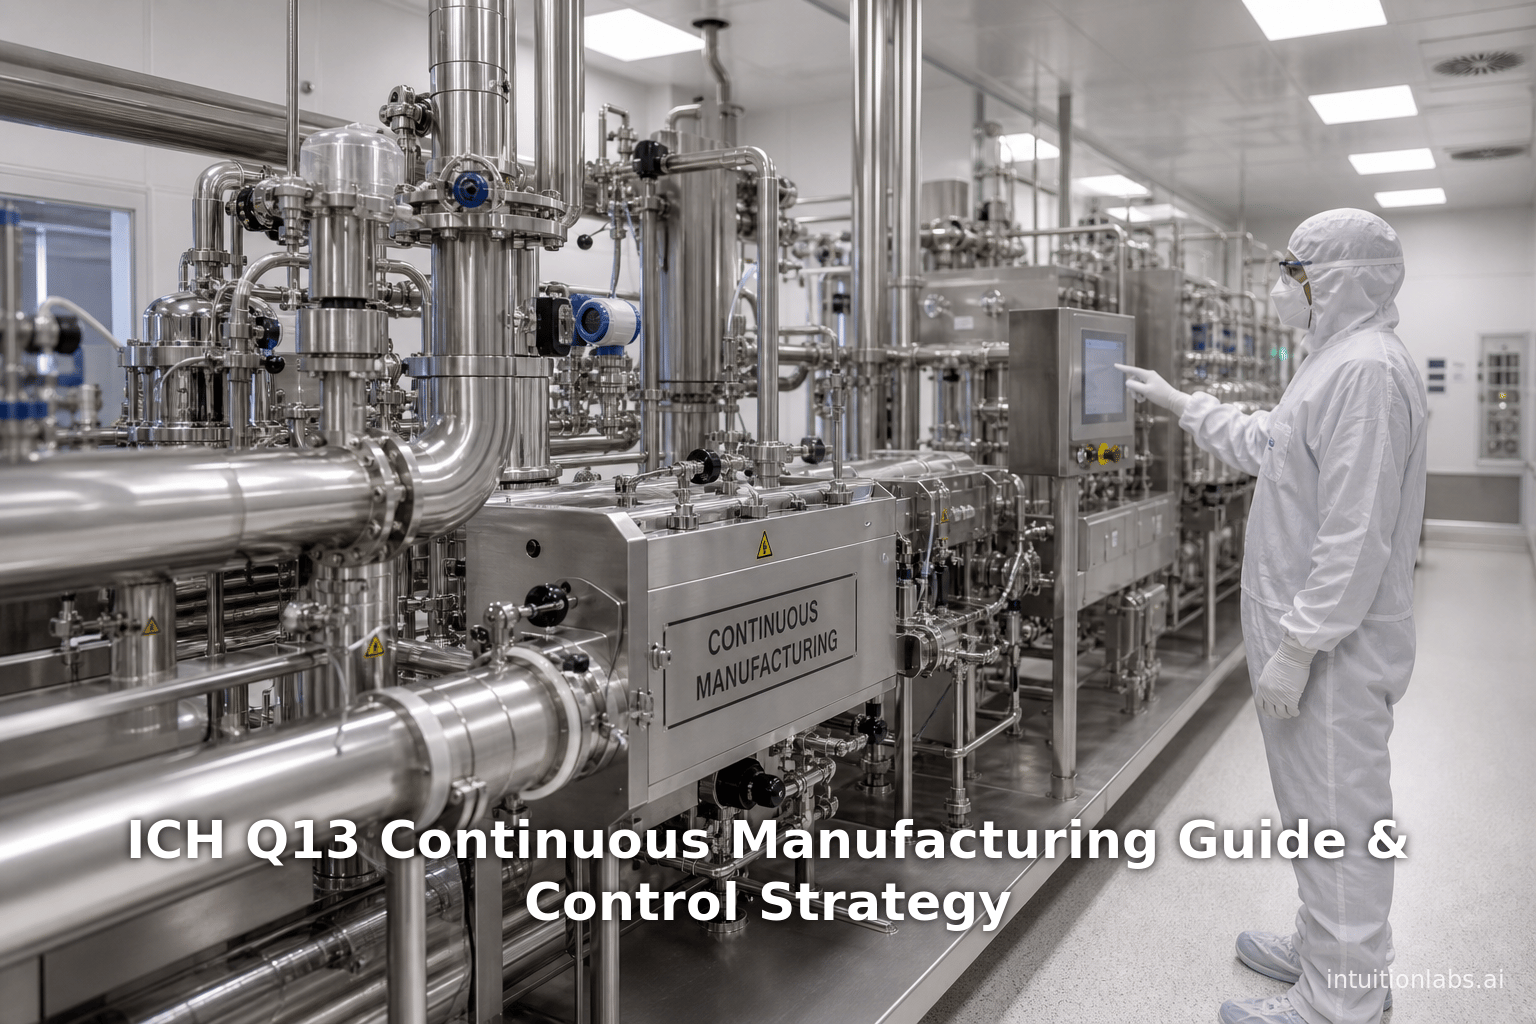
ICH Q13 Continuous Manufacturing Guide & Control Strategy
A review of the ICH Q13 continuous manufacturing guideline for pharmaceuticals, covering regulatory frameworks, control strategies, and industry implementation.
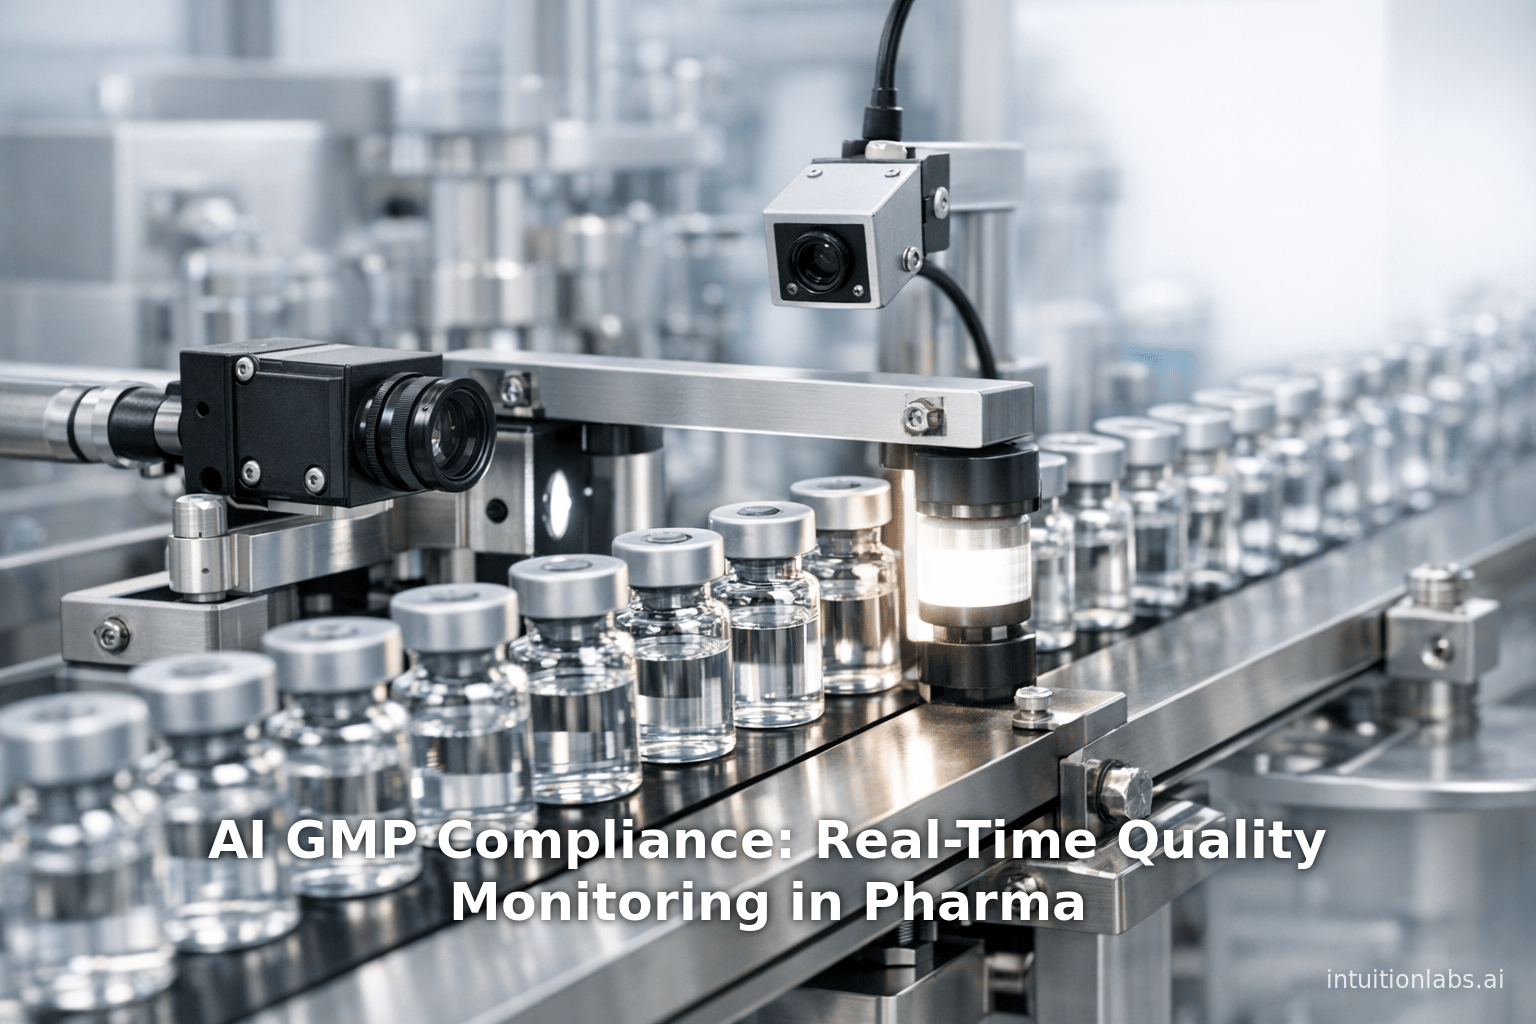
AI GMP Compliance: Real-Time Quality Monitoring in Pharma
Examine how AI and real-time quality monitoring ensure GMP compliance in pharmaceutical manufacturing. Review machine learning frameworks and FDA guidelines.