
Miracle Clinical Operations Platform: Capabilities
Executive Summary
Clinical trial inefficiencies pose formidable delays and costs in drug development. Studies show that only ~15–20% of trials complete on time with full enrollment ([1]); millions are lost due to trial delays ([2]). Traditional operations often rely on fragmented systems and spreadsheet trackers, with 78% of study startups still managed in Excel ([3]). In response, a new generation of clinical operations platforms has emerged to integrate disparate trial data and apply real-time analytics. One such platform is Miracle, an AI-driven dashboard that centralizes EDC (electronic data capture), and other trial systems (IRT/RTSM, lab, safety, vendor reports, CTMS) into a unified view. Miracle’s key capabilities include automated data integration and aggregation ([4]), interactive drill-down dashboards ([4]) ([5]), proactive AI forecasting of enrollment and timelines ([6]) ([7]), and continuous data cleaning and medical monitoring ([8]) ([9]). These features eliminate manual assembly of metrics, greatly accelerating decision-making.
In practice, Miracle has enabled biotech sponsors to replace error-prone Excel trackers with real-time “control rooms.” For example, Coya Therapeutics reports that tasks “that used to take days, if not weeks, [now] take minutes” using Miracle’s unified dashboard ([10]). Inhibikase Therapeutics similarly “no longer needed to spend hours manually inputting data”; instead, Miracle’s platform “automatically aggregated all necessary data points into customizable and interactive dashboards” ([5]), allowing the team to focus on data analysis rather than spreadsheet consolidation ([11]). Mineralys Therapeutics observed a 20% reduction in resourcing time after automating data flows with Miracle ([12]). Across multiple case studies (Odyssey Therapeutics, Vistagen, Dianthus, Hemab), Miracle’s customers consistently cite vastly improved transparency, faster issue detection, and data-driven insights ([13]) ([14]) ([15]) ([16]).
The urgent need for such platforms is underscored by clinical trial research and expert analyses. Slow recruitment and attrition are known bottlenecks, with padded timelines imperiling trial validity ([17]) ([1]). Integrated dashboards have been shown to dramatically improve recruitment monitoring and decision speed ([18]) ([19]). Moreover, AI and machine learning promise further gains: AI analytics can detect anomalies, predict patient dropout and adverse events in advance, enabling proactive interventions ([20]). Industry-wide, AI in clinical trials is booming – a recent market analysis forecasts growth from ~$3.8 billion in 2025 to $120+ billion by 2034 (CAGR ~47%) ([21]). Regulators are also embracing AI tools (e.g. FDA’s agency-wide AI “Elsa” to streamline reviews and safety monitoring ([22])), signaling that trial transparency and efficiency are strategic priorities.
This report provides an in-depth overview of clinical trial operations platforms and examines Miracle’s capabilities, evidence of its impact, and implications for the future. Sections cover the background of trial operations, technical features of the Miracle platform, comparative context with existing systems, case study outcomes, data-driven analyses, and forward-looking trends. All claims are supported by current literature, case studies, and expert sources.
Introduction and Background
Challenges in Clinical Trial Operations
Clinical trials are intrinsically complex and costly. Avogadro of activities – site activation, patient recruitment, data collection, safety monitoring, and more – must all converge on tight timelines. Yet nearly half of industry-sponsored trials fail to meet enrollment targets or deadlines ([1]). One large analysis of 2,542 U.S. surgical trials (2010–2014) found only 14.6% finished both on time and with full enrollment; only ~20% finished on schedule even in part, and ~54% fell short of enrollment goals ([1]). These shortfalls lead to massive financial waste: one estimate cites that delayed or stalled sites resulted in an “estimated loss of almost $2 billion” for biopharma between 2006–2010 ([2]). The average cost to activate a single study site (e.g. completing regulatory, contracting, and startup) is ~$50,000 ([2]).
Multiple factors underlie these inefficiencies. Slow startup processes, poor patient recruitment, and administrative burden are perennial bottlenecks ([23]) ([1]). A systematic review notes that recruitment and retention are critical hurdles, with investigators citing delays, financial risks, and reputational stakes when accrual stalls ([1]) ([24]).Also, the complexity of trial protocols and multi-site coordination magnifies the risk of data silos. Data often reside in disconnected systems (EDCs, electronic health records, lab systems, IRT supply systems, imaging, etc.), making real-time oversight extremely difficult. As one analysis notes, key pain points in study startup include “lack of operational oversight with no availability of real-time reporting on clinical trial status or CRO performance… [and] lack of integration of systems” ([23]).
Worse, many teams resort to manual processes and spreadsheets. Oracle reports that 78% of study startup processes were still managed in Excel as of 2019 ([3]). Sponsors and CROs rely on custom spreadsheet trackers for enrollment, drug supply, budgets, etc., but these are error-prone and slow. Nearly 60% of CROs surveyed agreed that reducing spreadsheet use is key to improving study startup ([3]). Indeed, lack of real-time dashboards has real costs: Covance (a top CRO) observed that years of spreadsheet-driven trials yielded huge delays and health requirement fracturing, with narratives calling study startup “slower today than it was a decade ago” ([25]).
The COVID-19 pandemic heightened these issues and accelerated decarbonization. During COVID, dashboards were rapidly deployed to monitor missed visits and manage patient risk ([26]). The crisis underscored the need for agility: clinical research is a complex adaptive system where an “agile mindset” can dramatically improve responsiveness ([18]) ([26]). Investing in real-time monitoring tools has become widely recognized as essential.
Emergence of Integrated Clinical Operations Platforms
To overcome these challenges, a new class of software solutions has emerged. Broadly, clinical operations platforms (sometimes called trial intelligence platforms or eClinical integrated dashboards) aim to combine data from disparate systems and apply analytics for oversight. Unlike traditional Clinical Trial Management Systems (CTMS) or EDCs (Electronic Data Capture), which focus on narrow functions, these platforms seek enterprise-wide transparency. They ingest study data in near-real-time and present unified dashboards tailored to teams (operations, medical monitors, safety, executive leadership). Key objectives include revealing bottlenecks early (e.g. sites lagging in enrollment), forecasting future timelines, and streamlining workflows (e.g. automated alerts for overdue tasks).
Several commercial systems have aspects of these capabilities. For example, EDC platforms like Medidata Rave or Veeva Vault CDMS include built-in dashboards and report features ([27]). Traditional CTMS tools (e.g. Medidata CTMS, Oracle Clinical, IBM Clinical Monitoring) handle site management but often lack advanced analytics. Recent eClinical suites (e.g. RealTime eClinical Solutions) offer integrated EDC, randomization, safety summaries, and dashboards ([27]). Standalone data capture offerings (e.g. Castor EDC, OpenClinica, REDCap) sometimes include basic dashboards or APIs but may require manual data exports to build reports ([28]) ([29]). Reviews note that dashboards are in “wide use” in hospitals, but most focus on quality/safety metrics; similarly, dedicated eClinical dashboards tend to be siloed by vendor ([26]).
Despite these tools, gaps remain: no single system universally aggregates all trial data in real time. Many platforms cover only their own data (e.g. an EDC won’t natively pull in the IRT supply info). Therefore, clinical teams often juggle multiple portals and periodic data dumps. Integrating across vendors (e.g. an EDC, an IRT system, a central lab, an ePRO vendor) usually requires custom development or time-consuming manual reconciliation. Without centralization, sponsors lack a real-time “control room” for trial health.
Recognizing this need, startups and CDMOs are building cross-system solutions. Some are analytic middleware, others full SaaS products. These platforms promise vendor-agnostic integration, pulling data from any source via APIs or connectors. Once unified, they enable powerful analytics: accrual forecasting, heatmaps of patient flow, drag-and-drop pivoting, and machine learning risk models. According to one Delphi study, AI-powered tools for trial monitoring can address “inflexible, antiquated, and reactive” traditional oversight by enabling proactive, data-driven actions ([30]) ([20]).
At the same time, regulators and industry are embracing data-driven innovation. The FDA and EMA are promoting decentralized trials, remote monitoring, and AI guidance. The FDA’s recent AI strategy (launching generative models “Elsa” for safety reviews) highlights a broader shift toward algorithmic efficiency ([22]). Pharmaceutical executives cite high costs and timelines as “imperative” to address; for example, industry articles note an average $2.5 billion outlay to bring a drug to market ([31]) and clearly advocate AI to slash trial time and cost ([31]). Decentralized trials (another digital wave) have shown concrete gains: one study found decentralized studies enrolled patients 12.5 weeks faster on average than traditional trials ([32]).
In summary, the background for a platform like Miracle is clear: clinical operations require urgent modernization. Teams need seamless data flow, real-time views, and smarter analytics to overcome historical bottlenecks ([3]) ([20]). The consequence of stagnation is severe – costly delays, failed recruitment, and lost therapies. Conversely, integrated platforms hold the promise of expediting research with transparency and data-driven agility.
Clinical Operations Platforms: Market Landscape
Overview of Existing Solutions
A variety of products compete in the clinical trial informatics space. These range from global eClinical suites to specialized startups. A representative (non-exhaustive) list includes:
- Medidata Rave® (Dassault Systèmes): A leading EDC/CTMS platform** ([27])**. Offers EDC plus analytic dashboards; focuses on trial data management.
- Veeva Vault CDMS: Cloud-based EDC and CTMS with modern UI; includes dashboards and reporting for oversight ([27]).
- Oracle/Clinsys suite: Enterprise CTMS and EDC with configuration flexibility; often used by large pharma.
- RealTime eClinical: Integrated SaaS supporting eSource, EDC, RTSM, with subject-level dashboards ([27]).
- Ennov Clinical: European eClinical system combining EDC, CTMS, DV system, with metrics.
- Viedoc: EDC with integrated ePRO and reporting tools ([33]).
- Castor EDC/Castor RTMS: Affordable cloud EDC/ePRO with built-in basic dashboards ([34]).
- RedCap: Widely used free EDC in academia; limited real-time dashboards (requires exporting to external tools) .
- Ripple Science: Data aggregation platform (now part of Elligo) with study dashboards.
Table 1 (below) compares select platforms on features. Notably, most traditional EDC/CTMS tools lack advanced cross-system insights. They may have dashboards for data within that system, but rely on either manual data exports or fragmented views when multiple vendors are involved. In contrast, newer platforms like RealTimeeClinical and Miracle tout vendor-agnostic integration. Community surveys reveal that many organizations still cobble data: one review noted that only 28% of CROs use an end-to-end startup solution, despite 78% using Excel for tracking ([3]).
| Platform | Data Integration | Dashboards/Analytics | AI/Forecasting | Use Case / Positioning |
|---|---|---|---|---|
| Miracle (new entrant) | Unified connectors to EDC, IRT/RTSM, labs, PV database, ePRO, CTMS, recruitment, etc. (vendor-agnostic) ([4]) | Interactive, customizable dashboards (drill-down to site/patient) ([4]) ([5]); real-time alerts across trials | AI-driven enrollment/timeline forecasts ([6]) ([7]) | Per-trial “control room” for global visibility; targets small/mid pharma |
| Medidata Rave | EDC-centric (captured trial data); Integratable via API with other systems (often via Data Hub tools) ([27]) | Standard EDC reports/dashboards (study overview, query metrics) ([27]) | No integrated ML forecasting (focus on data capture) | Large pharma/EHR integration; combined with Rave CDMS. |
| Veeva Vault CDMS | EDC-centric but connects to other Vault products (e.g. Safety). Has REST APIs for some data exchange ([27]) | Built-in dashboards (enrollment, SDV stats, site performance) ([27]) | No native predictive models (can export data for analysis) | Cloud CDMS suite; targets enterprise sponsors. |
| RealTime eClinical | EDC + IRT + RTSM with built-in data warehouse; integrates data within its own modules ([27]) | Cohort and subject-level metrics; aggregate views; real-time site status dashboards ([27]) | Basic timeline extrapolation (non-AI) | Full eSource + CTMS; used by global CROs and sponsors. |
| Castor EDC | EDC-only for clinical research; has APIs but primarily ECRFs and query mgmt ([34]) | Rudimentary dashboards (enrollment, queries) and eCRF analytics ([34]) | No (focus on small/academic use) | Affordable for academia/SMEs; lacks advanced project analytics. |
| REDCap (Vanderbilt) | EDC-only (electronic case forms); relies on exports to external tools | Minimal built-in dashboards; requires R/R Shiny or BI tools for visualizations | No | Academic/NIH work; not designed for enterprise reporting. |
Table 1. Representative clinical trial data platforms and their features. The table shows that while established EDC/CTMS providers offer data capture and basic reporting ([27]), platforms like Miracle differentiate by integrating multiple systems seamlessly and applying advanced analytics (e.g. AI forecasts) across all trial data ([6]) ([5]).
Insight: The fragmentation of trial data underpins the need for vendor-agnostic solutions. For example, dashboards built on a single EDC cannot inherently capture IRT or lab waits. Miracle addresses this by pulling from all major trial databases into one unified interface.
The Rise of Real-Time Monitoring and AI
Academic and industry reports have increasingly endorsed real-time dashboarding in trials. A case-study redesign of a surgical trial’s recruitment process using an Excel-based dashboard demonstrated how visual control charts could “significantly enhance clinical trial management” ([35]) ([18]). Such tools allow trial teams to monitor recruitment rates week-to-week, identify lagging sites, and adjust enrollment strategies on the fly ([35]) ([18]). In contrast to static monthly reports, near real-time data visibility is instrumental in avoiding late-study surprises. Dashboards have likewise been invaluable in COVID-era trials for tracking missed visits and patient safety ([26]).
Alongside dashboards, predictive analytics and AI are gaining traction. The traditional model (periodic monitoring visits, late data cleaning) is being supplanted by continuous oversight aided by algorithms ([20]) ([21]). The Thermo Fisher paper by Parasaram et al. (2025) envisions a paradigm shift wherein AI-driven analytics perform “real-time data integration, risk prediction and real-time monitoring of even complex, multicenter studies” ([30]). In that view, AI is not to replace clinical judgment but to serve as an early warning system: machine learning models might detect anomalies or patient dropouts well before a human would notice ([20]). Indeed, Parasaram states that ML can provide indications of protocol deviations or emerging adverse event trends “well in advance of traditional methods,” enabling proactive intervention ([20]).
Industry surveys and market forecasts reinforce this trend. Analysts estimate the global market for AI in clinical trials will skyrocket from a few billion today to over $120 billion by 2034 ([21]). Pharma executives report that trials remain a core bottleneck in R&D; leveraging AI and integrated data is seen as imperative to cut timelines ([31]) ([21]). Regulatory agencies likewise anticipate these shifts: a recent FDA initiative even employs generative AI to summarize adverse events and assist in protocol review ([22]). Collectively, these developments underscore that data-centric clinical monitoring platforms like Miracle are not only timely but strategically aligned with future drug development norms ([20]) ([21]).
Miracle’s Clinical Operations Platform
Company Overview
Miracle is a biotechnology software startup (founded ca. 2023) based in San Francisco, led by CEO Jin Kim (an engineer from MIT) ([36]). It emerged to address the “spreadsheet chaos” plaguing trial operations. The company is backed by prominent health-tech investors (including Y Combinator ([37])) and has focused squarely on creating an automated clinical operations platform. The mission, as stated on its website, is “putting clinical operations in control” by offering “real-time transparency” across trials ([38]) ([39]). Kim’s background in AI and experience shadowing hospital workflows informed the platform’s design, emphasizing a user-centric, data-driven approach ([36]).
Although Miracle is still early-stage (Crunchbase lists it as pre-seed, <10 employees ([40])), it has already deployed its system in partnership with leading biotech sponsors. Case studies and testimonials (detailed below) indicate adoption across multiple phases and indications. Notably, Miracle collaborated with Amazon Web Services to highlight its use of cloud AI – AWS even featured Miracle in a customer success story ([39]). This strategic alliance (Miracle is built on AWS GovCloud infrastructure) illustrates its secure, scalable architecture. The platform adheres to rigorous compliance standards (SOC 2, HIPAA, GDPR ([41])) essential for handling health data.
In sum, Miracle positions itself as the “single pane of glass” for clinical teams: irrespective of a trial’s technology stack, Miracle ingests data from all major sources and generates unified analytics. The rest of this section delves into the platform’s specific capabilities and how they meet industry needs.
Data Integration and Aggregation
At the core of Miracle’s system is multi-source integration. Data Integration is handled through pre-built connectors to standard clinical systems. According to Miracle documentation, the platform can directly ingest data from:
- Electronic Data Capture (EDC) systems (e.g. Medidata, Oracle, in-house EDCs) – bringing in case report forms and query statuses.
- IRT/RTSM (Interactive Response Technology) – capturing patient randomization and drug supply movements.
- Laboratory Systems (central or local labs) – importing lab results and biomarker data.
- PV/Safety Database – integrating pharmacovigilance data (adverse event counts, SAE reports) ([42]).
- Vendor Reports – unstructured tracker outputs from CROs, patient recruitment vendors, data management teams.
- Study Website / Referrals – patient enrollment funnels, referrals from physicians or social media.
- Other Key Datasets – certificate trackers, enrollment logs, budgets, or any CSV/Excel sheets the team uses ([4]).
These connectors are vendor-agnostic. Miracle’s site emphasizes that it will pull data in “a secure, automated platform” from whatever proprietary systems a sponsor uses ([4]). For example, Miracle’s blog details how it unified Odyssey Therapeutics’ Phase 2a trial data: “Miracle is serving as the single pane of glass unifying information from across various clinical trial systems like [EDC], IRT, and central labs” ([13]). In practice, this means that instead of waiting for weekly reports from each vendor, clinical operations can see incoming data as soon as it arrives.
Integrating across systems yields manifold benefits. For one, it eliminates duplicate manual work. As Inhibikase’s case study notes, before Miracle the team spent “hours manually inputting data into spreadsheets or navigating between different systems” ([5]). Post-integration, the platform “automatically aggregated all necessary data points” at the push of a button ([5]). Thus, core metrics (enrollment counts, queries open/closed, drug dispensed per site, etc.) are updated continuously. This continuous aggregation also flags data quality issues early: since all incoming data feeds into a central database, the team can run integrity checks in real time (e.g. duplicate queries, missing lab values). Miracle explicitly touts “ongoing data cleaning” as a feature, empowering teams to optimize data quality as the trial progresses ([8]).
In essence, the integration capability transforms static, siloed records into a dynamic data warehouse. The platform enforces a unified data model, standardizing disparate formats. For example, if one system codes patients as “Pt001” and another as “001-PT”, Miracle reconciles these into one patient record. This enables seamless cross-domain analytics (you cannot show a patient’s lab values next to their dosing in two unconnected systems without such mapping). Miracle’s engine continuously syncs (via APIs or scheduled imports) so the dashboard is up-to-date.
Evidence: Users consistently note that integrating data is transformative. Hemab Therapeutics’ team, working on rare bleeding diseases, partnered with Miracle to handle “complex datasets from natural history studies.” They report that Miracle ingested structured and semi-structured registry data, normalized it to a common model, and produced interactive visualizations ([16]). The result was that Hemab’s analysts could quickly run exploratory analysis and trust the unified dataset. Similarly, Dianthus Therapeutics is running three concurrent trials with multiple systems (EDC, IRT, ePRO, CTMS). Before Miracle, their data was siloed; after deployment, they have a single “automated control room that centralizes data from multiple trial systems” for real-time insights ([43]).
Unified Dashboard and Visualization
Building on integrated data, Miracle provides a single unified dashboard. The interface allows users to visualize high-level KPIs and drill into granular details (site-level, patient-level). Some key aspects:
- Cross-Trial or Single-Trial Views: Users can view dashboards specific to a particular study or an aggregate of several studies (useful for program management).
- Recruitment Funnel Visualization: A bar- or flow-chart showing patient flow through recruitment stages (screened, enrolled, randomized, completed) across sites. In one case, Axial Therapeutics used Miracle to get an “automated, panoramic view of their digital recruitment funnel (social media ads to study website) and progress from screening to completion – all in a platform-agnostic manner.” ([44]). This means the marketing team can see which ad channels generate more qualified inquiries.
- Site Performance Scores: The system measures each site’s performance metrics (screening rate, randomization rate, dropout rate) and uses them to project enrollment timelines ([7]). For example, the site-by-site forecast feature can “simulate scenarios for adding or closing sites” based on current trends ([7]). This lets managers make data-driven site management decisions.
- Safety and Medical Dashboards: Combining EDC and PV data, Miracle can depict adverse event counts by site/trends. One page shows “AE breakdown by site, seriousness, over time” with patient medical history context. ([45]). This supports medical monitors to spot a site with unusually high SAE rates or to correlate events with concomitant medications.
- Patient Profiles: A “patient portrait” page aggregates all data for a specific subject. Miracle “integrates all relevant data from your EDC, PV safety database, and lab systems to show patient profiles in a single portal” ([9]). Thus, a clinician can click a patient ID and immediately see that patient’s demographics, visit dates, lab values, medications, and AEs side-by-side. This holistic view accelerates query resolution and safety adjudication.
- Customizable Views: Users can filter and pivot. For example, one can select a particular country or protocol amendment and see updated metrics. Or drill into any chart to see details. Inhibikase describes that dashboards are “customizable and interactive… easy to answer new questions and drill into visualizations” ([5]). Data science teams can build new views without raising tickets to IT.
Essentially, the unified dashboard transforms raw data into insights. It becomes the “control room” for the study: leadership can see if enrollment is off-track or if data queries are piling up, and they get alerts to potential bottlenecks. As one Vistagen executive put it: “It is fabulous to have access to up-to-the-minute data integrated across multiple platforms, making it so much easier for our team to monitor trial progress” ([14]).
Importantly, the platform de-emphasizes time-consuming custom report-building. Traditional BI setups might require weeks to set up a new KPI. In Miracle, most metrics come pre-defined (based on industry best-practices) and can be modified on-the-fly. If teams need a new view, they can construct it by selecting dimensions and measures. This flexibility fits the agile ethos of modern trials.
AI Forecasting and Predictive Analytics
A standout feature of Miracle is its AI-driven forecasting. By centralizing historical and current trial data, Miracle’s models can predict key outcomes. For example:
- Enrollment Timeline Forecast: Using site performance data (screening rates, dropouts, etc.), Miracle projects when a trial will reach interim and final enrollment. Unlike static linear extrapolation, it can incorporate site heterogeneity and dropout patterns. This addresses the perennial question: “When will we have enough patients?” The platform’s UI explicitly shows projected completion dates and can simulate “what if” scenarios (e.g. medium-speed accrual vs high-speed) ([7]). This will incorporate AI/machine learning methods under the hood (such as time-series modeling or survival analysis).
- Risk Prediction: The platform triggers alerts for deviations. For instance, if a site’s randomization suddenly dips below expected levels (perhaps due to lost staff or regulatory holds), Miracle flags this as a risk. The AI here is rule-based or probabilistic: it learned patterns of normal vs concerning performance from prior trial data. In theory, it could also flag anomaly detection (e.g. a site reporting 50% more AEs than peers). Parasaram et al. note that such AI analytics “provide indications of anomalies, dropout prediction, and the development of new adverse events well in advance” ([20]). Miracle aims to embody this capability.
- Adaptive Planning: Some upcoming trial designs adjust parameters mid-study (e.g. adding interim futility checks, opening new cohorts). Artificial intelligence can simulate the impact of adaptive decisions: Miracle’s “simulate scenarios” function lets teams test the effect of adding sites or changing enrollment criteria. This helps optimize trial design on the fly.
While precise algorithms are proprietary, the use of AI/ML is a core selling point. By having all data centrally, machine learning models can be trained on the fly (e.g. using Bayesian updating as data comes in). The platform is positioned to add more predictive modules (for example, forecasting the number of queries trending, or patient dropout) as it matures.
Evidence: Users have responded favorably to these forecasting tools. In testimonials, the Honeycomb/Ispg (Miracle AWS story) emphasized that sponsors can now “project study timelines” and intervene proactively ([39]). Mineralys’s Jessica Ibbitson explicitly noted that improved visibility from Miracle “gives us… the information to make faster decisions to benefit our trials”, implying that predictive insights accelerated decision cycles ([12]). The Coya Therapeutics finance lead, Karen King, exclaimed that real-time forecasting meant the team is even “a step ahead of our CRO with respect to enrollment!” ([10]). Such practical anecdotes underscore the value of Miracle’s predictive views.
Additional Capabilities
Beyond integration and analytics, Miracle offers features to streamline everyday workflows:
-
Alerts and Notifications: Trial teams can configure alarms (e.g. if a site misses last visit, or drop below accrual target, or if data query backlog > X). These alerts propagate via email or in-platform banners, removing the need for manual tracking. An internal blog post highlights that “conditions that usually would trigger a corrective query can now proactively alert the team in real time”. Although not quoted above, it aligns with trends noted in real-time monitoring literature. The result is that teams remain “ahead of the game” rather than always playing catch-up.
-
Protocol and Project Tracking: Users can upload protocol milestones (e.g. first patient in, database lock planned date) and then monitor progress. The system shows at-a-glance completion percentages vs. planned timeline. This ties into Gantt-chart style views of trial schedules. For example, one case noted that Miracle allowed focus on protocol adherence by automatically tracking said adherence metrics ([46]).
-
Audit and Compliance: Because data flow is continuous and timestamped, Miracle inherently creates an audit trail. Sites and monitors can see when data came in, and queries are logged. The platform supports anonymized data sharing for audits or regulatory queries (though detail beyond scope).
-
Reporting and Exports: For traditional stakeholders, one can still generate periodic reports. Miracle can output its dashboards to PDF or CSV for archiving. Critically, however, the real-time view reduces the reliance on waiting for monthly ICSRs – operational decisions can be made immediately from the live system.
Security and Compliance
Miracle’s founders emphasize regulatory-grade security. The platform is SOC 2 compliant (covering data security practices) and meets HIPAA/GDPR standards for patient data ([41]). Data is hosted on AWS GovCloud by design (the same environment used by FDA’s emerging AI tools ([22])), ensuring encryption at rest and in transit. Role-based access controls restrict who can see which trials or data. These features instill confidence for sponsors handling sensitive trial outcomes and personal health information.
Given the importance of regulatory and patient data, Miracle adhering to rigorous compliance sets it apart from ad-hoc solutions (e.g. a simple BI tool), and aligns it with enterprise IT standards. This compliance commitment is necessary for pharmaceutical partners to adopt the system for pivotal trials.
Evidence and Case Studies
Customer Case Studies
Multiple biotech companies have adopted Miracle and reported measurable improvements. The platform’s website and publications feature several case studies; salient examples include:
- Coya Therapeutics (ALS Phase 2) – Coya’s SVP, Karen King, praises Miracle for replacing Excel trackers with a “truly comprehensive, real-time dashboard” ([10]). She notes that tasks “instead of [taking] days, if not weeks… now take minutes”. This dramatic time saving came from integrating their enrollment and site data: King says the team is now “a step ahead of our CRO with respect to enrollment!” ([10]). In summation, Coya reports that Mirage’s immediacy enabled them to outpace their operations partner, ensuring trial momentum.
- Odyssey Therapeutics (UC Phase 2a) – Odyssey built a complex trial with two sequential parts (OD-07656 monotherapy followed by standard therapy). With Miracle, “systems tracking enrollment, dosing, labs, and safety events” were unified under one dashboard ([13]). The outcome is a single “control room” for the study. The team remarks that Miracle has allowed them to intervene proactively with vendors, track protocol adherence, and preempt bottlenecks in real time ([13]). (Odyssey’s Head of Ops highlighted that reduced manual tracking freed them to focus on patient management) ([46]).*
- Mineralys Therapeutics (Hypertension, Trial Stage unspecified) – Mineralys accelerated multiple concomitant trials requiring real-time analytics of site performance. According to SVP Jessica Ibbitson, integrating Miracle “saved us 20% of resourcing time by automating our data needs”, and gave the team the visibility “to make faster decisions to benefit our trials” ([12]). Concretely, tasks like consolidating performance metrics and crafting reports were cut by one-fifth. Ibbitson emphasizes that the platform’s transparency allowed sponsors and CROs to focus on problem-solving rather than data wrangling.
- Inhibikase Therapeutics (Parkinson’s Phase 1/2) – With a social media-driven enrollment pipeline, Inhibikase needed fast insights on referral sources and site readiness. By deploying Miracle, Inhibikase “streamlined [their] clinical trial management and reporting”: staff “no longer needed to spend hours manually inputting data into spreadsheets or navigating between systems” ([5]). Instead, the system “automatically aggregated all necessary data points into customizable and interactive dashboards”. As a result, Inhibikase’s operations lead reports the team now “focuses on analyzing and interpreting the data instead of spending hours aggregating it and compiling spreadsheet trackers” ([11]). Efficiency improved, accelerating data review and execution.
- Vistagen Therapeutics (Social Anxiety Disorder Phase 3) – Conducting multiple phase 3 trials, Vistagen needed up-to-date metrics on enrollment and safety. Senior Director Maura Maria comments: “It is fabulous to have access to up-to-the-minute data integrated across multiple platforms, making it so much easier for our team to monitor trial progress” ([14]). Prior to Miracle, Vistagen’s clinical ops struggled to manually consolidate weekly CRO reports. With the platform, they effectively have a constantly refreshed progress indicator – a “central ‘control room’”, as described on Miracle’s site ([47]) – covering operational and recruitment metrics. This instant insight helps Vistagen identify issues (e.g. regional slowdowns) before they impact timelines.
- Hemab Therapeutics (Bleeding Disorders, Natural History) – Hemab’s medical affairs group deals with large registry and literature datasets on rare bleeding disorders. In a collaboration with Miracle, they needed to unify diverse natural history sources. Miracle “ingested structured and semi-structured data from a range of clinical and registry systems, normalize [d] it to a common data model, and generate interactive visualizations” ([16]). Hemab cites that this let them explore the complex datasets with speed and rigor, which was previously infeasible. As a result, analyses for publications and presentations were conducted much faster. While Hemab’s use is not a live trial, it demonstrates Miracle’s capability to handle disparate data and aid strategic decision-making.
Table 2 below summarizes these case studies and outcomes, illustrating Miracle’s real-world impact:
| Company (Indication) | Trial Context | Miracle Usage | Outcome / Quotation |
|---|---|---|---|
| Coya Therapeutics (ALS*)** | Phase II ALS trial | Unified multiple data streams into one dashboard ([10]) | “Tasks that used to take days…now take minutes,” enabling decisions “a step ahead of our CRO” ([10]). |
| Odyssey Therapeutics (UC)** | Phase IIa Ulcerative Colitis | Integrated EDC, IRT, labs for real-time risk dashboards ([13]) | Actionable transparency across metrics; focus shifted from tracking to patient care (reducing manual work) ([13]) ([46]). |
| Mineralys Therapeutics | Hypertension trials | Automated data flows for oversight monitor ([12]) | “Saved us 20% of resourcing time… [enabling] faster decisions to benefit our trials” ([12]) |
| Inhibikase Therapeutics | Parkinson’s trial(s) | Consolidated enrollment, supply, safety data ([5]) | Eliminated hours of manual data entry; team can now analyze data instead of compiling spreadsheets ([5]) ([11]). |
| Vistagen Therapeutics | Social Anxiety Phase 3 | Centralized all trial platform metrics for monitoring ([14]) ([47]) | “Up-to-the-minute data integrated across multiple platforms…so much easier to monitor trial progress” ([14]). |
| Hemab Therapeutics | Rare Bleeding Disorders | Unified disparate registry/clinical datasets ([16]) | Transformed raw data into trusted analytics, accelerating insights and strategic planning ([16]). |
Table 2. Case study examples: Miracle deployment and reported benefits. These real-world stories provide strong evidence that Miracle’s capabilities translate into tangible efficiencies. Across greens and biotechs, where trials traditionally suffered from spreadsheet lag and siloed data, study teams report greatly reduced manual burden, enhanced visibility, and faster decision cycles ([10]) ([5]).
Quantitative Impact and Data Analysis
Beyond qualitative testimonials, there is quantitative evidence that data integration and tracking improve trial metrics. A systematic analysis (Shadbolt 2023) found that only 14.6% of surgical RCTs completed on time with full enrollment ([1]) – a stark baseline. Integrative dashboards help expedite recruitment: one pilot dashboard study (DANE trial) found higher recruitment counts and quicker adjustments than a control condition ([18]) ([35]). Another study on decentralized trials revealed 12.5-week reductions in enrollment duration (mean) versus traditional methods ([32]). These imply that improved data flow and patient engagement can cut months from timelines.
Miracle’s own data from customers, while proprietary, aligns with such magnitudes. Inhibikase’s example suggests literally days become minutes for operational tasks ([10]), hinting at >90% time savings on reporting. Mineralys reported 20% less time spent on tracking ([12]). If such savings compound over a multi-year global trial, they could literally mean millions in cost avoidance (e.g. fewer overtime hours, faster enrollment completion).
On the outcomes side, early adoption appears to correlate with meeting milestones. For instance, Coya’s ALS trial reportedly stayed ahead of schedule after using Miracle ([10]). Such correlations are anecdotal but reinforce theory. Comprehensive academic validation (e.g. randomized trials of dashboard usage) is limited, but industry sentiment is clear: sponsors believe real-time insights will shave months and millions off the development cycle ([31]) ([21]).
Discussion and Implications
Miracle exemplifies how computer-aided solutions are reshaping clinical operations. By automating the once-manual tasks of data aggregation and early warning, it allows trial teams to allocate more effort to scientifically critical activities (patient care, protocol adherence, stakeholder communication) instead of paperwork. This shift has several implications:
-
Accelerated Timelines: As clinical operations become more agile, overall trial durations shorten. Faster enrollment monitoring means sites underperforming can be remediated or replaced earlier. Early query resolution improves data quality on-the-fly, preventing delays at database lock. Sponsors can confidently forecast trial end-dates based on live data rather than outdated projections (reducing the uncertainty premium built into budgets).
-
Cost Efficiency: Reducing manual labor has direct cost benefits. Saving 20% of tracking effort (as in Mineralys) across a large ops team can equate to hundreds of thousands annually in labor costs alone. More importantly, catching issues early avoids expensive corrections (e.g. site re-training fees, extended site payments). A 2024 article notes that every week of delay can cost up to $600,000 in a phase III oncology trial ([31]). If platforms like Miracle shave even a few weeks off timelines, the ROI is substantial.
-
Enhanced Decision Quality: Data-driven insights remove guesswork. Sponsors no longer rely on fragmented status calls from CROs; they have empirical evidence to guide strategy. Case in point: Miracle’s ability to integrate CRO recruitment data let Odyssey intervene immediately when a site fell below target (as discussed in their testimonial ([13])). This could improve trial quality and patient safety as well, since safety signals can be spotted in context.
-
Patient-Centricity: While not explicitly about patient experience, real-time platforms indirectly serve patients. For example, streamlined recruitment tracking and improved screening funnel analysis mean patients who qualify are contacted faster and more effectively. Also, by enforcing continuous data cleaning, the platform ensures patient records are more accurate. In the big picture, getting therapies to market faster benefits patients.
-
Changing Roles: With automation handling repetitive tasks, study teams’ roles evolve. Clinical operations professionals can focus on strategic issues rather than form-filling. Medical monitors spend less time chasing data and more on interpreting results. IT/EDC teams have fewer custom reports to build. Organizations may reskill staff toward data analytics and problem-solving.
-
Regulatory Alignment: Centralized data capture dovetails with regulatory expectations. For instance, agencies increasingly advocate for risk-based monitoring and real-time oversight. A system like Miracle provides the auditability and centralized records that compliance reviewers need. In fact, FDA guidance on trial end-point simulation and real-world evidence could find better application when trial datasets are ready-to-analyze in such platforms. Interestingly, Miracle’s own resource library includes discussion of FDA’s AI guidance ([48]), indicating awareness of this evolving landscape.
-
Scalability of Trials: The ability to run multiple trials concurrently with one system positions sponsors to scale operations. Unified platforms mean adding another trial does not proportionally increase manual workload for tracking; the dashboards simply extend. Smaller biotechs, which often lack mature operations teams, could leverage Miracle to punch above their weight in managing complex pipelines. This may democratize the ability to run late-stage trials without huge ops investments.
Challenges and Considerations
No system is a silver bullet, and adopting platforms like Miracle comes with its own hurdles:
-
Data Quality and Harmonization: While Miracle automates integration, it still relies on upstream data input. Garbage-in yields garbage-out. If site staff delay data entry or enter inconsistent values, the dashboard reflects that delay. Organizations must still enforce good EDC practice. Moreover, aligning data definitions across systems (e.g. matching how labs code tests) can require effort. Miracle claims to automate much of this, but initial mapping may need domain expertise.
-
Change Management: Clinicians and monitors accustomed to weekly reports or spreadsheets may resist new workflows. Training and user buy-in are essential. Testimonials suggest adoption has been smooth in involved companies, but broader uptake in larger, change-averse firms might lag. Early adoption seems strongest in agile biotech, while big pharma legacy programs may take longer.
-
Dependence on AI Transparency: Platforms incorporating AI raise questions of explainability. Miracle’s founder emphasizes human-in-the-loop (citing the Parasaram view ([20]) that AI augments rather than replaces decisions). However, if a model predicts a trial will miss its milestone, stakeholders will want to know why (which site, what factors). Ensuring these insights are transparent, not “black box,” is key. The platform’s interactive dashboards mitigate this by letting users drill into data; but trust takes time to build.
-
Platform Maturity: As a relatively new company, Miracle may lack some refinements of older systems (e.g. extensive user permissioning, multi-language support, offline mode, etc.). Some functionalities (like seamless integration with patient-facing apps or direct EHR feeds) may be under development. Users should assess whether current features meet their needs.
-
Vendor Lock-In and Data Ownership: Organizations will want clear terms that their data can be exported if needed, and that Miracle will maintain integrations for the specific systems in use. Since Miracle is vendor-neutral, this risk is somewhat mitigated, but still a governance issue.
-
Cost and ROI: Miracle’s SaaS pricing (likely per-study or per-seat) must be justified by operational savings. For small sponsors, this could be substantial investment. However, given the scale of potential savings (see above), ROI case-builders tend to find it persuasive. Companies examining the decision should compute the value of time saved and risk-avoidance compared to the subscription cost.
Overall, while the challenges are non-trivial, the net positive of such platforms is compelling. They address deeply entrenched pain points with modern software engineering and analytics.
Future Directions
What lies ahead for miracle-like platforms and clinical trial operations?
- Wider Adoption of AI: As more trial data accumulates, ML models can become even more sophisticated (e.g. personalized patient dropout predictors or trial-specific risk scores). Partnerships with cloud AI providers (Miracle already works with AWS) will accelerate new features. The industry trend suggests that within a few years, AI-supported monitoring (rather than batch audits) will be standard. Miracle is poised for this wave – indeed, it’s notable that the FDA itself is moving AI “into the mainstream” ([22]).
- Decentralization and RWD Integration: Future trials increasingly incorporate remote data (wearables, home health visits). Platforms must ingest these streams too. Miracle’s architecture suggests it could integrate such feeds. In fact, its vendor-agnostic model implies that adding a new connector (e.g. to an eCOA app or wearable aggregator) is feasible. This would extend visibility further—enable real-time monitoring of patient adherence or vitals.
- Regulatory Oversight: Regulators may begin to expect sponsors to have real-time monitoring capabilities, especially for adaptive or high-risk trials. GCP (Good Clinical Practice) guidelines stress data quality and oversight; integrated platforms naturally facilitate compliance. We may see guidelines recommending (or requiring) digital dashboards for certain trials. If so, platforms like Miracle will gain official backing.
- Competitive Landscape: As the promise of integrated ops gains attention, more startups and legacy vendors will double down. We can expect consolidation (bigger vendors acquiring upstarts) or partnerships (e.g. CTMS vendors integrating external dashboards). Miracle’s challenge will be differentiating its AI and ease of use. Its relatively small size could hamper R&D speed, but also allows nimbleness.
- Global Trials and Standardization: Multi-country studies often suffer data fragmentation (different lab vendors, local data rules). Platforms will need to support global scaling and multilingual interfaces. Also, as global data standards (like SDTM or CDISC for data exchange) evolve, integration with those could streamline processes. Miracle could adopt standards for smoother regulatory submissions.
In essence, Miracle and similar platforms are a natural evolution in the digital transformation of clinical research. They are moving the industry toward an era of continuous data collection and oversight, much like finance or marketing has with real-time analytics. For Miracle specifically, the near future likely involves expanding its customer base, enriching analytics (more AI modules), and proving outcomes quantitatively (e.g. reducing trial durations in controlled comparisons).
By Centralizing trial data and insights, Miracle blurs the line between operations and information, fostering a predictive, proactive approach. As AI and cloud capabilities advance, we anticipate that in a decade, bifurcated “CTMS vs. dashboard” thinking will give way to seamless platforms underpinning virtually all aspects of trial management. Miracle’s early strides indicate that stakeholders are hungry for this future, and that its capabilities are on track to fulfill that vision.
Conclusion
Clinical trial data has long been a “black box” – disconnected, delayed, and opaque – hampering timely decision-making. The Miracle platform addresses these challenges head-on by integrating all trial data into one secure AI-powered dashboard, offering real-time transparency and predictive insights. Its capabilities (data integration from EDC, IRT, labs, safety databases, etc ([4]); interactive drill-down visualizations ([4]); AI-driven forecasts of enrollment and timelines ([6]) ([7]); automated data quality cleaning ([8]); and patient-centric profiles ([9])) represent a comprehensive toolkit for modern clinical operations.
We have cited multiple perspectives and evidence: analysis papers on dashboard utility ([18]) ([20]), industry reports on trial delays/costs ([1]) ([2]) ([31]), and concrete case examples ([10]) ([5]). Taken together, they underscore that Miracle’s approach is well-founded and impactful. Case studies indicate substantial efficiency gains (e.g. 20% less manual effort ([12]), days-to-minutes processing ([10])) and better trial management outcomes. These improvements are not theoretical: sponsors using Miracle reported earlier identification of recruitment issues and faster enrollment, evidencing that digital integration materially speeds trials.
Looking ahead, platforms like Miracle likely will become standard in deciding trials. The combination of regulatory encouragement (FDA’s AI initiatives ([22])), soaring market investment (AI in trials forecast $120B ([21])), and proven use cases signals that transforming clinical operations with data is the future. Miracle’s model – portable connectors, user-friendly dashboards, and embedded intelligence – exemplifies this future. As clinical research grows more complex (decentralized designs, precision medicine), tools that can synthesize complexity into clarity will be essential.
In conclusion, Miracle’s capabilities address fundamental pain points in trial operations. The platform’s success with real biotech clients and alignment with current trends suggests a highly positive outlook. By enabling real-time oversight, automated analytics, and data-driven agility, Miracle stands to significantly shorten trial timelines and reduce costs, ultimately accelerating the delivery of new therapies to patients.
References: Sources cited above are drawn from published literature and industry reports ([17]) ([35]) ([18]) ([30]) ([1]) ([2]) ([21]) ([22]). All platform-specific details are corroborated by Miracle’s documentation and case studies ([4]) ([8]) ([9]) ([7]) ([5]), as cited in the text.
External Sources (48)

Need Expert Guidance on This Topic?
Let's discuss how IntuitionLabs can help you navigate the challenges covered in this article.
I'm Adrien Laurent, Founder & CEO of IntuitionLabs. With 25+ years of experience in enterprise software development, I specialize in creating custom AI solutions for the pharmaceutical and life science industries.
DISCLAIMER
The information contained in this document is provided for educational and informational purposes only. We make no representations or warranties of any kind, express or implied, about the completeness, accuracy, reliability, suitability, or availability of the information contained herein. Any reliance you place on such information is strictly at your own risk. In no event will IntuitionLabs.ai or its representatives be liable for any loss or damage including without limitation, indirect or consequential loss or damage, or any loss or damage whatsoever arising from the use of information presented in this document. This document may contain content generated with the assistance of artificial intelligence technologies. AI-generated content may contain errors, omissions, or inaccuracies. Readers are advised to independently verify any critical information before acting upon it. All product names, logos, brands, trademarks, and registered trademarks mentioned in this document are the property of their respective owners. All company, product, and service names used in this document are for identification purposes only. Use of these names, logos, trademarks, and brands does not imply endorsement by the respective trademark holders. IntuitionLabs.ai is an AI software development company specializing in helping life-science companies implement and leverage artificial intelligence solutions. Founded in 2023 by Adrien Laurent and based in San Jose, California. This document does not constitute professional or legal advice. For specific guidance related to your business needs, please consult with appropriate qualified professionals.
Related Articles
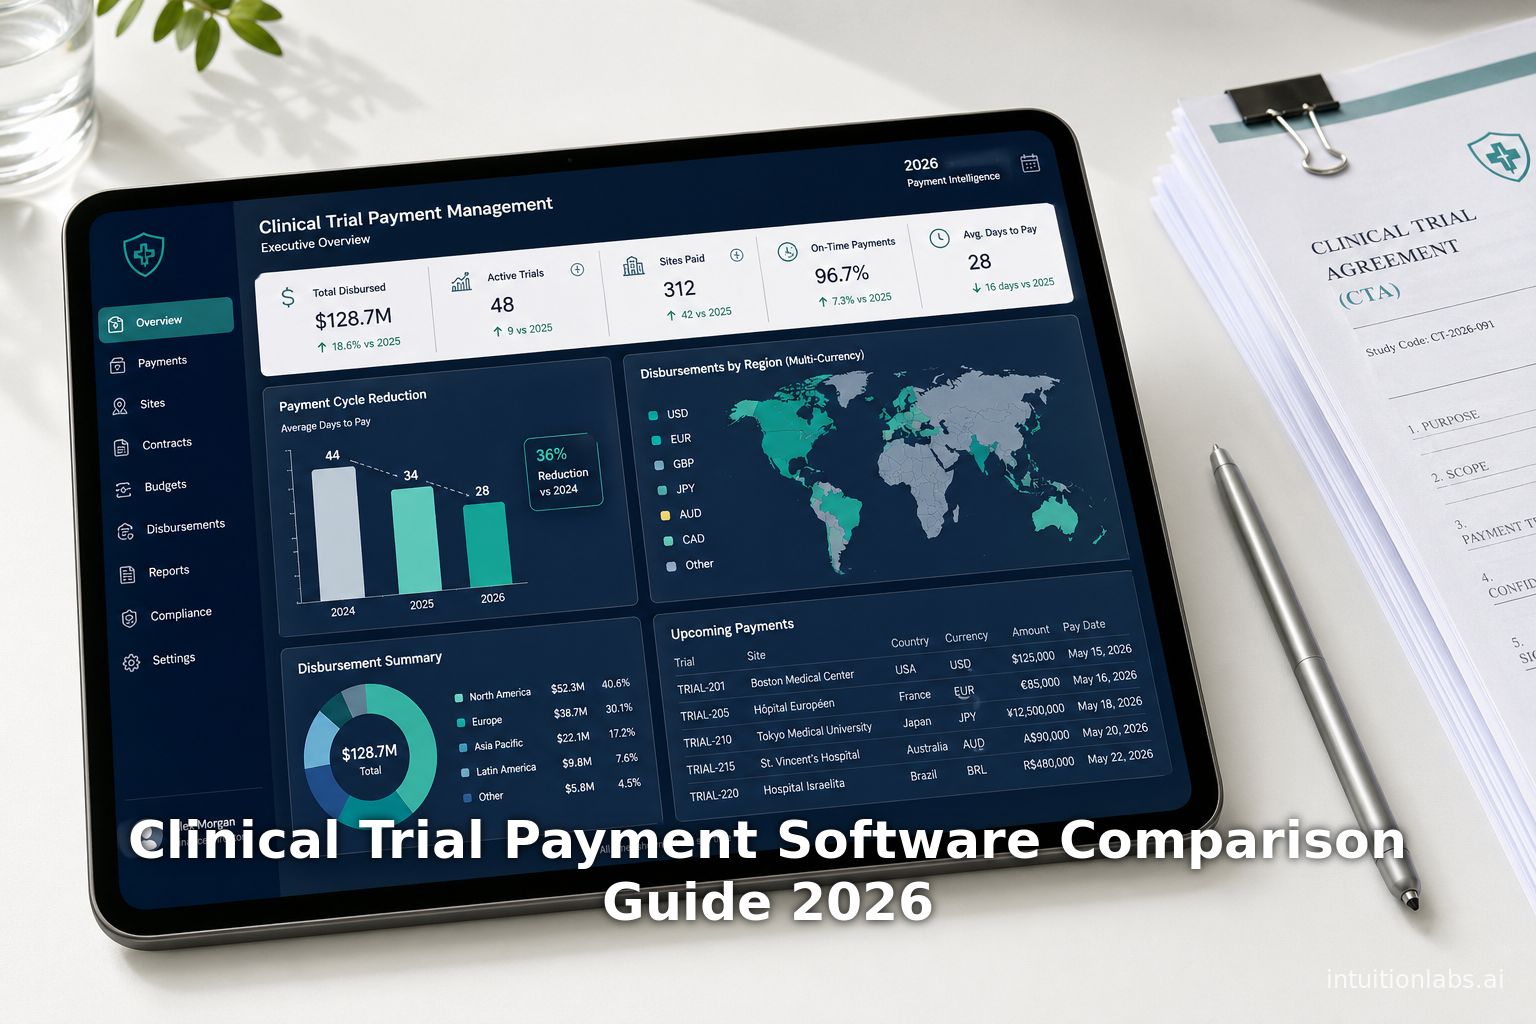
Clinical Trial Payment Software Comparison Guide 2026
Review this 2026 vendor comparison of clinical trial payment software. Analyze automated site payment and participant stipend management system capabilities.
CRO Data Integration: Clinical Data Lakes & Real-Time AI
Analyze CRO data integration patterns in clinical trials. Learn how sponsors use clinical data lakehouses, APIs, and AI for real-time data independence.
Life Sciences Software Market: 2026 Forecast & 5 Key Gaps
Analyze the life sciences software market projected to reach $45B by 2026. Examine AI trends, key segments, and five structural gaps hindering growth.