
Process Validation for Biotech: A PPQ & CPV Guide
[Revised April 25, 2026] — Updated to reflect ICH Q13 (Continuous Manufacturing of Drug Substances and Drug Products, Step 4 finalized November 2022), ICH Q9(R1) (Quality Risk Management revision, effective 26 July 2023), ongoing ICH Q12 (Lifecycle Management) implementation, the revised EMA Annex 1 (sterile manufacturing, effective 25 August 2023), and FDA's Quality Management Maturity (QMM) program (final report and rating framework released 2024-2025). The lifecycle PV paradigm itself remains unchanged.
Executive Summary
Process validation is a cornerstone of biotechnology manufacturing, ensuring that complex biologic processes reliably deliver safe, effective products batch after batch. Modern regulatory standards (FDA, EMA, ICH, WHO, PIC/S) mandate a lifecycle approach to validation, spanning process design, process performance qualification (PPQ), and continued process verification (CPV) ([1]) ([2]). Unlike legacy “validate once, file forever” paradigms, biotechnology firms must adopt Quality by Design (QbD) and risk-based practices from early development through commercial production ([1]) ([3]). In practice this means (1) designing robust processes around defined quality targets; (2) qualifying those processes at scale via well-planned PPQ campaigns to generate evidence of consistent performance; and (3) continuously monitoring process outputs and parameters (CPV) to detect drift and implement improvements ([4]) ([5]).
In this practical playbook we synthesize regulatory guidance and industry best practices to explain how biotech teams plan, execute, and sustain validation so that production “stays in control” post-launch. Key takeaways include: early risk assessment and QbD to establish critical quality attributes (CQAs) and control strategy ([6]) ([7]); a detailed PPQ protocol with statistically sound sampling and acceptance criteria ([8]) ([9]); and a robust CPV program using statistical process control (SPC), capability analysis, and alert limits to ensure ongoing control ([10]) ([11]). Data integrity and digital tools (MES, LIMS, automation) are vital to capturing and trending data in real time ([12]) ([13]). Throughout, we highlight case studies and warning‐letter analyses showing that failures in PPQ or CPV lead regulators to issue citations ([14]) ([15]), underscoring the business imperative of a data-driven, lifecycle validation strategy.
This report delves deeply into each element of PPQ/CPV for biotech, with extensive evidence-backed guidance, tables, and real-world examples. We cover the historical evolution and current regulatory state of validation, best practices for PPQ planning and execution, methods for CPV and trending, roles of organization and digital systems, and future directions such as continuous manufacturing and AI-enabled monitoring. Every claim is supported by citations from regulatory guidance and industry experts ([16]) ([1]) ([5]).
Introduction and Background
Biotechnology products (biologics, vaccines, cell and gene therapies, etc.) emerge from highly complex processes (cell culture, fermentation, purification, aseptic fill, etc.) that inherently involve biological variability. Ensuring consistent product quality – identity, potency, purity – is paramount for patient safety and efficacy. Unlike small molecules, biologics are large molecules often requiring living systems, so their processes have many critical variables (e.g. cell line performance, glycosylation patterns, viral clearance) that must be tightly controlled. Consequently, regulators demand rigorous process understanding and control to ensure process reproducibility and maintain a “state of control” throughout a product’s life ([3]) ([10]).
The concept of process validation has evolved over decades. Historically, validation meant manufacturing three consecutive conforming lots (“three runs and you’re done”) to demonstrate quality. Today, regulators recognize that this static model is insufficient. Since FDA’s 2011 Guidance “Process Validation: General Principles and Practices”, the industry has shifted to a lifecycle paradigm: (1) process design (development and scale-up informed by product and process knowledge), (2) process qualification (PPQ), and (3) continued process verification ([1]) ([6]). This approach mirrors ICH Q8/Q9/Q10 principles, embedding Quality by Design and risk management at every stage of product development and commercialization ([1]) ([3]).
For biotech in particular, FDA and EMA have stressed that post-approval monitoring is essential. For example, FDA defines validation as “collection and evaluation of data, from the process design stage through commercial production” to establish evidence of consistent quality ([3]). The guidance then explicitly requires ongoing verification once the process is confirmed to remain in control, effectively tying validation to continuous quality monitoring ([17]).Similarly, EMA’s revised Annex 15 (2015) and PIC/S guidelines mandate qualification and validation over the product lifecycle, with formal change control and quality risk management for any changes ([18]) ([19]). In practice, this means biotech firms must never view validation as a one‐time checkbox, but rather as an enduring program that leverages statistics and data analytics to ensure control ([16]) ([5]).
Quality by Design (QbD) is a cornerstone of this modern approach. ICH Q8 outlines building a quality target product profile (QTPP) and linking it via risk assessments to critical quality attributes (CQAs) and critical process parameters (CPPs). In biotech, QbD means using process characterization studies (e.g. Design of Experiments) to define design space and control strategy, so that variability sources are understood and mitigated before pilot or commercial scale. As one industry reviewer notes, “every biopharmaceutical manufacturing process has an associated control strategy” derived from product and process understanding ([20]). For example, development teams define CQAs (glycosylation, potency, impurity profiles, etc.) based on ICH Q8 principles ([7]), assess which parameters most impact those CQAs, and then design experiments to establish acceptable ranges and controls. Prior knowledge of similar molecules or platform processes is heavily leveraged to “de-risk” early development ([15]) ([21]).
In summary, today’s biotech process validation demands rigorous planning and execution at every phase, from cell-culture development through commercial production, supported by comprehensive data. The goal is to ensure not just that “three good batches” were made once, but that every batch remains in control via planned monitoring (Stage 3). The sections that follow detail how validation teams can achieve this, with a focus on practical steps, statistical evidence, and examples from industry practice and regulatory insight.
Regulatory Landscape and Historical Context
Evolution of Validation Paradigms
Historically, U.S. current Good Manufacturing Practices (cGMP) required manufacturers to produce drug products “with a high degree of assurance” of conformance, linking to Section 211.100(a) which mandates “written procedures for production and process control” ([22]). However, explicit guidance on validation matured over time. The 1987 FDA Blue Book letter on process validation mainly addressed small-scale or batch checks. A turning point was the FDA’s 2011 Guidance, which for the first time codified the Three-Stage Lifecycle Model for validation ([1]) ([5]). Stage 1 (Process Design) focuses on understanding and developing the process; Stage 2 (Process Qualification/PPQ) on demonstrating scale-up and reproducibility; Stage 3 (Continued Process Verification) on ongoing assurance after commercialization ([4]) ([3]). This replaced the older “prospective validation” and “concurrent validation” categories with a cohesive lifecycle approach.
Global regulators have similarly updated expectations. In Europe, the EMA’s 2014 Q&A on process validation and the 2015 revision of Annex 15 emphasize lifecycle and risk-based validation (consistent with ICH Q8/Q9/Q10). Annex 15 explicitly states that manufacturers must control critical operations through qualification and validation over the life cycle of the product, and that retrospective validation is no longer acceptable ([18]) ([23]). Annex 15 also requires a Validation Master Plan (VMP) to define the scope and responsibilities of the PV program ([24]). Similarly, PIC/S and WHO (Appendix 7, 2015) reinforce ongoing process verification as a post-approval requirement. In sum, the modern regulatory view is that validation is an active, continuous quality process, not a one-time report.
Key Guidance Documents
- FDA (2011): Process Validation: General Principles and Practices. Establishes the 3-stage model (Design, Qualification, CPV) ([1]), encourages use of statistics, risk management, and a science-based approach. Does not mandate “3 batches” universally, but instead calls for a rational sample size based on process understanding.
- EMA (2016): Annex 15 and Q&A (2014/16). Aligns with ICH and FDA; specifies no retrospective validation, minimum 3 lots (but more as needed) ([25]), and strong emphasis on lifecycle. Provides biologics-specific details (upstream culture, downstream purification) ([26]).
- ICH Q8/Q9/Q10: Q8 (Pharmaceutical Development) – QbD concepts and design space; Q9 (Risk Management) – tools for process risks; Q10 (QMS) – continuous improvement over product lifecycle ([20]) ([27]).
- ICH Q9(R1) (2023): Quality Risk Management — Revision 1. Reached Step 4 in January 2023 and became effective 26 July 2023 in the EU/EEA, with FDA adoption shortly after. The revision addresses long-standing critiques: it sharpens guidance on subjectivity in risk assessment, formalises the concept of formality (how rigorous a risk assessment needs to be), strengthens risk-based decision-making, and explicitly extends QRM to product availability (i.e. drug shortages as a quality risk). For PV, Q9(R1) reinforces that the level of PPQ effort, sampling, and CPV intensity must be commensurate with risk — not a one-size-fits-all checklist.
- ICH Q12 (2019, ongoing implementation): Technical and Regulatory Considerations for Pharmaceutical Product Lifecycle Management. Introduces tools such as Established Conditions (ECs), the Post-Approval Change Management Protocol (PACMP), and the Product Lifecycle Management (PLCM) document to manage post-approval changes more predictably. Adopted by FDA, PMDA, Health Canada, and Swissmedic; partially implemented by EMA (which has accepted ECs and PACMPs but flagged tension with the EU Variations Regulation). Q12 directly affects how CPV-driven process changes are filed and managed.
- ICH Q13 (2022): Continuous Manufacturing of Drug Substances and Drug Products. Reached Step 4 on 16 November 2022 and is being implemented across ICH regions through 2024–2026. Q13 codifies expectations for state of control, process dynamics, material traceability through residence time distributions, start-up / shut-down / diversion strategies, and validation of CM processes for both small molecules and biotech (including continuous bioprocessing). It explicitly endorses continuous process verification as the validation approach for CM, rather than discrete PPQ campaigns — making CPV-grade real-time monitoring a regulatory expectation, not just a best practice.
- EMA Annex 1 (revised, effective 25 August 2023): Manufacture of Sterile Medicinal Products. The first major rewrite since 2008. Introduces the Contamination Control Strategy (CCS) as a holistic, site-wide concept that ties together facility design, equipment qualification, process validation, environmental monitoring, and CPV. For sterile biologics, the CCS effectively becomes the umbrella under which PPQ and CPV evidence is organised. Annex 1 also raises the bar on Aseptic Process Simulations (media fills), PUPSIT (pre-use post-sterilisation integrity testing) of sterilising filters, and barrier technologies (RABS/isolators).
- WHO & PIC/S: 2015 WHO Technical Report Series 996 Annex 2 and PIC/S Annex 15 mirror EMA, advocating lifecycle PV and risk management. PIC/S adopted the revised Annex 1 in parallel with the EU (effective 25 August 2023, with the lyophilisation provisions effective 25 August 2024).
- FDA Quality Management Maturity (QMM) (2022–2025): Not a guidance per se, but a CDER programme that scores manufacturing sites on quality system maturity — including the robustness of their PV lifecycle, CPV programmes, and use of advanced manufacturing. FDA published the final QMM Prototype Assessment Protocol in 2024 and is moving toward voluntary public ratings. Sites with weak CPV programmes are scoring poorly, reinforcing the regulatory message that "CPV is mandatory, not optional."
Table 1 below compares key expectations:
| Aspect | FDA (2011) | EMA/PIC-S (Annex 15, 2015) | ICH (Q8/Q9/Q10) |
|---|---|---|---|
| Stages | Design, Process Qualification (PPQ), CPV ([3]) ([5]) | Same 3-stage model; no retrospective validation ([23]) | Emphasizes continuous lifecycle (dev, tech transfer, manufacturing, discontinuation) ([28]) |
| PPQ Lots | No fixed number; based on risk and product/process understanding ([25]) | Generally ≥3 consecutive commercial lots; must justify otherwise ([25]) | Q9 encourages justification of sampling based on risk. |
| Concurrent PV | Allowed with justification (rare use) ([25]) | Typically discouraged; only if patient benefit justifies risk ([23]) | N/A (focuses on risk-based decisions) |
| CPV requirement | Explicit Stage 3 requirement; CPV data recommended in submissions ([29]) | Explicit ongoing PV; quality oversight at all stages ([30]) | Extends QMS (Q10) to include CPV and continual monitoring. |
| Risk Management | Strong emphasis on QbD and risk (FDA encourages design of experiments, SP statistical methods) ([29]) | Requires risk-based decisions (e.g. changes → requalification), references Q9 ([31]) | Central: risk-based approach to define controls and acceptance criteria. |
| Data Requirements | Supports leveraging process understanding and multivariate analysis ([29]) ([21]) | Requires documented control strategy and justification of data packages ([18]) | Encourages science/risk justification in filings (e.g. design space in submissions). |
| Biologics-specific | Applies same 3-stage concept to biologics and APIs ([3]) | EMA guidance adds details for cell culture, viral clearance, multi-site transfers ([26]) | ICH Q8/Q10 applicable to biotech (focus on product knowledge, QMS). |
These controls and QMS requirements ensure that post-approval quality is built into the system: “quality, safety, and efficacy should be designed or built into the product; quality cannot be assured only by in-process and finished-product testing” ([32]). In other words, robust process validation is the foundation of consistent quality in biotech.
Stage 1: Process Design and Development
The first stage of lifecycle validation is Process Design. At this early phase, the goal is to translate product knowledge into a reliable manufacturing process and control strategy such that CQAs will consistently meet specifications ([6]) ([33]). In practical terms, Stage 1 activities include: defining the Quality Target Product Profile (QTPP); identifying CQAs (e.g. potency, glycosylation, charge variants, particulate count) and mapping them to process parameters (CPPs); conducting risk assessments (e.g. FMEA) to prioritize critical steps; and employing Design of Experiments (DoE) to explore how inputs affect outputs ([34]) ([29]).
“In Stage 1, process design (FDA) or process characterization (EMA), the objective is to obtain process knowledge and understanding as the basis for establishing an approach to process control for each unit operation and the process overall.” ([35]).
Key tasks in this stage include:
- Quality by Design (QbD) frameworks: Derive a QTPP based on intended use/safety/efficacy, then identify all relevant CQAs (ICH Q8) ([36]) ([6]). For example, a monoclonal antibody’s CQAs might include charge variants, aggregation, glycan profile, binding affinity, etc. ([7]). A risk-based approach ties each CQA to CPPs; parameters with high risk to product quality (e.g. bioreactor feed rates, pH, mixing efficiency) are earmarked for tight control or extensive study.
- Experimental design: Use DoE and scale-up studies to empirically map how variations in CPPs/CMAs affect CQAs ([29]). For instance, factorial design might test multiple bioreactor feed rates and temperatures to see impact on protein titer and quality. Statistical models from DoE define acceptable operating ranges (design space) and identify “edge-of-failure” conditions ([37]) ([29]). The output is an evidence-based control strategy that includes normal operating ranges and in-process controls.
- Control Strategy Development: Based on DOE and risk assessment, outline how each unit operation will be controlled. This may involve setting up PAT (Process Analytical Technology) sensors (e.g. in-line pH or UV monitors), specifying raw material attributes, environmental conditions, and formulation parameters. For biotechnology, control strategy must cover the entire bioprocess: cell culture (cell density, viability), purification resin performance (column loads, flow rates), and viral inactivation steps, among others ([26]) ([38]). These decisions are documented in protocols and the Process Validation Plan.
- Knowledge management: As the FDA and industry emphasize, extensive prior knowledge should be exploited ([21]). If using a well-characterized platform (e.g. CHO cell line producing similar mAbs), leverage historical data to streamline experiments. Early clinical batch data and stability studies can inform which attributes truly matter. Many firms thus invest in knowledge repositories and scale-down models (using small bioreactors or cell-strip systems) to bracket variability.
The end of Stage 1 is a well-defined manufacturing process and control strategy ready for qualification. By the conclusion of process design, teams should have a Process Design Report summarizing: QTPP, identified CQAs/CPPs, results of DoE studies, chosen design space, and an initial protocol for Stage 2. This report forms the centerpiece of the Validation Protocol. As one expert notes, “Stage 1 involves defining the commercial manufacturing process based on development and scale-up… identifying CQAs, mapping them to CPPs… and specifying controls” ([39]).
Throughout Stage 1, cross-functional involvement is crucial. Manufacturing, R&D, analytical development, and quality personnel collaborate on risk assessments and DOE design. Quality groups ensure documentation is adequate and that plans are auditable. At least one corporate guideline suggests initiating process risk assessment even for Phase 1 projects ([40]), reflecting best practices that early QbD planning de-risks later PV stages.
Stage 2: Process Qualification (PPQ)
With the process design finalized, Stage 2 (Process Qualification or Process Performance Qualification, PPQ) executes the plan under commercial conditions to demonstrate reproducibility ([41]) ([8]). PPQ is the “bridge between development and routine production” ([42]). It typically involves manufacturing multiple consecutive commercial-scale batches using production equipment, trained operators, and lots of realistic raw materials. The main objectives are to confirm that the process, when performed as planned, consistently meets quality specifications and to collect comprehensive process and product data as evidence.
2.1 PPQ Protocol and Planning
Core to PPQ success is a thorough PPQ protocol. This document (or master protocol plusBatch Records) must be developed prospectively and approved by the quality unit before execution ([8]). Key elements of a defensible PPQ protocol include:
- Objectives and Scope: Clearly state goals: to verify process capability, gas reproducibility, and define control limits.
- Batch Size and Number: While FDA no longer mandates exactly three batches, traditional practice is to run at least three consecutive successful batches ([25]). This number may increase (to 6 or more) if justified by complexity or variability. The protocol must justify the chosen number of PPQ runs based on risk (CFR 211.111(b) requires k=3 unless otherwise justified). Annex 15 expects at least 3, but also requires rationalization ([25]).
- Material and Equipment Variability: The PPQ runs must reflect normal production variability. This means using different batches of raw materials (different qualified suppliers or lots) and varying routine conditions (different operators, shifts, equipment)” ([43]). “Golden batch” approaches (hand‐picked ideal lots and operators) are discouraged; instead, worst-case and nominal scenarios should be included (e.g. highest impurity raw material, lowest yield cell bank).
- Sampling Plan: Define detailed sampling during each batch. Sampling should target potential failure modes (e.g. blend uniformity mapping for sterility products, stratified inhomogeneity samples, container closure integrity tests across different containers ([44])). The PPQ protocol pre-specifies the number of samples and analyses at each critical step, including in-process checks and final quality tests. Acceptance criteria for each measurement must be set before execution, based on statistical or clinical rationale, not arbitrary margins.
- Statistical and Analytical Methods: The protocol should describe how data will be analyzed. Common approaches include calculating means, standard deviations, and confidence or tolerance intervals for key attributes ([45]). Equivalence testing or tolerance interval methods are often used for assay data. Capabilities (Cp, Cpk) may be computed, especially in chemical processes, but as one expert cautions: “’Cpk must be 1.33 for everything’ is lazy – acceptance should reflect patient risk and knowledge of variability” ([45]). For biotech, naturally variable attributes may have wider limits, supplemented by robust monitoring.
- Deviation and Excursion Handling: The protocol must outline how to handle out-of-spec (OOS) or out-of-trend (OOT) results. For example, any CPP excursions could defer release unless investigated. Duties: suspect results should be evaluated against protocol criteria – some companies define “statistical alert limits” (e.g. warning Cpk=1.0) to prompt review.
- Data Integrity Controls: Specify that all data will be captured under validated systems with traceability (MES, LIMS, e-records). Part 11/Annex 11 compliance measures must be in place (unique logins, signatures, audit trails) ([12]) ([13]). Plans should note how spreadsheets or manual data will be locked or independently checked.
- Personnel and Responsibilities: The protocol lists roles: manufacturing executes the runs, QA oversees, QC performs testing, statisticians analyze results, etc. QA and management have sign-off authorities.
Comprehensive PPQ planning prevents “theater” validation. SG Systems global emphasizes: “Plan PPQ with risk and realism, execute with clean data capture, prove capability with statistics, then keep it validated through CPV… no theater, just evidence” ([46]). In effect, PPQ planning is as much about thoughtful protocol design as it is about actual manufacturing.
2.2 Execution of PPQ Campaign
Once the PPQ protocol is approved, manufacturing commences the qualification runs. These runs should be performed as if routine; the same equipment, procedures, and master batch records intended for commercial production are used. Best practices include:
- Pre-Run Checks: Ensure all critical equipment has passed IQ/OQ and preventive maintenance, all sensors calibrated, and facility environment stabilized (cleanroom classification, HVAC, utilities) ([47]) ([48]). [10] notes that validating on unfit assets is “busywork” – incomplete qualification must be resolved before PPQ.
- Strict Adherence to Protocol: Operators follow developed recipes exactly (e.g. setpoints, hold times). Any deviation (process upset, instrument failure, contamination, etc.) is documented in real time. The use of electronic batch records (eBMR) in an MES helps enforce sequence, tolerances, and automatically capture data ([49]). Deviations must be addressed per SOPs, but run continuation decisions (stop/pause/terminate) should align with predefined criteria.
- Contemporaneous Data Entry: All measurements (e.g. bioreactor pH vs time, chromatography UV responses, analytic assay values) should be recorded live into secure systems. Manual data (e.g. titrations, visual checks) should be transcribed into logbooks or spreadsheets immediately and then entered into LIMS ([12]). Backfilling or post hoc reporting invites questions; SG Systems warns that “’We’ll paste it tomorrow’ breeds investigations” ([50]). Key achievements: ensure timestamps, signatures, instrument IDs are linked to each data point.
- In-Process Control Testing: Perform all routine IPC (in-process checks) defined in SOPs: e.g. cell density and viability for a bioreactor, pH titrations, intermediate purity checks. These IPC results are part of PPQ evidence. If IPC yields outliers, teams must document investigation and decisions.
- Final Product Testing: After completion, each PPQ batch’s drug substance and drug product are sampled for full release testing: potency, purity, identity, sterility, etc. All must meet specifications. In biotech, this can include multi-attribute methods (mass spec, capillary isoelectric focusing, glycan profiling) which must be validated before or during PPQ.
- Statistical Analysis: Upon run completion, statistical evaluation as per protocol begins. Analysts compute means and variabilities for each quality attribute across batches. Control charts may be started; capability indices (Cp, Cpk) calculated if appropriate. The team checks whether performed data meet the predefined acceptance criteria. Typical success criteria might be that all means fall within spec limits and process variability is acceptable. Note: with only a few batches, statistics have limited power; nevertheless, at least basic inference (e.g. confidence in meeting specs) is done as documented.
- Investigation of Exceptions: Any failure or trend is rigorously investigated. If a batch marginally misses a criterion, quality/R&D teams determine root cause (raw material variation? operator error? instrument drift?). Corrective actions (CAPA) may be launched. If a root cause is found, PPQ can continue under the pre-planned protocol if justified. Major failures might require extending the protocol with additional runs or repeating earlier stage development (this is rare if Stage 1 was done well).
- Completion and Reporting: After all planned runs execute successfully, a PPQ Report is compiled. This formal document narrates the entire PPQ campaign: protocol summary, run execution logs, analytical data, statistical evaluation, deviations and CAPAs, and conclusions on process capability. The report’s conclusion explicitly states whether the process is validated and highlights any limitations or pending items for CPV.
Throughout execution, traceability and quality oversight are vital. Quality assurance personnel often observe any PPQ run (attend start-up, critical steps, and final closure). All equipment and master records should be in controlled systems (PLCs, MES). The SG Systems playbook stresses that data integrity by design is a must: instrumentation is qualified, audit trails intact, and any manual spreadsheets are locked-down ([12]) ([13]). In short, the evidence from PPQ must stand up to regulatory scrutiny as documentation of “routine” production – not a special, hand-crafted experiment.
2.3 Examples of PPQ Practices
- Batch Sampling Strategy: In a bioreactor process, a thorough plan might sample the bioreactor content at multiple time points for cell viability, metabolite levels, and titer. In downstream chromatography, each column fraction is tested for protein content. For aseptic fills, container closure integrity (CCI) testing is performed on multiple units per line. SG Systems notes that “sampling must be sensitive to failures that matter,” e.g. blend uniformity mapping across the entire powder bed or stratified content-uniformity tests for low-dose vials ([44]).
- Worst-Case Inputs: For example, if raw material X (a complex media component) has historical variability, the PPQ runs might include high and low ends of that variability. Similarly, if a chromatography resin is known to perform differently at the end of its lifetime, one PPQ run might use a resin lot near its maximum cycle life. These worst-case considerations help ensure that acceptance criteria are truly robust.
- Real Biotech Case: In one industry case (AGC Biologics), a contract manufacturer tackled two novel biologics concurrently (one Phase 1, one Phase 3) by performing early risk assessments and developing initial process control strategies for both. Instead of waiting until late-stage, AGC de-risked the processes at bench scale through QbD principles. They committed to “custom-designed, Continuous Process Verification” programs for both products to detect even small shifts proactively ([15]). This modern, science-based approach exemplifies how early planning and ongoing monitoring work hand-in-hand in biotech PV.
Stage 3: Continued Process Verification (CPV)
After PPQ is complete and the process “goes commercial”, Stage 3 – Continued Process Verification (CPV) – begins. CPV encompasses all ongoing monitoring activities to ensure the process remains in a validated state ([10]) ([51]). Rather than treating validation as finished at PPQ, CPV recognizes that process drift, raw material changes, equipment wear, and other factors can affect long‐term performance. Thus, CPV is continuous assurance during routine manufacturing.
“CPV provides the ultimate evidence that a process is running under a state of control.” ([52])
CPV is both a regulatory requirement and a quality management practice. FDA’s PV guidance explicitly says that Stage 3 is recommended for all commercial processes, and the current expectations (FDA, EMA, PIC/S) are that companies have routine programs to collect and analyze process and product data ([52]) ([10]). Key elements of CPV include:
- Defining the CPV Plan: The control strategy and PPQ results define what needs ongoing monitoring. CPV begins with a formal plan approved by Quality that specifies: (a) which parameters and attributes will be tracked; (b) data sources (MES/LIMS); (c) frequency of review; and (d) decision criteria (alert/action limits). Often this plan is integrated into the Equipment/Batch-Cold matrix or CPV charters.
- Parameter Classification: Parameters are classified by impact to prioritize monitoring intensity. A common scheme (from Sigma) is: Critical Process Parameters (CPPs) – direct impact on quality and safety, to be routinely monitored; Key Process Parameters (KPPs) – impact CPPs or measure consistency, monitored routinely; and Monitored Parameters (MPs) – less critical, trended as needed ([53]). For example, in an aseptic fill line, container-closure integrity or media fill performance would be CPPs to monitor at each run; fill-speed motor current might be a KPP; room-temperature could be an MP checked daily.
| Parameter Category | Definition | Monitoring Strategy |
|---|---|---|
| Critical Process Parameter (CPP) | Directly impacts product CQAs (identity, purity, potency). Must be in control to ensure quality ([53]). | Monitor every run (control charts); enforce strict control limits. |
| Key Process Parameter (KPP) | Affects CPPs or process consistency. Influences overall performance. ([53]) | Routine monitoring; ensure no shifts predisposing CPP failures. |
| Monitored Parameter (MP) | Minor or indirect influence; tracked for trend or troubleshooting purposes ([53]). | Periodic checks or as indicated; used to diagnose issues if trends shift. |
,《Table: Parameter classification in continued process verification (adapted from ([53])).》
-
Data Collection: During routine production of each commercial batch, relevant data are collected. This includes process setpoints and readings from the Distributed Control System or MES (e.g. bioreactor time-logs), as well as results of in-process or release assays. Ideally, data flows automatically into a historian or LIMS. In practice, CPV programs often rely on aggregating EPQ reports and environmental monitoring logs, plus production metrics (yield, cycle times).
-
Statistical Process Control (SPC): A cornerstone of CPV is the use of control charts and capability analysis. For each critical attribute/parameter, control charts (X-bar/R, I-MR, EWMA, etc.) are maintained ([54]) ([55]). These charts can use either within-batch subgrouping or batch-level points (depending on data). SG Systems points out that univariate SPC (charting one parameter at a time) is common, but statisticians increasingly incorporate multivariate methods to capture correlations ([55]). Generic industry practice is to establish statistical alert and action limits from PPQ data (or the first 15–30 commercial batches) ([11]). For example, after PPQ the first 20 batches might be used to compute process mean and 3σ control limits; future values beyond these limits trigger investigations.
-
Trend Analysis and Signals: Data are evaluated against pre-set criteria. An “out-of-specification” (OOS) test result will obviously lead to investigation. But CPV also catches subtler “out-of-trend” (OOT) events: deviations that do not breach specs but indicate a drifting process. For instance, if a critical parameter consistently creeps toward its upper control limit, that must be flagged. SG Systems warns that any “drift inside specifications” should be treated as a signal – an OOT event requiring action – before an out-of-spec occurs ([56]). Well-defined run rules (Western Electric or Nelson rules) should be used to make SPC signaling objective ([54]).
-
Investigation and CAPA: When a control chart alarms or a CQA moves toward spec limits, a failure-investigation follows. The goal is to identify root causes and implement corrective actions before product quality is compromised ([56]). CAPA effectiveness is then confirmed by improved metrics in subsequent monitoring. CPV data and investigations feed back into the quality system; for example, an observation of increased variance in a chromatography step might lead to a new preventive maintenance schedule or revision of SOP.
-
Continuous Improvement: CPV is not only guard-rails but also a tool for ongoing optimization. Trends may reveal opportunities (e.g. consistently high yields > target could allow tightened ranges for future batches). The process improvement loop (Plan-Do-Check-Act) is supported by CPV data. Clause by clause, ICH Q10 and GMPs envision that CPV insights should be used for continuous improvement initiatives ([27]).
-
Review and Reporting: CPV activities culminate in regular review meetings and formal reports. Examples include monthly SPC reviews by quality engineers, quarterly management reviews of trends, and the Annual Product Review (APR) or Process Performance Review (PPR). These reviews should document that the process remains capable. Ongoing CPV documentation (charts, analysis) is archived as part of the batch record/trend files for inspection readiness.
Sigma Aldrich (Millipore) summarizes the expectation well: during CPV, companies must “develop sustained programs which collect and analyze product and process data to evaluate the state of control and to identify problems as opportunities to implement improvements.” ([10]). In short, CPV turns raw production data into actionable knowledge that keeps the process validated.
3.1 CPV Statistical Tools and Sampling
Statistical Tools: The most prevalent CPV tools are control charts and capability indices ([55]) ([56]). Typical choices include X-bar and Range charts for continuous data, I-MR charts for individual laboratory results, and EWMA charts for detecting small shifts. Capability indices (Cp, Cpk) quantify how well the process variation fits within specs. Note that univariate charts look at one variable at a time, but some organizations supplement with multivariate techniques (PCA, PLS) to capture correlation between multiple CQAs ([55]). Before applying SPC, firms perform Gage Repeatability and Reproducibility (R&R) studies to confirm measurement systems are reliable ([56]).
Sampling and Data Volume: A practical challenge in CPV is obtaining enough data to be statistically meaningful. Unlike PPQ where you plan a fixed number of batches, CPV can accrue very large datasets. However, many organizations start with batch-level aggregation: e.g. one datum per batch (the assay result, the process parameter average). Sigma Aldrich guidance suggests using the first 15–30 batches to set statistical baselines (means, control limits) ([11]). After that, periodic sampling (every batch, or each shift) of parameters is performed. For critical attributes with long assay times (e.g. stability-indicating methods), results may be trended as they become available, with interim control by surrogate measures (e.g. in-process spectrometers).
A key principle is that CPV data must be from routine manufacturing. Thus, once commercial production is underway, every batch contributes to the CPV dataset. For example, in a bioreactor operation, every batch’s peak titer, viability trajectory, and final quality assay all feed into CPV. If a single batch deviates significantly, it is scrutinized (often by a CPV report in the MBR). The process remains “validated” as long as CPV shows stability.
3.2 CPV in Action: An Example
Consider a monoclonal antibody cell culture. Critical CPPs might include bioreactor temperature, pH setpoints, dissolved oxygen (DO) control, and impeller speed; a CPP failure could alter glycosylation or titer. In CPV, one would chart e.g. daily oxygen uptake rate, daily viable cell density, and final potency each batch. If, say, viable cell density begins trending downward over 10 batches (within specifications but creeping), quality staff will investigate nutrient feed consistency or media storage conditions. If an outlier record appears (say final protein concentration 2% low), that batch triggers immediate CAPA review, even if still within spec.
In upstream biotech, CPV often also tracks key raw material attributes. For instance, amino acid or growth factor potency in media lots might be trended to identify supplier variation. Downstream, yield and purity from each chromatography batch are trended, and instrument calibration logs are reviewed. Environmental monitoring (air particle counts, microbial logs) is likewise trended as part of the CPV program for sterile processes. Essentially, CPV monitors whatever aspects the design stage deemed critical.
3.3 CPV Documentation
Every CPV activity must be documented. Operators or QC analysts typically note each CPV datapoint in an electronic system (e.g. LIMS or MES trend logs). Quality then prepares periodic Trend Reports summarizing key metrics: control charts annotated with limits, runs of consecutive increases/decreases flagged, and commentary on any unusual patterns. Audits will want to see that CPV procedures exist and are followed (e.g. SOPs requiring shift managers to review designated charts and raise flags). During inspection, regulators will ask for evidence that batches were released only when CPV charts remained in control throughout prior production.
Data Management and Quality Systems
A powerful theme across PPQ and CPV is the need for rigorous data integrity and digital infrastructure. How can organizations ensure that their enormous PPQ and CPV datasets are trustworthy and accessible? Several best practices have emerged:
- Composite Electronic Systems: Ideally, plant-wide systems (ERP/MES/LIMS/WMS) are integrated so that batch data flows seamlessly. For PPQ and CPV, an MES can enforce recipe execution and record process parameters (setpoints, actual values, alarms) with timestamps ([57]) ([49]). LIMS should automatically receive lab-test results with instrument IDs and method versions. Integration reduces transcription errors and enables real-time trending dashboards.
- Audit Trails and E-Signatures: Electronic logs for all key steps (scale-up calculations, batch record approvals, deviations) must include unique user IDs and digital signatures. Regulatory compliance (21 CFR Part 11, EU Annex 11) requires that any data changes or releases are traceable ([13]). As SG Systems emphasizes, every piece of PPQ/CPV data should be “attributable, contemporaneous, and secured by audit trails” ([16]). If paper or spreadsheets are used, they must be locked (version controlled, password protected) and finalized (wet-signed) immediately.
- Validation of Software: Any computer system used (MES, in-house apps) must itself be validated. This includes functions for data collection, charting, and reporting. Common advice is to involve IT early for validation project plans, and to leverage modern GxP cloud or SaaS tools that are already 21 CFR Part 11-compliant.
- Data Analytics Tools: Many companies now employ statistical software (JMP, Minitab, Spotfire) for CPV analysis, and some are experimenting with machine learning on historical batches to detect subtle before-the-limit drifts. These tools support CPV by automating chart updates and calculating capability indices. However, care must be taken to qualify these tools and ensure they pull only validated data sources.
- Data Retention: For PPQ evidence, all raw data (instruments logs, lab worksheets) must be retained in the official batch records. For CPV, time-series data might be archived in a historian or QMS repository. Annex 15 requires that all validation evidence be archived in controlled systems where it can be retrieved—even years later—for inspections ([58]).
In essence, data is proof. Modern inspections expect to click through computer systems to see PPQ entries and CPV charts. SG Systems stresses that the validated state is only credible so long as data capture is robust: “If spreadsheets are used transiently, lock them down… ‘We’ll paste it tomorrow’ breeds investigations” ([50]). Biotech firms invest in digital platforms to avoid such issues.
Quality Governance and Organizational Aspects
Executing PPQ/CPV with discipline requires clear governance:
- Validation Master Plan (VMP): A VMP (or PV strategy document) outlines the site’s entire strategy for qualification and validation, including PPQ and CPV (attached to Annex 15 requirement ([24])). It designates responsible groups (Engineer secures facilities IQ/OQ; QA approves protocols; Manufacturing executes; QC tests). The VMP also lists documents (protocols, reports, change control triggers) and references applicable regulations. Auditors expect a high-level plan showing validation is systematized.
- Quality Unit Oversight: Per GMP, the Quality Unit reviews and approves all PV documents, deviations, and releases results ([24]). In CPV, periodic reviews (e.g. conducting a monthly visuals or quarterly statistical review) are QA-controlled. Internal audits (stage 3) check that PV equipment qualification is current and that CPV activities are being performed per plan.
- Change Control Integration: Annex 15 and industry practice demand that any change to process, equipment, materials, or control strategy be risk-assessed and managed. For major changes, proposed adjustments are evaluated during Change Control (MOC/MOD) and may trigger re-qualification or PPQ repeats (as part of Stage 2 revisits). CPV data feed this loop: for example, if CPV indicates a drift correlated to a raw material lot change, that would flow into change control reviews.
- Training and Resources: Staff conducting PPQ and CPV must be trained in GMP and statistical methods. Many companies form a cross-functional validation team (Manufacturing, Q, QC, Engr., Data Science) that meets regularly. During CPV, often a dedicated data-review team meets (this function may rotate among quality personnel). Adequate resources (dedicated statisticians, quality engineers) are recommended by experts to ensure CPV data are actually analyzed ([59]).
- Continuous Learning: Effective PV programs have a learning loop. Lessons from PPQ/CPV (e.g. unexpected variability source) are fed back into early development for future products. Many firms create “validation knowledge books” to capture these lessons for new teams.
Proper governance is often the difference between a successful CPV program and one ignored. FDA and EMA both emphasize that quality oversight is constant: “appropriate quality oversight is essential over the entire validation lifecycle” ([25]). (Annex 15 also notes that validation personnel report within the quality system, even if not QA by title ([60]).) In effect, PPQ/CPV is not optional paperwork but a cross-department mandate to safeguard quality.
Data Analysis and Evidence-Based Quality
The strength of modern PV lies in data analysis. Several likeminded experts observe that PPQ/CPV is about data-driven proof of control:
- Design of Experiments (DOE) at Stage 1 and statistical analysis at Stage 2 maximize product- and process-knowledge early ([29]). DOE reduces uncertainty about operating ranges, which shrinks the burden of proving control later. For example, a well-designed CQA mapping can eliminate irrelevant variables, focusing PPQ on truly critical factors.
- Capability Indices: Many biotech companies compute Cp, Cpk (short-term and long-term) for critical quality attributes after PPQ. While a batch or two cannot fully define “Cpk”, trending this index across more batches becomes a key CPV metric. A sharp drop in Cpk from one quarter to the next signals rising variability.
- Control Charts: For CPV, control charts serve as real-time analytics. Take the example of the standard deviation of a viral clearance filter across runs; even if all batches pass virus specification, an increasing standard deviation—visible on a chart—would prompt proactive filter replacement to avoid a future failure.
- Process Capability Studies: As part of PPQ or ongoing improvement, firms sometimes conduct capability studies (e.g. paired t-tests or equivalence tests) to quantify how likely the process stays within spec limits. If capability is low, more PPQ-like runs or immediate corrective measures may be instituted.
- Root-Cause Tools: If CPV indicates an issue, formal root-cause analysis (fishbone diagrams, five whys) leverages the collected data to pinpoint causes. Data mining historical PPQ logs can reveal correlations (e.g. correlation of water quality readings to cell titer drops).
- Digital Twins and Modeling: A frontier trend is to build digital process models (via multivariate or mechanistic models) that run in parallel with actual production. Some companies simulate “virtual batches” to predict CPV outcomes. One strategy described in literature uses Monte Carlo simulations and multivariate models to enable CPV as early as Stage 1 ([5]). While still emerging, such data-centric approaches exemplify how analysis can continuously feed back into validation.
In all cases, proper servicing of data is essential. Any hypothesis (e.g. “Rinse water turbidity affects filter life”) must be validated against historic PPQ/CPV data. Critically, teams distinguish between “engineering signals” (normal variability) and true shifts. Thus, statistical training and tools are vital. Survey data from regulatory interactions show that inspectors increasingly expect to see SPC charts and data logs as part of validation documentation ([61]) ([56]).
Case Studies / Industry Examples
FDA Warning Letters Analysis
An illuminating real-world study by Sayeed-Desta et al. (2018) mined FDA warning letters (WLs) for PV issues. Reviewing 85 WLs (2017–2018), the authors found 40% had process validation observations ([62]). Notably, finished product sites had more PV-related citations than API sites. Common findings included missing or inadequate PPQ studies and failure to implement CPV programs ([14]). For example, 17 WLs cited lack of CPV programs, and 8 cited missing PPQ. In many cases, inspectors directly quoted CFR 211.100(a) and noted that firms lacked data-driven control procedures. The study concluded that the most frequent inspection gap was a deficient CPV program that failed to monitor process variability ([61]). These patterns strongly suggest that neglecting CPV is a red-flag.
Moreover, the warning letter authors often recommended “hiring a qualified consultant” to bring data-driven, science-based PV programs into compliance ([63]) ([61]). In other words, regulators are explicitly expecting firms to have robust PPQ and CPV. The analysis provides a stark lesson: modern PV deficiencies are frequently cited, and addressing them requires investment in statistical tools and personnel ([61]).
AGC Biologics QbD Approach
A biotech CDMO, AGC Biologics, published a case study highlighting early QbD and CPV. Working on two novel molecules (Phase 1 and Phase 3), they began with risk assessments and QbD-based process design rather than deferring validation. AGC’s team defined CQAs and an initial control strategy at project initiation, integrating quality systems to support scale-up ([40]) ([64]). Unlike typical CMOs that “wait to implement full control strategy at final PV”, AGC built it “into the technical transfer Quality Systems” ([40]). Importantly, they pledged a “custom-designed CPV program” to detect even minor shifts proactively ([65]). By doing so, they delivered a set of regulatory documents (risk assessments, control strategies) well ahead of traditional timelines, positioning the client for accelerated development ([66]). This laudable example shows how combining early risk-based planning with a lifelong CPV can “de-risk” biotech processes, reducing time and cost in later stages ([66]).
Continuous Manufacturing and Pandemic-Era Adaptations
The COVID-19 vaccine effort provides a modern perspective on expedited validation. A 2022 analysis of regulatory flexibilities (Vaccines Europe/IFPMA) noted that in a pandemic, traditional process validation (scale-up and 3 lots) could add months. To accelerate supply, regulators and industry proposed risk-based flexibility: allowing concurrent manufacturing at multiple sites, deferring some validation evidence post-approval, and leveraging platform prior knowledge ([67]) ([68]). For example, companies manufactured at multiple drug substance/ product sites simultaneously, with an understanding that final validation docs could be submitted as post-approval commitments ([69]) ([68]).
The report emphasizes that risk-based approaches (ICH Q9) should be used: e.g. if an mRNA vaccine uses a well-characterized lipid nanoparticle platform, much of the process validation may rely on prior data rather than new experiments ([68]). They even suggest decoupling drug substance and drug product validation: using previously produced DS lots for DP validation, to save time ([70]). While these measures apply to crises, they highlight general principles now entering mainstream PV: (a) global regulators seek alignment on data requirements; (b) prior knowledge can justify reduced PV burdens; and (c) flexibility (with oversight) may become part of future PV strategies. It is a vivid case of how CPV’s emphasis on science and risk is influencing even emergency product launches.
Implications and Future Directions
Technological Trends
Emerging technologies promise to strengthen PPQ/CPV:
- Advanced Analytics / AI: With more data from continuous production, AI and machine learning may identify subtle patterns. For example, anomaly detection algorithms could automatically spot complex multivariate drifts that univariate charts miss. Digital twins and real-time predictive models (as envisioned by Zuwei Jin) could allow CPV to become fully integrated from Stage 1 onward ([52]). As one vision suggests, Pharma 4.0 initiatives will link MES/WMS/QMS data to provide live validation status ([71]) ([49]).
- Process Analytical Technology (PAT): Inline sensors (spectroscopy, soft sensors) allow near-real-time monitoring of CQAs during PPQ and routine runs. If product CQAs can be inferred on-line (e.g. NIR for protein content), then CPV can flag deviations immediately. PAT data also increase the volume of CPV data for trend analysis.
- Continuous Manufacturing: Some biotech firms are exploring continuous bioreactors (perfusion + continuous capture) or fully continuous fill/finish. ICH Q13 (Step 4, November 2022) is now the global reference for CM validation. It introduces specific concepts that reshape PV: process dynamics (start-up, shut-down, planned/unplanned disturbances), residence time distribution (RTD) for material traceability, and diversion strategies when a transient excursion occurs. Q13 explicitly positions continuous process verification as the validation paradigm for CM — discrete PPQ "lots" become operating campaigns, and CPV-grade real-time monitoring is required from day one rather than added in Stage 3. FDA's first CM approvals (e.g. Janssen's Prezista, Vertex's Symdeko, Pfizer's Daurismo, Eli Lilly's Verzenio CM line) and EMA's growing CM dossier demonstrate the principles are workable; for biotech, perfusion-based mAb processes (e.g. WuXi Biologics, Sanofi) are now adopting Q13-aligned validation strategies.
- Digital Quality Systems: Quality systems are moving to cloud-based, integrated platforms. Automated CAPA workflows and deviation management linked to CPV analytics can shorten response times. Document management systems now enable immediate retrieval of historical PPQ data (which helps answer inspector queries quickly).
Organizational and Regulatory Evolution
- Regulatory Harmonization: Vaccine initiatives spotlight the need for harmonized PV expectations. In the future, we may see international convergence on CPV requirements (e.g. mutual acceptance of CPV plans, global data standards). This could simplify multinational biotech operations.
- PCV and Lifecycle Management: As regulators emphasize lifecycle activities, companies will likely embed CPV and validation metrics into key performance indicators (KPIs). For example, a firm might track “percentage of PPV parameters within control limits” as a quality metric reported to top management.
- Training and Culture: Implementing robust CPV will require cross-trained teams: data scientists in quality, bioprocess engineers savvy in statistics, etc. Organizationally, validation teams that once disbanded after launch now remain active throughout a product’s life, often merging with operational Excellence or Lean teams.
- Advanced Therapies: Cell and gene therapies present new PV challenges (autologous processes, viral vector consistency). Some aspects, like patient-by-patient product uniqueness, resist standard CPV. However, principles still apply (monitoring viral vector yields, potency assays, etc.) and are a current hot topic.
Key Lessons
The evidence suggests that firms treating PV as an ongoing commitment reap benefits. A well-implemented CPV program catches process issues before patient harm or supply disruption occurs ([59]). Data-driven validation can even reduce manufacturing costs: fewer out-of-spec batches, more predictable yields, proactive maintenance. In contrast, companies that consider validation “done after PPQ” risk the twin costs of regulatory citations and having to scrap product or recall.
As one SG Systems expert succinctly put it: “Validation isn’t three green checkmarks – it’s the sustained ability of a process to hit the target, proven by data you can defend.” ([72]). That data – gathered via disciplined PPQ and CPV – is the ultimate assurance that biotech manufacturing remains in control post-launch.
Conclusion
In this playbook, we have charted a comprehensive path for planning, executing, and maintaining biotech process validation. We have stressed that modern PV is a lifecycle journey: begin with a QbD-driven design, move through rigorous PPQ, and never stop with CPV. The goal is a validated state that survives the test of time, equipment changes, supplier variations, and regulatory scrutiny. Key points include:
- Early Scientific Rigor: Apply risk assessment and DOE in development to build a robust control strategy ([38]) ([6]).
- Protocol Discipline: Execute PPQ under representative conditions with clear acceptance criteria and comprehensive data collection ([8]) ([9]).
- Continuous Data Monitoring: Use statistical process control, alert limits, and trending to guard process control in routine production ([10]) ([54]).
- Quality Systems Integration: Embed CPV in the QMS via change control, annual reviews, and training ([27]) ([24]).
- Data Integrity Focus: Ensure all evidence is trustworthy (audit trails, validated tools) so that the judgment of “process is in control” is defensible ([13]) ([12]).
Decision-makers should note that both regulators and industry experts view PV as an ongoing commitment. The future of biotech manufacturing will only increase these expectations as product complexities grow. We encourage teams to adopt a data-driven mindset, invest in analytical capabilities, and think proactively – the payoff is reliable manufacturing operations and better patient outcomes.
In essence, a robust PPQ/CPV program is not a cost but an investment in product stewardship. With regulators worldwide insisting on lifecycle validation, organizations must leverage all tools – procedural, statistical, and digital – to demonstrate that Every batch is a validated batch. This playbook provides the roadmap and references needed to build that sustainable quality foundation in biotech manufacturing.
External Sources (72)

Need Expert Guidance on This Topic?
Let's discuss how IntuitionLabs can help you navigate the challenges covered in this article.
I'm Adrien Laurent, Founder & CEO of IntuitionLabs. With 25+ years of experience in enterprise software development, I specialize in creating custom AI solutions for the pharmaceutical and life science industries.
DISCLAIMER
The information contained in this document is provided for educational and informational purposes only. We make no representations or warranties of any kind, express or implied, about the completeness, accuracy, reliability, suitability, or availability of the information contained herein. Any reliance you place on such information is strictly at your own risk. In no event will IntuitionLabs.ai or its representatives be liable for any loss or damage including without limitation, indirect or consequential loss or damage, or any loss or damage whatsoever arising from the use of information presented in this document. This document may contain content generated with the assistance of artificial intelligence technologies. AI-generated content may contain errors, omissions, or inaccuracies. Readers are advised to independently verify any critical information before acting upon it. All product names, logos, brands, trademarks, and registered trademarks mentioned in this document are the property of their respective owners. All company, product, and service names used in this document are for identification purposes only. Use of these names, logos, trademarks, and brands does not imply endorsement by the respective trademark holders. IntuitionLabs.ai is an AI software development company specializing in helping life-science companies implement and leverage artificial intelligence solutions. Founded in 2023 by Adrien Laurent and based in San Jose, California. This document does not constitute professional or legal advice. For specific guidance related to your business needs, please consult with appropriate qualified professionals.
Related Articles
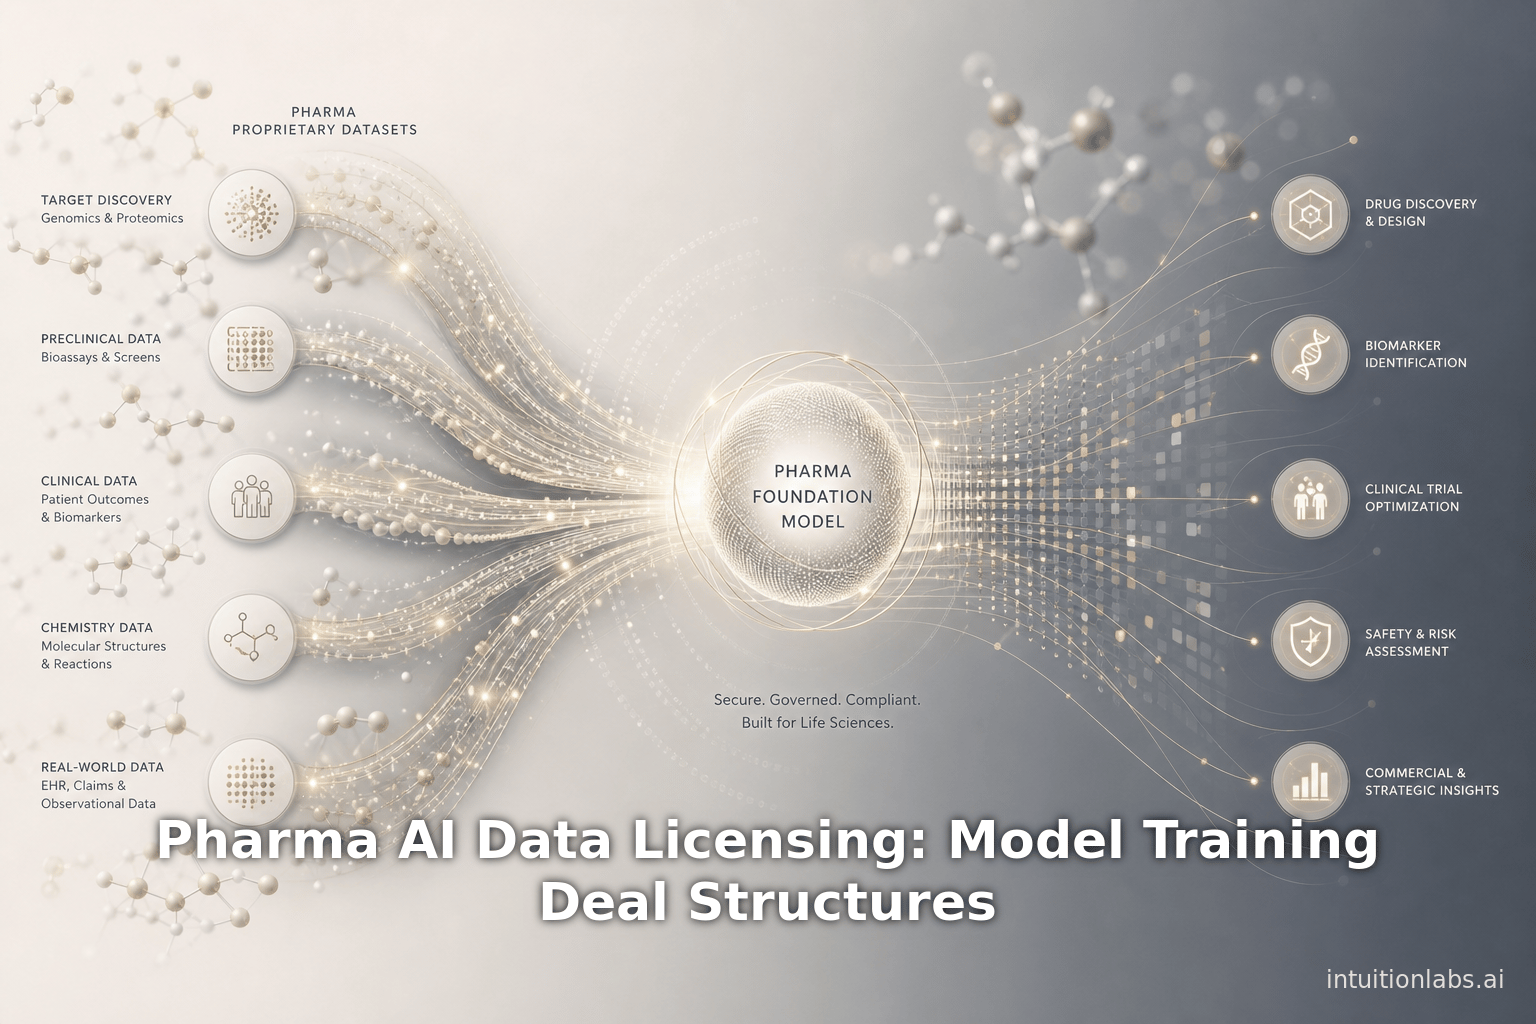
Pharma AI Data Licensing: Model Training Deal Structures
Learn how pharmaceutical companies license proprietary R&D data to train AI foundation models. Analyze deal structures, pricing terms, and key case studies.

Generative Antibody Design: Chai-3 and Pharma AI Strategy
Learn how generative antibody design models like Chai-3 operate, and analyze Pfizer's licensing strategy and the pharma AI build-versus-partner decision.
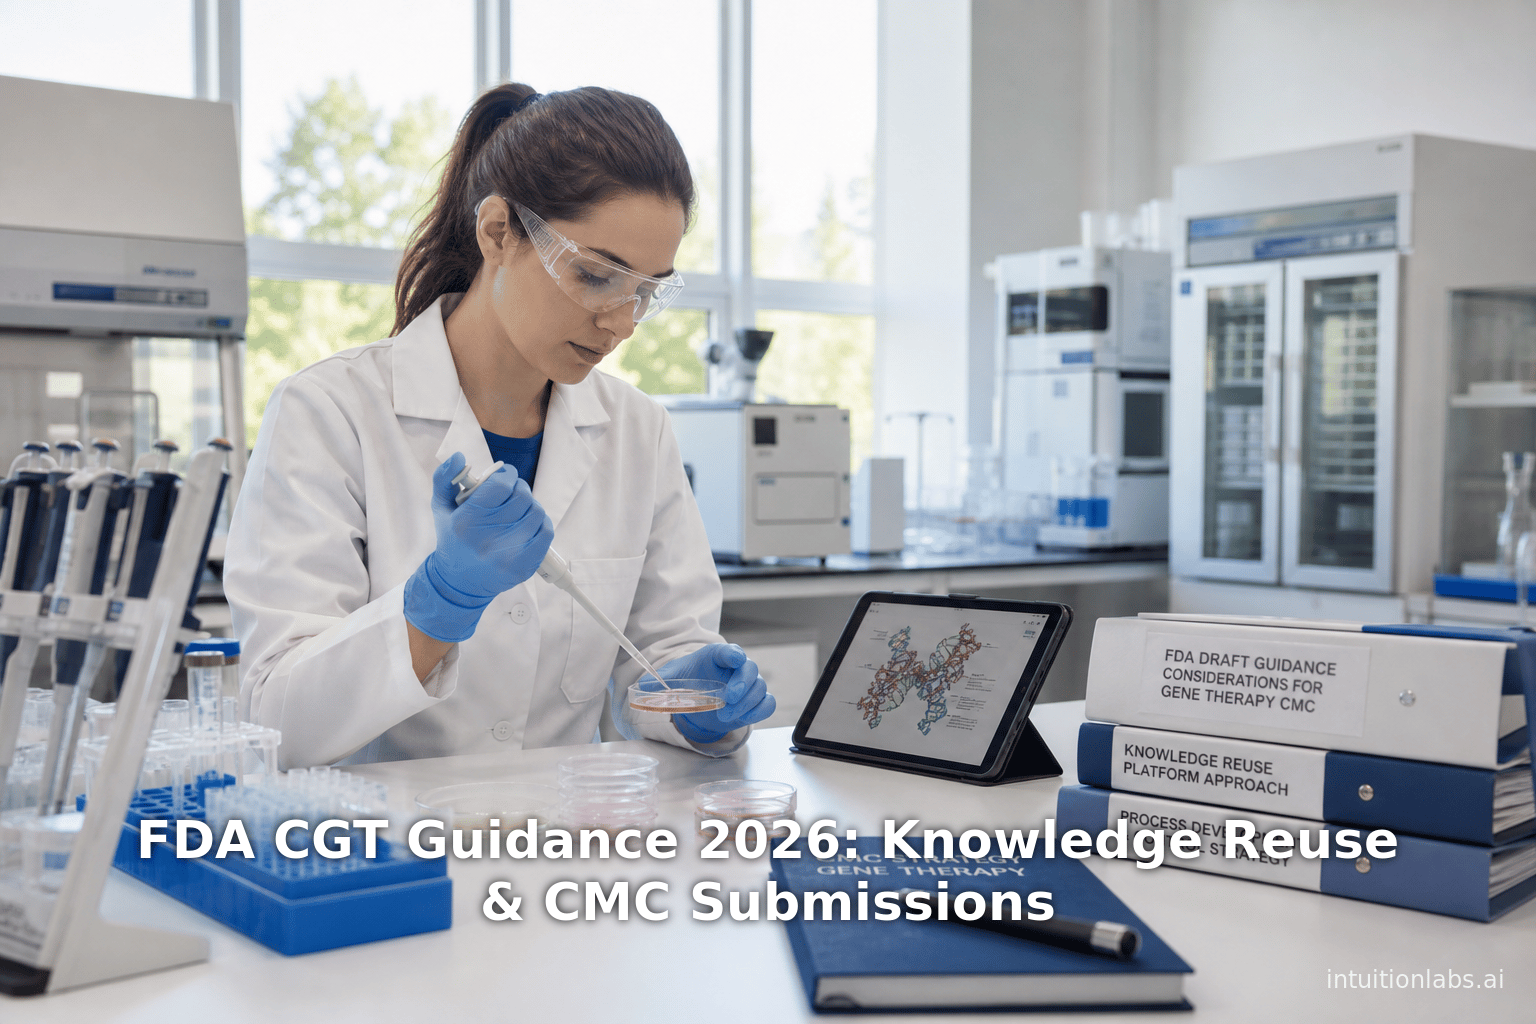
FDA CGT Guidance 2026: Knowledge Reuse & CMC Submissions
Analyze the June 2026 FDA draft guidance on cell and gene therapies. Understand how reusing platform knowledge streamlines CMC submissions and development.