
Medical Field Dashboard
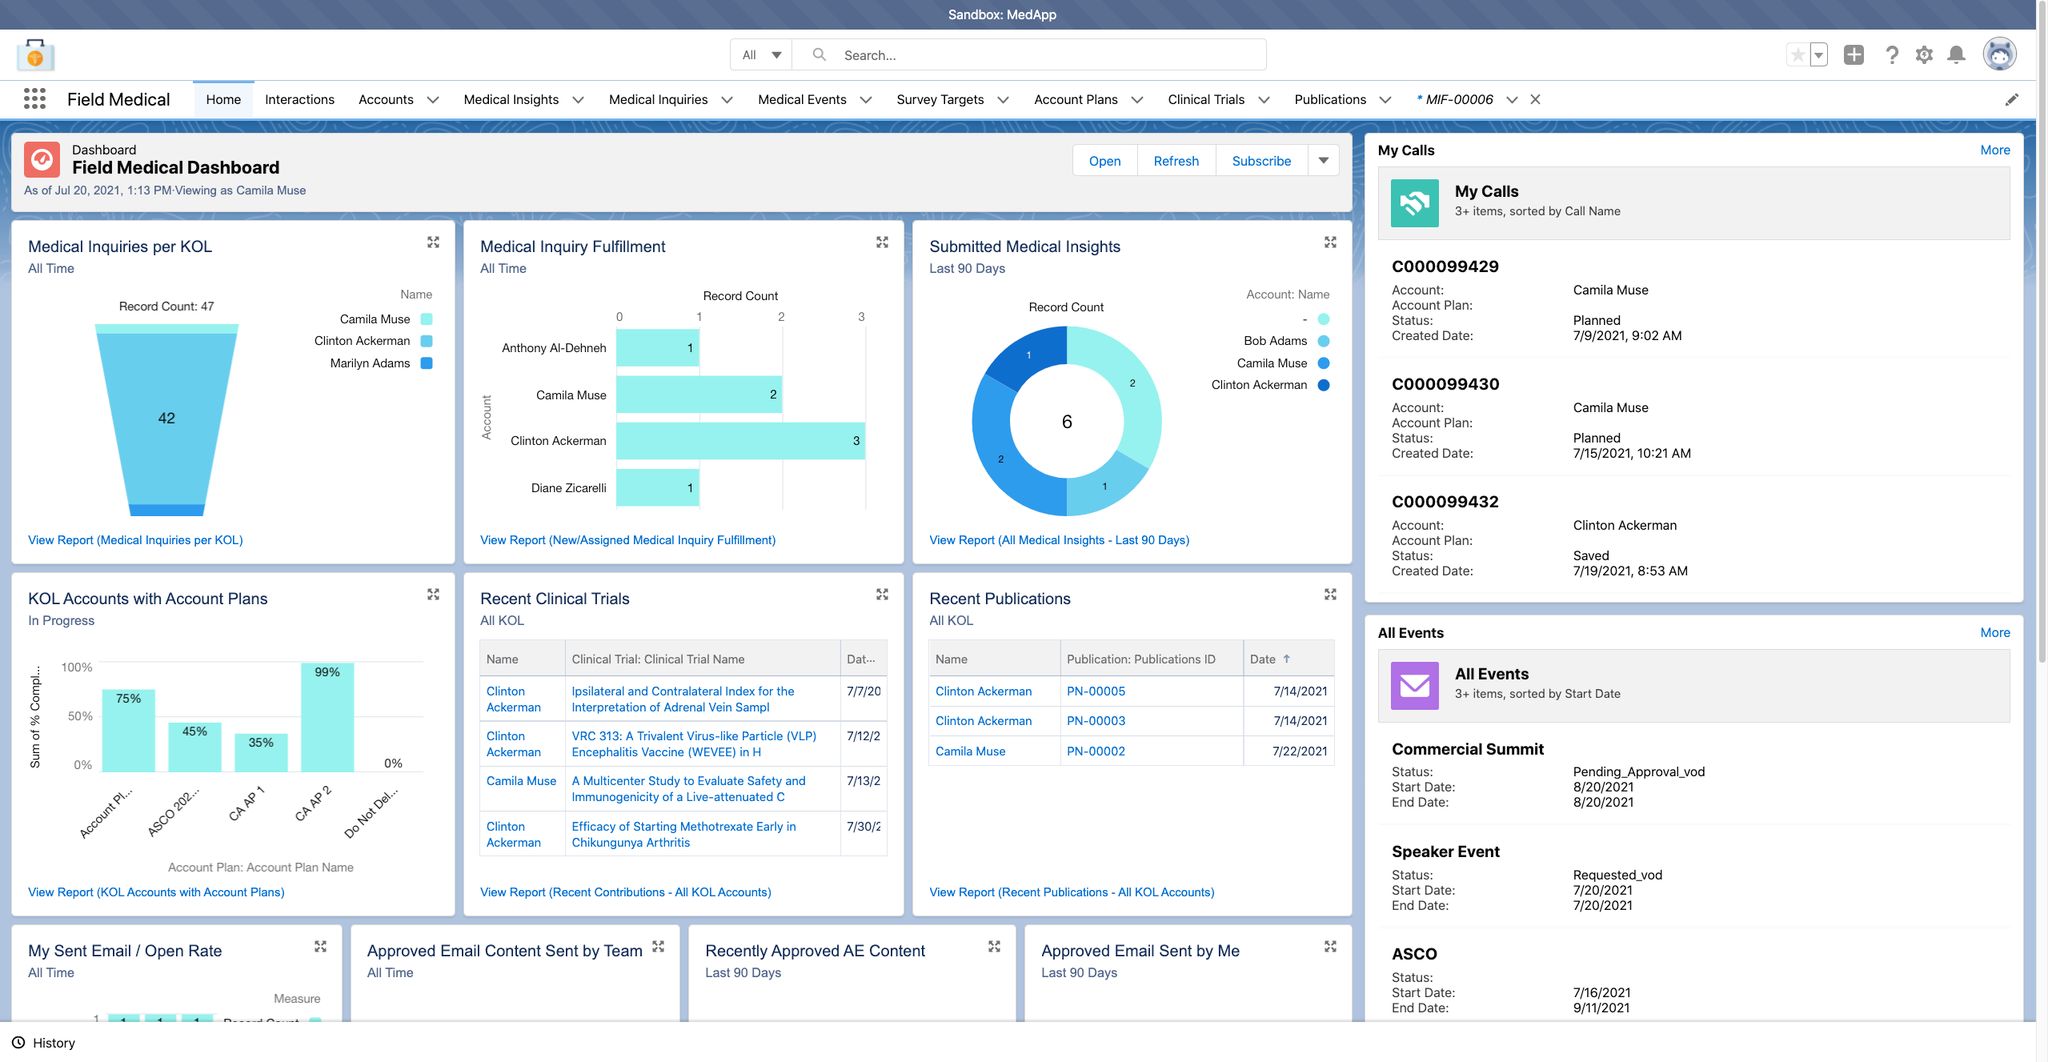
The screenshot presents a comprehensive "Field Medical Dashboard", displaying key performance indicators and medical insights. The dashboard is segmented into several panels, including "Medical Inquiries per KOL", showing a funnel chart with a record count of 47, narrowing down to 42. A bar graph titled "Medical Inquiry Fulfillment" displays the record count for each account. The panel "Submitted Medical Insights" visualizes data for the last 90 days via a donut chart, indicating a record count of 6. "KOL Accounts with Account Plans" is represented as a bar graph, displaying percentage completion for different account plans like Account Plan, ASCO 202..., CA AP 1, and CA AP 2 with values of 75%, 45%, 35% and 99% respectively. "Recent Clinical Trials" and "Recent Publications" are listed in tables, showing name, trial/publication titles, and dates. The right-hand column features "My Calls" displaying a list of call records including account details, account plan, status, and created date (e.g. "C000099429" for Camila Muse). "All Events" lists events such as "Commercial Summit" and "Speaker Event", including statuses and start/end dates.