
Events Management Dashboard
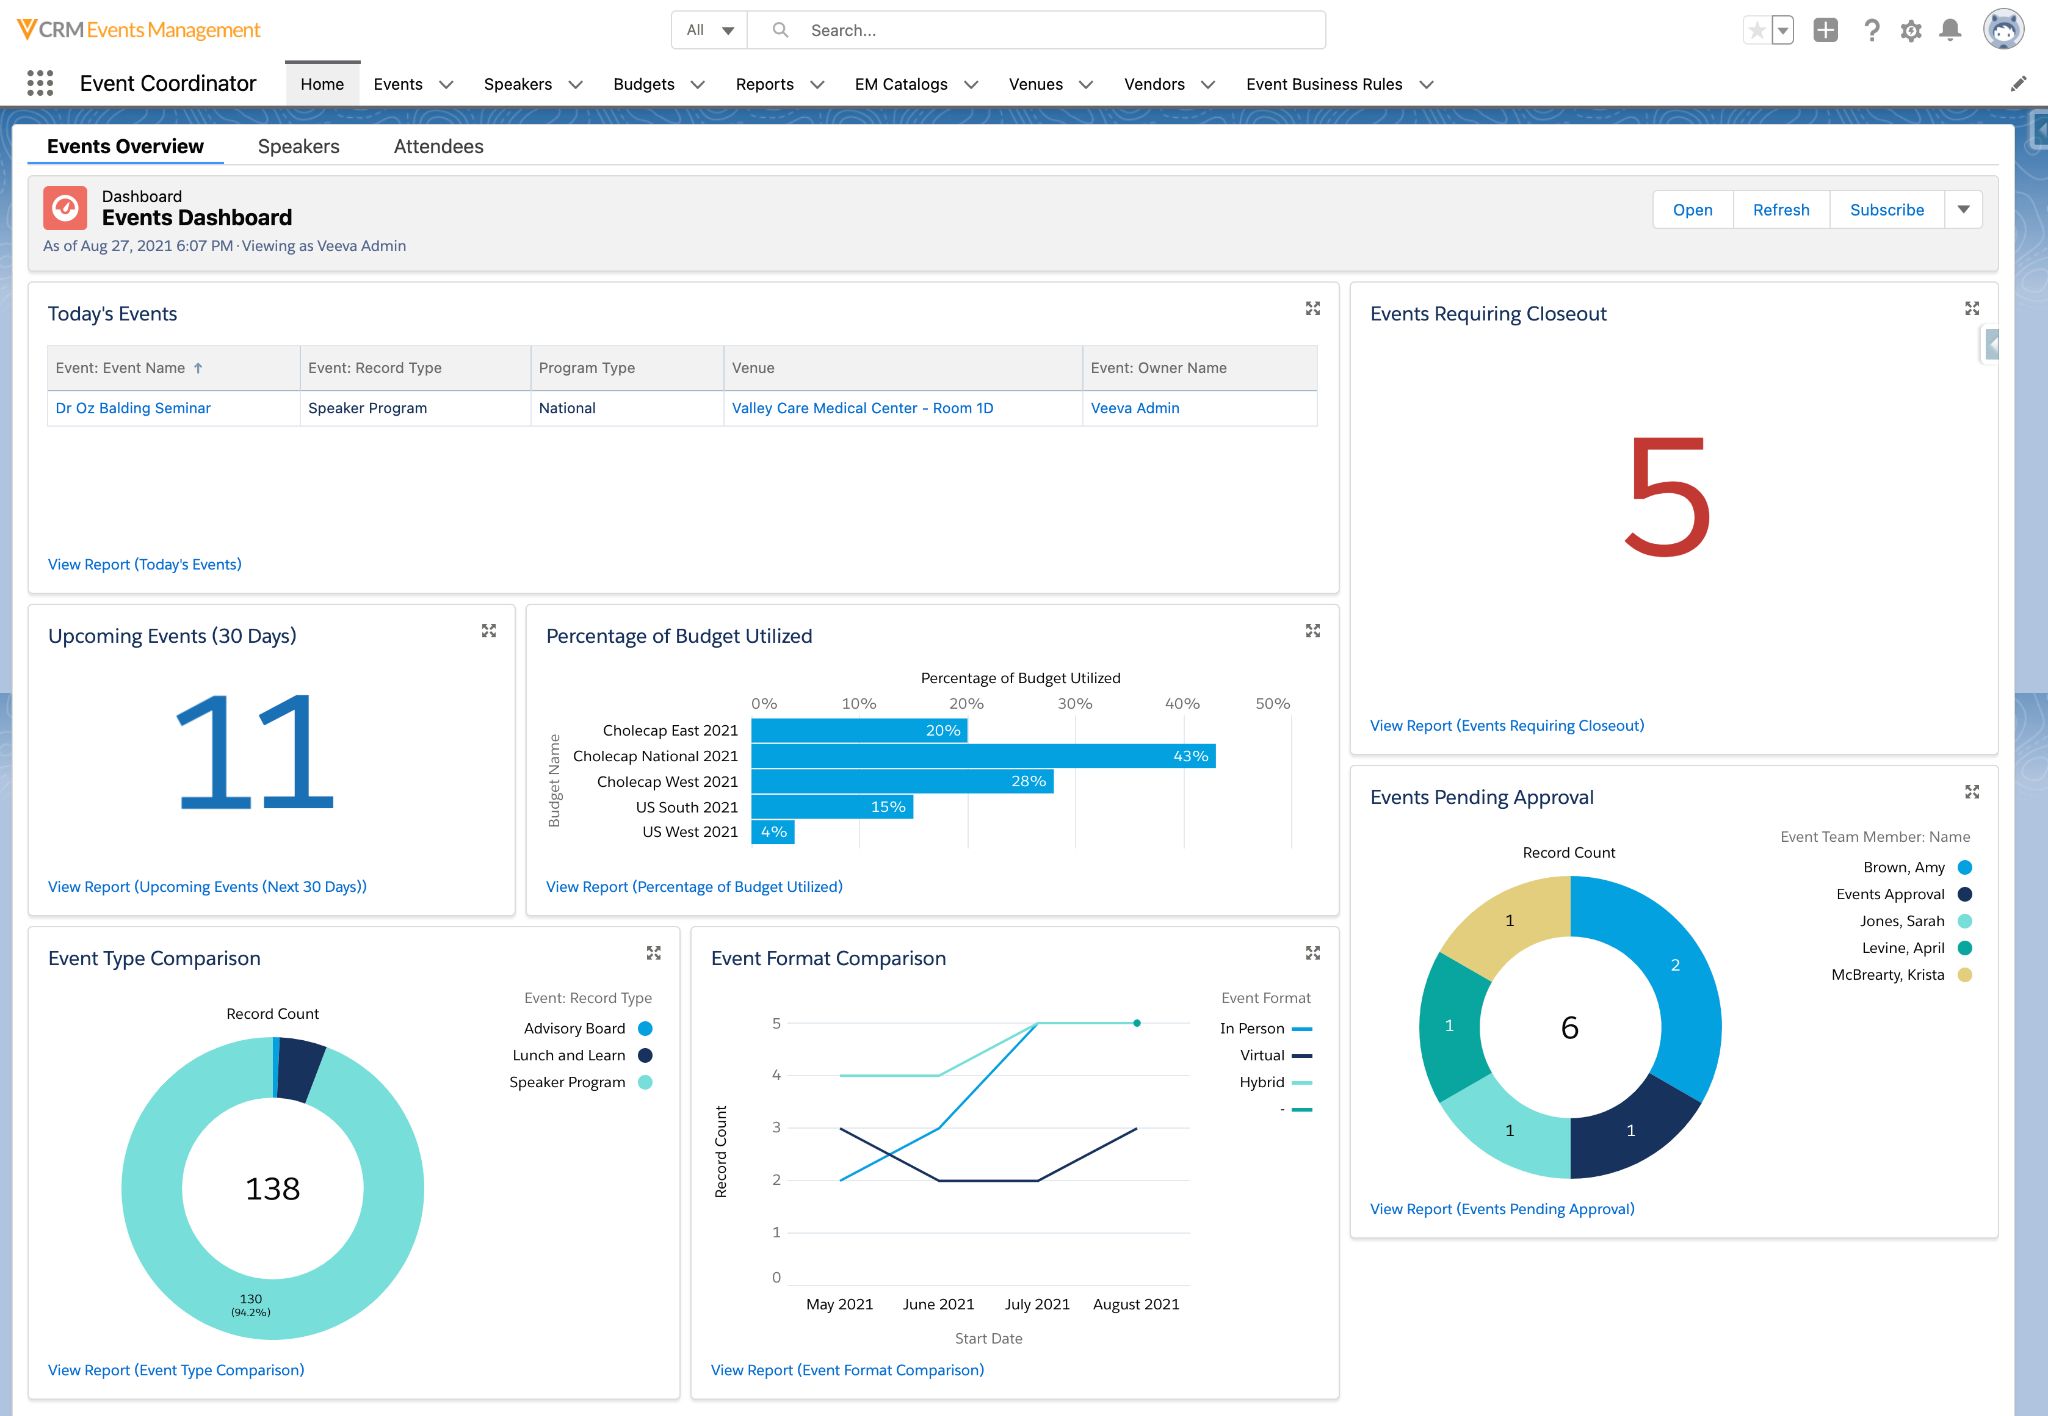
The screenshot presents an event management dashboard interface. At the top left, it shows the "Events Overview" tab is selected, and below it is the "Events Dashboard". It indicates it's viewed as "Veeva Admin" as of Aug 27, 2021, 6:07 PM. The "Today's Events" section lists one event, "Dr Oz Balding Seminar," categorized as a "Speaker Program" with a "National" program type held at "Valley Care Medical Center - Room 1D" and owned by "Veeva Admin". The "Upcoming Events (30 Days)" section shows a count of "11". The "Percentage of Budget Utilized" section displays a horizontal bar chart showing budget names and their percentages utilized: Cholecap East 2021 (20%), Cholecap National 2021 (43%), Cholecap West 2021 (28%), US South 2021 (15%), and US West 2021 (4%). The dashboard also displays an "Event Type Comparison" donut chart. The center shows '138' events, where '130' (94.2%) are of the speaker program type. Another section shows an "Event Format Comparison" with a line graph comparing 'In Person', 'Virtual', and 'Hybrid' event formats across May, June, July, and August 2021. "Events Requiring Closeout" is a number '5', and "Events Pending Approval" are shown on the bottom right in a donut chart. The count in the center is 6, and the outer segments represent 'Brown, Amy', 'Events Approval', 'Jones, Sarah', 'Levine, April' and 'McBrearty, Krista'.