Case Metrics Dashboard

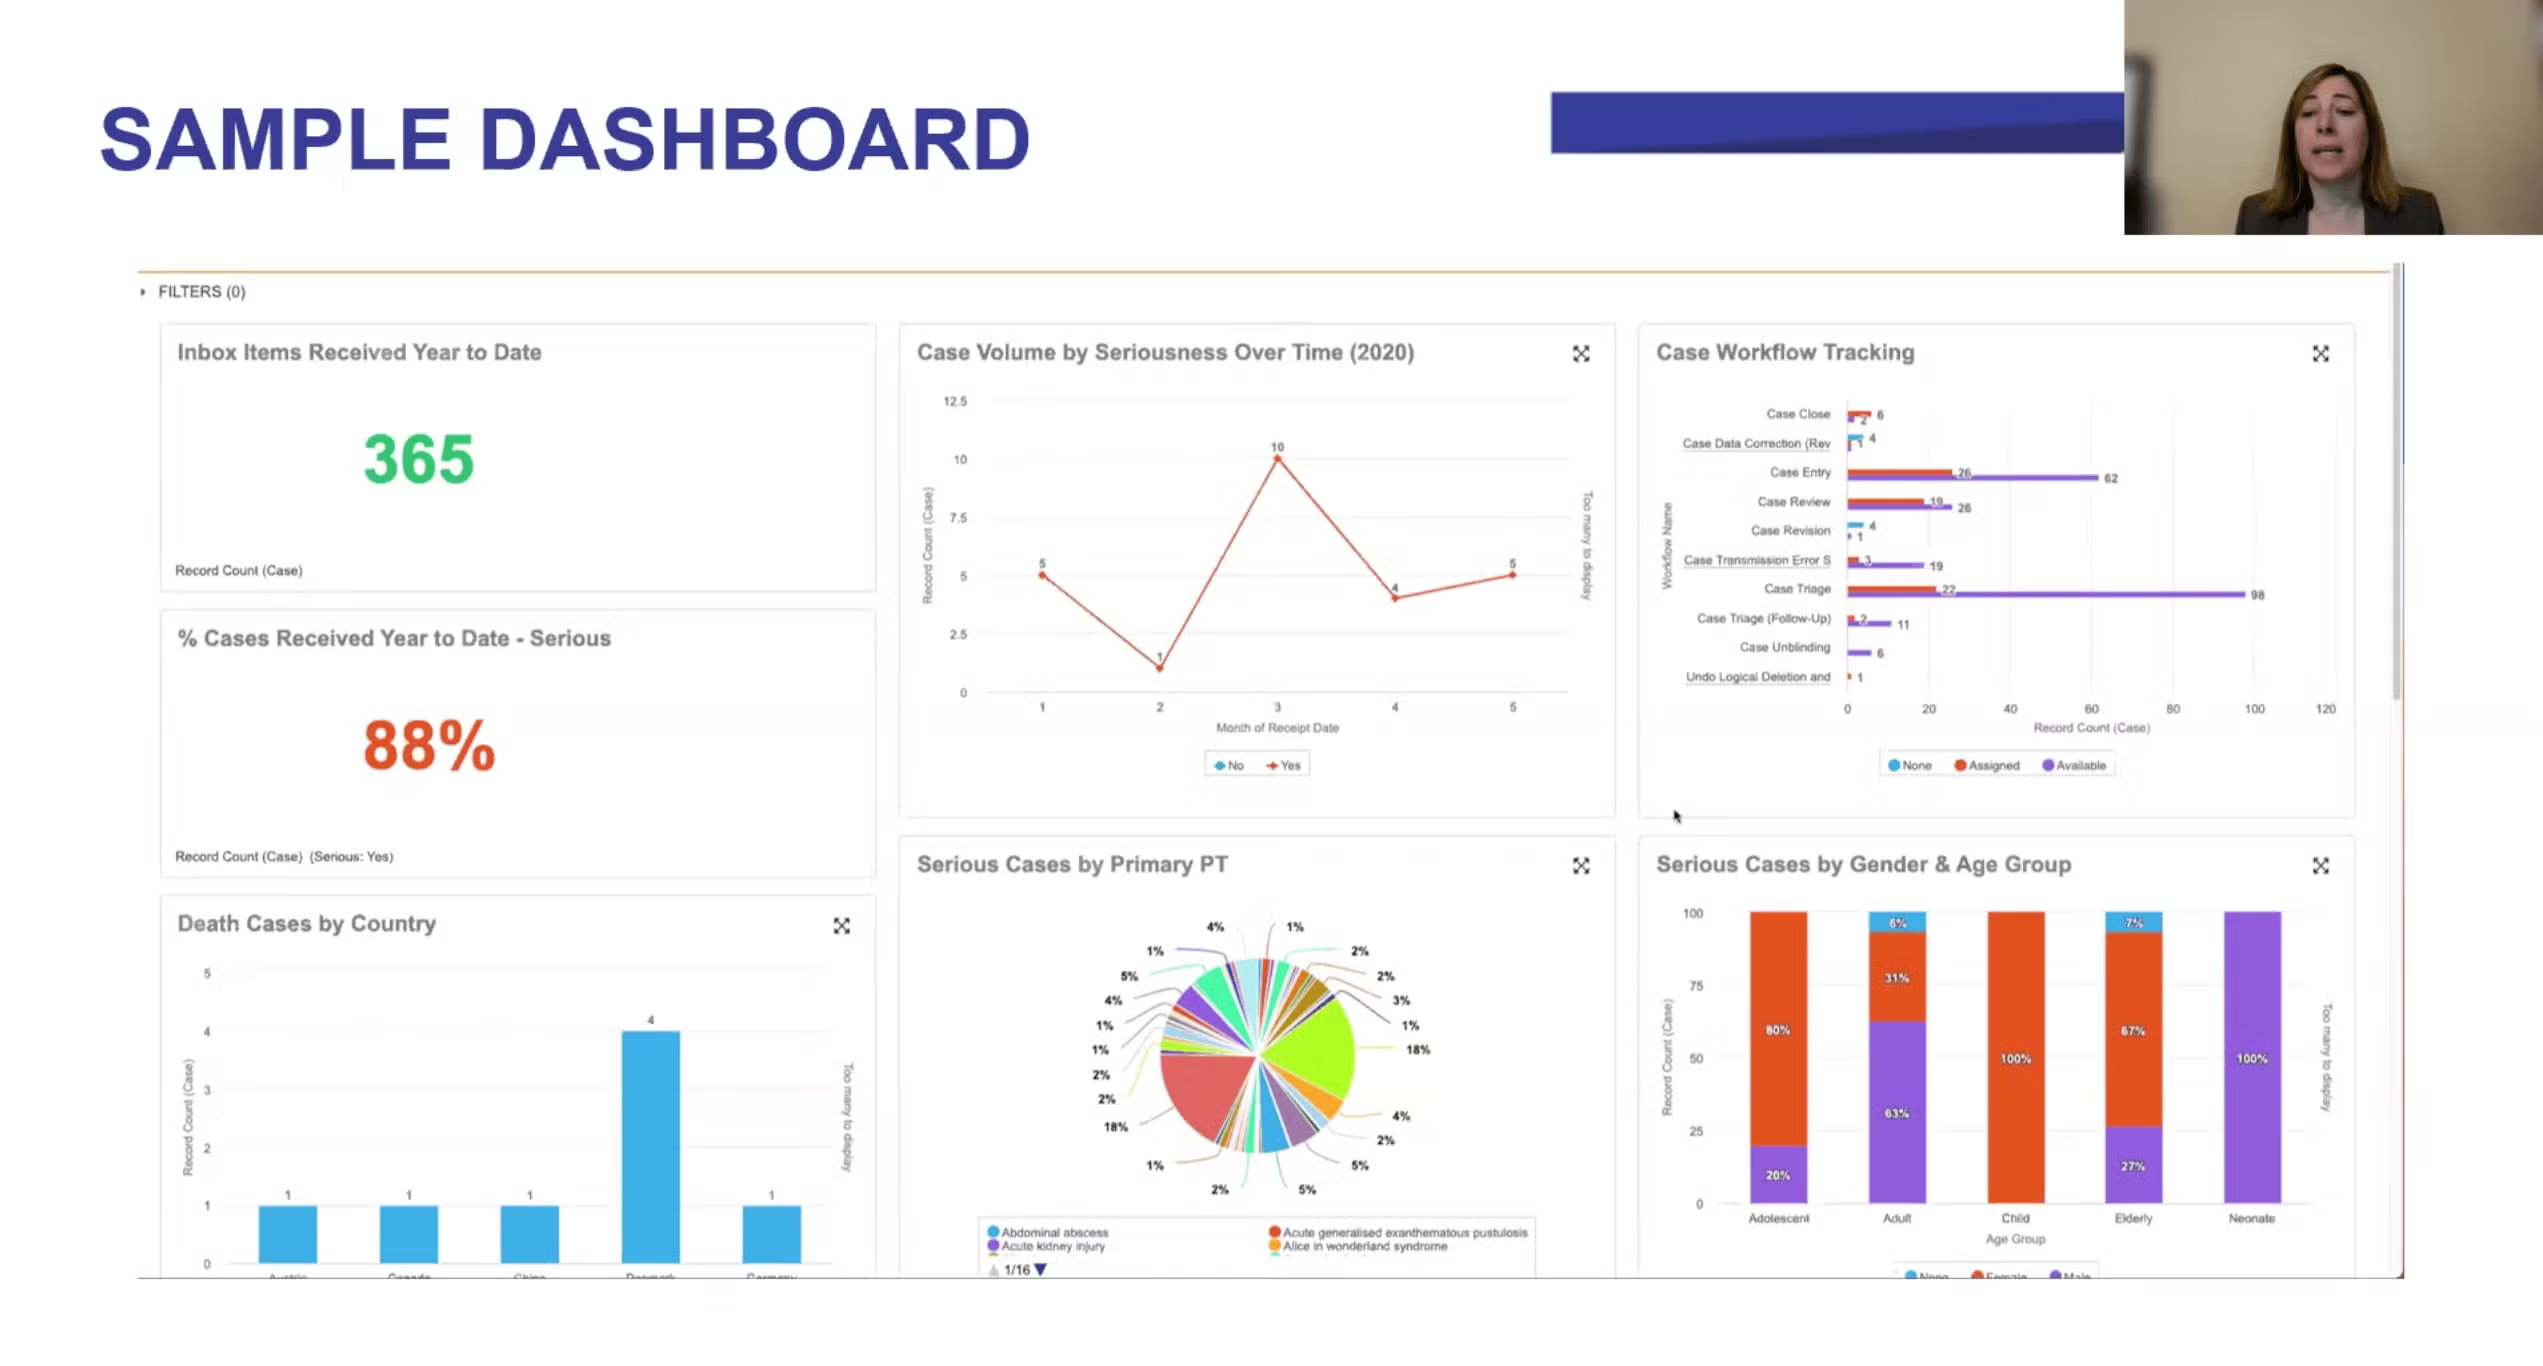
The screenshot presents a sample dashboard interface that visualizes and tracks various case metrics. The dashboard is divided into several panels, each providing a specific analysis. The "Inbox Items Received Year to Date" panel shows a count of 365 cases. The "% Cases Received Year to Date - Serious" panel displays 88%. The "Case Volume by Seriousness Over Time (2020)" panel plots case volume against the month of receipt date. The line graph displays case volume for both 'no' and 'yes' seriousness indicators over a period of five months. A bar chart titled "Death Cases by Country" displays case counts for several countries. The "Case Workflow Tracking" panel presents a horizontal bar chart depicting workflow names and record counts for 'None', 'Assigned', and 'Available' categories. Workflow names include Case Close, Case Data Correction (Rev), Case Entry, Case Review, Case Revision, Case Transmission Error S, Case Triage, Case Triage (Follow-Up), Case Unblinding, and Undo Logical Deletion. A pie chart titled "Serious Cases by Primary PT" displays percentages for various primary conditions or factors. Finally, the panel titled "Serious Cases by Gender & Age Group" displays a clustered bar graph with percentages for different age groups (Adolescent, Adult, Child, Elderly, and Neonate) differentiated by gender.