
Call Activity Dashboard
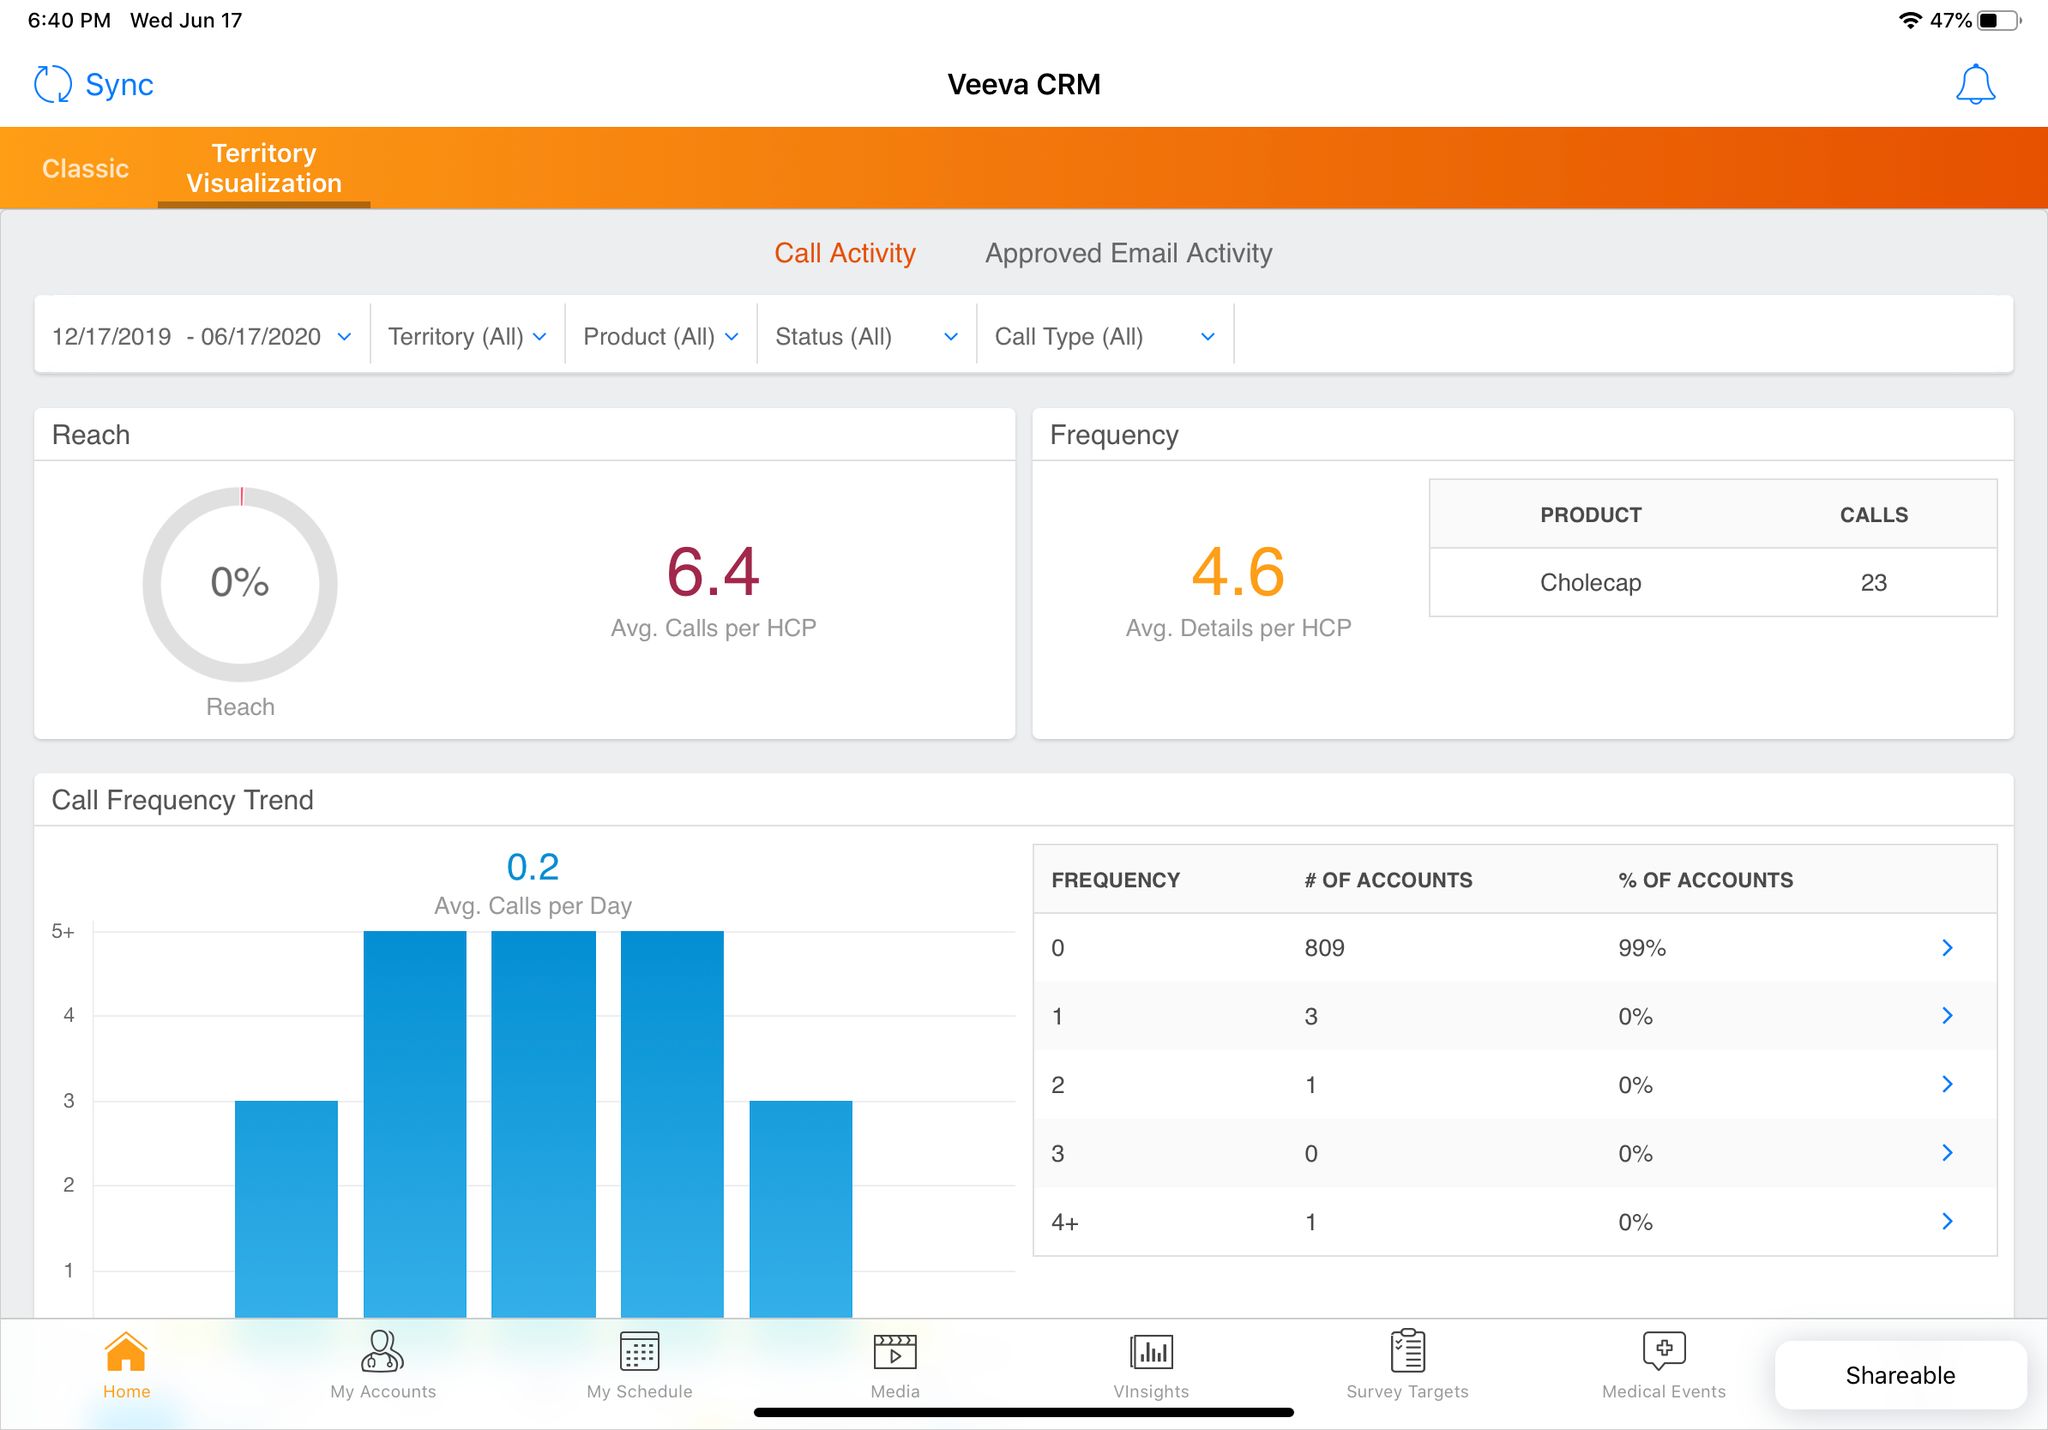
The screenshot shows a 'Call Activity' dashboard within the Veeva CRM application. The dashboard visualizes key call metrics, including reach, frequency, and call trends, over a period of '12/17/2019 - 06/17/2020'. A 'Reach' chart indicates 0% reach. 'Avg. Calls per HCP' is displayed as 6.4. The frequency section shows an 'Avg. Details per HCP' of 4.6. A product-specific call count is shown, with 'Cholecap' having 23 calls. The 'Call Frequency Trend' is represented by a bar chart, with the average calls per day being 0.2. The X axis shows the time-line, and the y axis shows the number of calls. A frequency table provides a breakdown of call frequency versus the number of accounts and percentage of accounts. For example, a frequency of 0 has 809 accounts, representing 99% of accounts. At the bottom, a navigation bar is visible with icons for 'Home', 'My Accounts', 'My Schedule', 'Media', 'VInsights', 'Survey Targets', 'Medical Events', and 'Shareable'. The dashboard also has drop-down filters for Territory, Product, Status, and Call Type, each set to 'All'.