
Territory Feedback
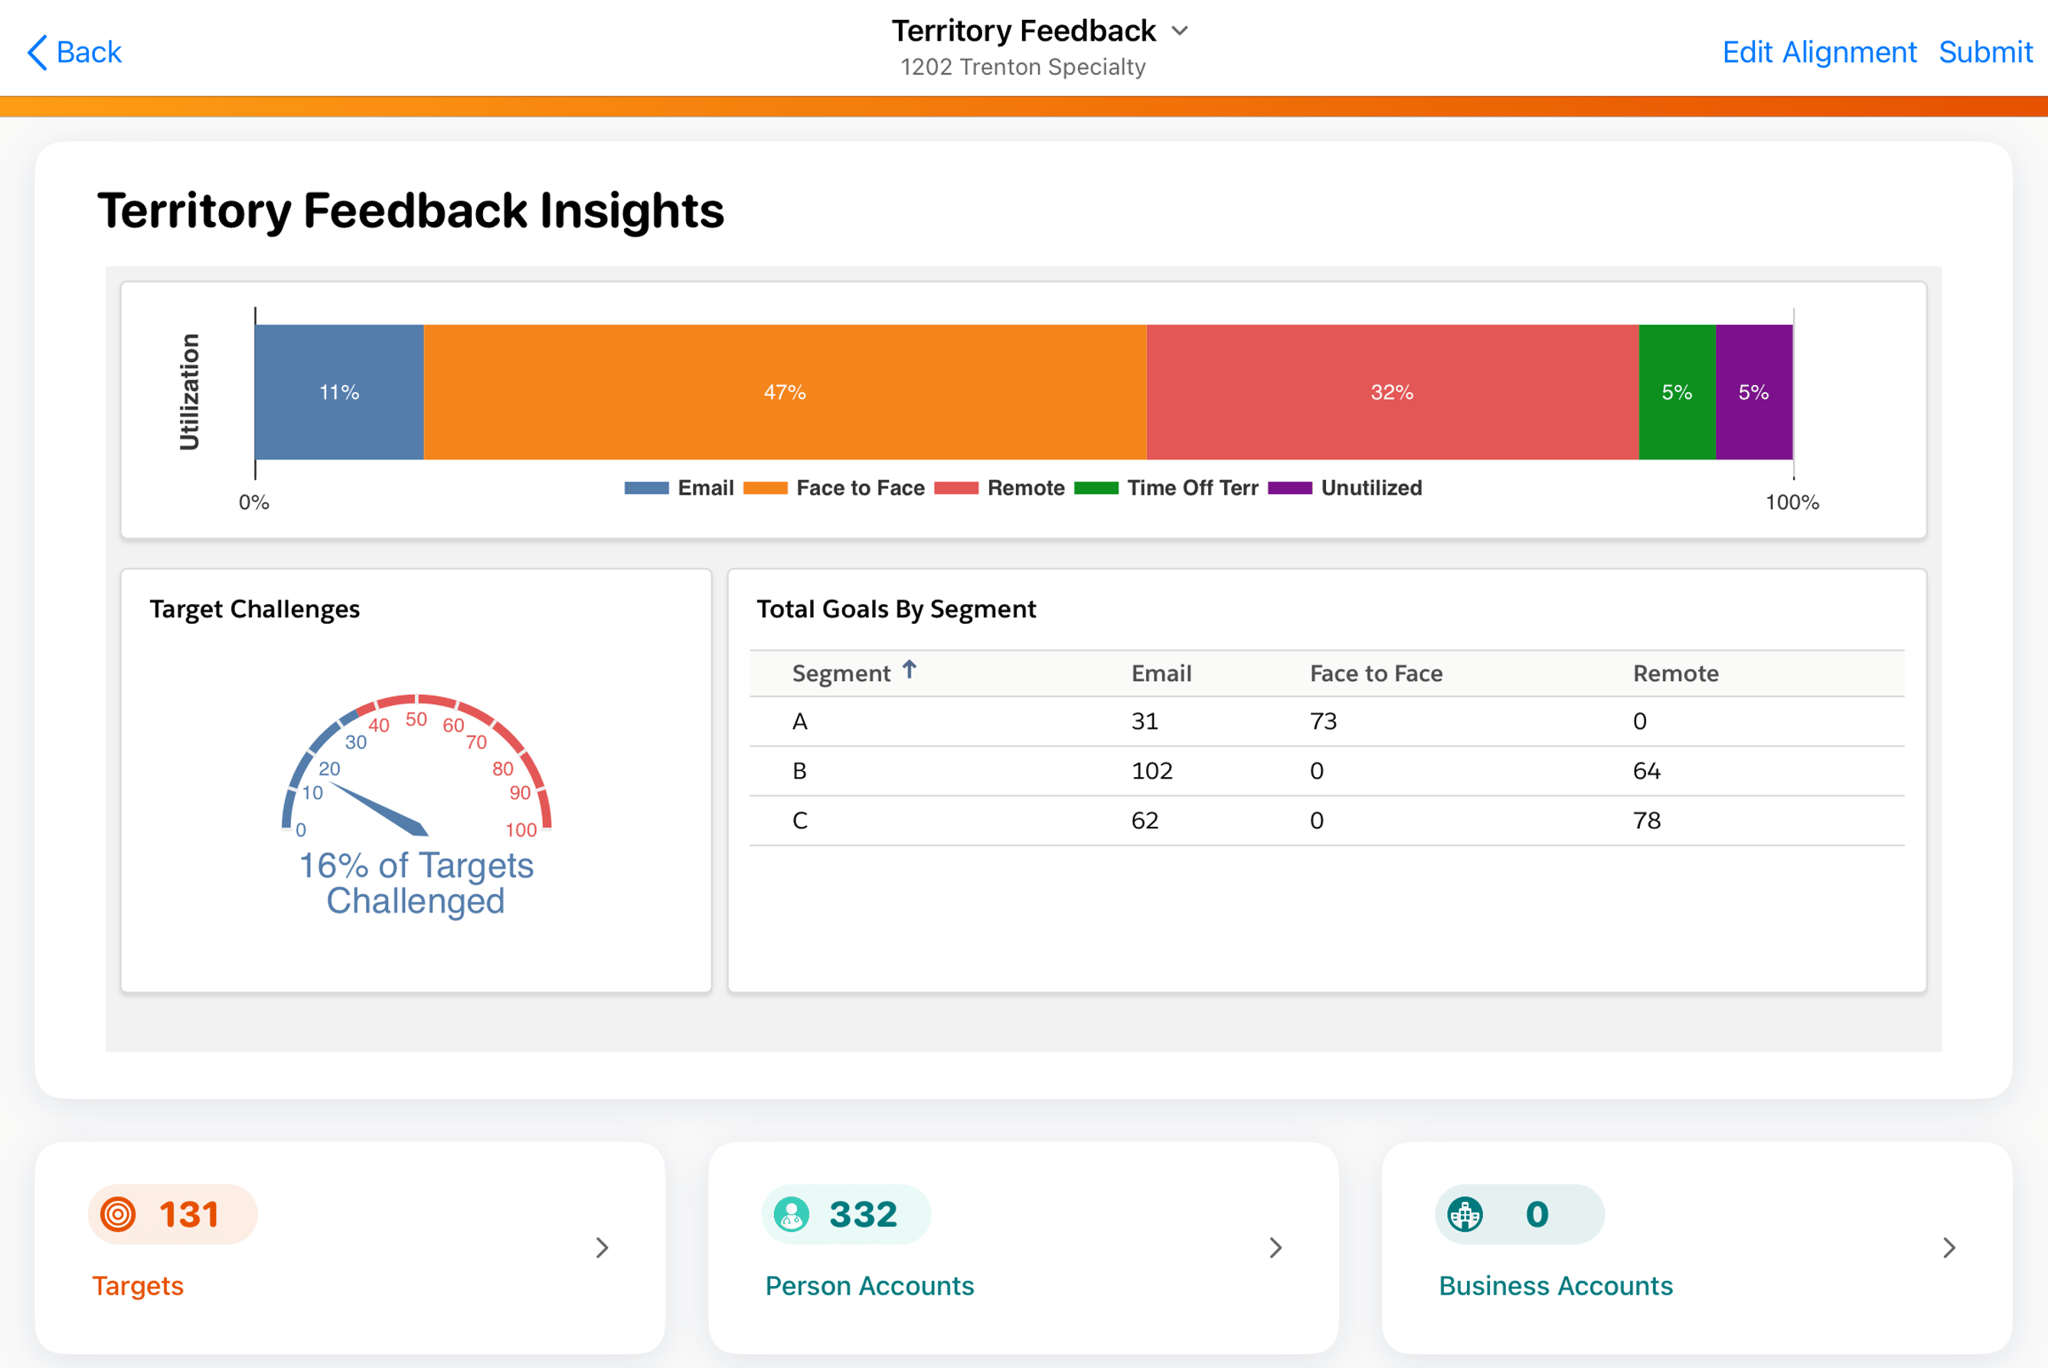
The screenshot presents a dashboard displaying territory feedback insights. At the top, the title "Territory Feedback" is visible, along with "1202 Trenton Specialty". The dashboard is segmented into several key areas. A horizontal bar graph depicts "Utilization" percentages: 11% Email, 47% Face to Face, 32% Remote, 5% Time Off Terr, and 5% Unutilized. Below this is a section labeled "Target Challenges", featuring a gauge indicating that 16% of targets are challenged. A table titled "Total Goals By Segment" breaks down goals by segment (A, B, C) across Email, Face to Face, and Remote categories. Segment A shows 31 emails, 73 face-to-face interactions, and 0 remote interactions. Segment B shows 102 emails, 0 face-to-face interactions, and 64 remote interactions. Segment C shows 62 emails, 0 face-to-face interactions, and 78 remote interactions. Three rectangular cards appear at the bottom, displaying key metrics: 131 Targets, 332 Person Accounts, and 0 Business Accounts. Each card has a right-pointing arrow, indicating that these sections can be expanded.