
PivotCX Dashboard
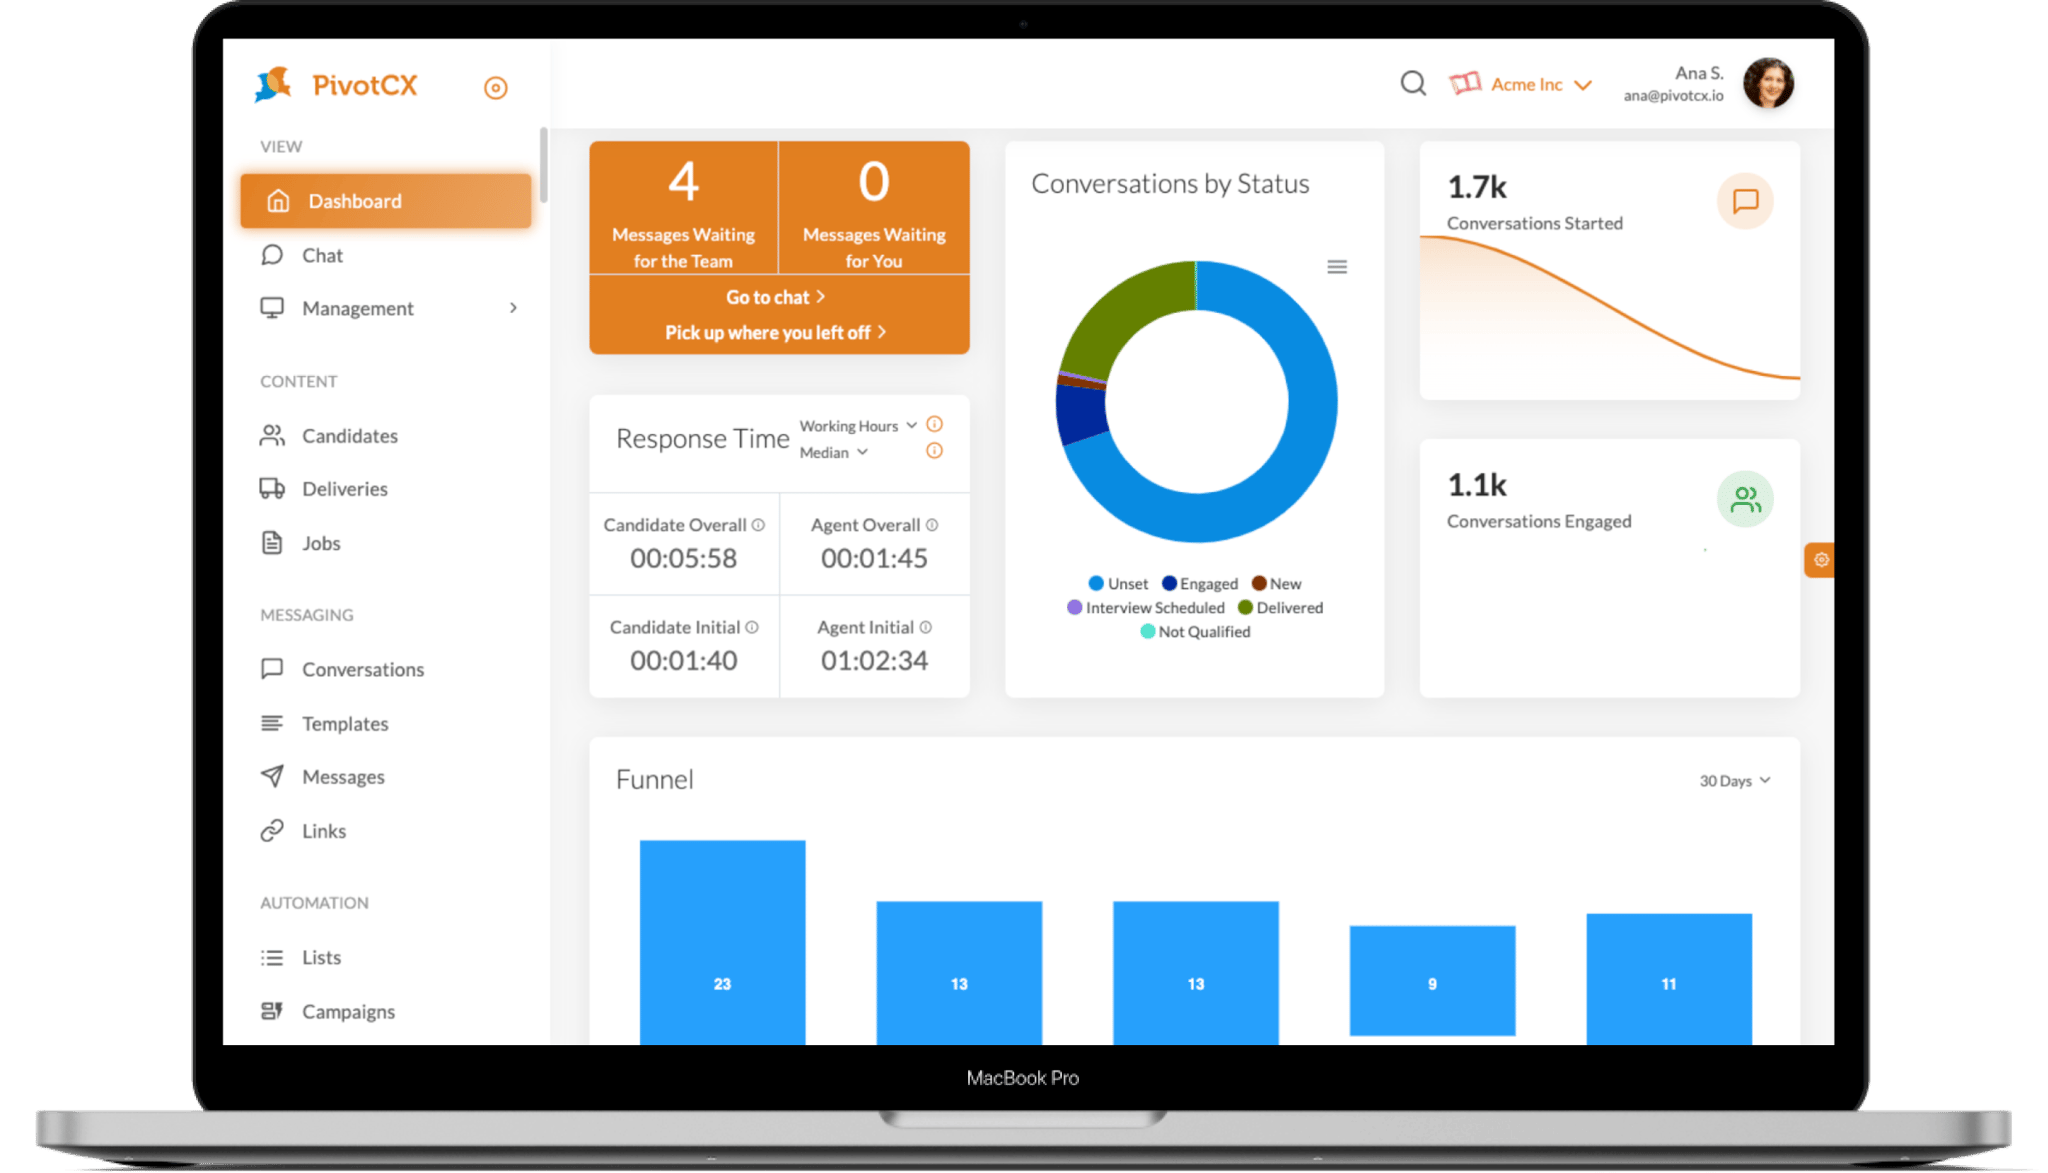
The dashboard presents a high-level overview of PivotCX. It shows several key metrics, including message statistics, response times, conversation status, and funnel data. On the left-hand navigation are options such as 'Dashboard,' 'Chat,' 'Management,' 'Candidates,' 'Deliveries,' 'Jobs,' 'Conversations,' 'Templates,' 'Messages,' 'Links,' 'Lists,' and 'Campaigns.' The dashboard displays '4 Messages Waiting for the Team' and '0 Messages Waiting for You,' along with buttons labeled 'Go to chat >' and 'Pick up where you left off >'. Below this, 'Response Time' is displayed, showing metrics for 'Candidate Overall' (00:05:58), 'Agent Overall' (00:01:45), 'Candidate Initial' (00:01:40), and 'Agent Initial' (01:02:34). A donut chart titled 'Conversations by Status' categorizes conversations into 'Unset,' 'Engaged,' 'New,' 'Interview Scheduled,' 'Delivered,' and 'Not Qualified.' The right side presents '1.7k Conversations Started' with a trending graph, and '1.1k Conversations Engaged.' A 'Funnel' bar chart shows values of 23, 13, 13, 9 and 11, presumably for stages within the funnel. The user interface also includes a search bar, the organization 'Acme Inc,' and user information: 'Ana S., [email protected]'.