
Journey Insights
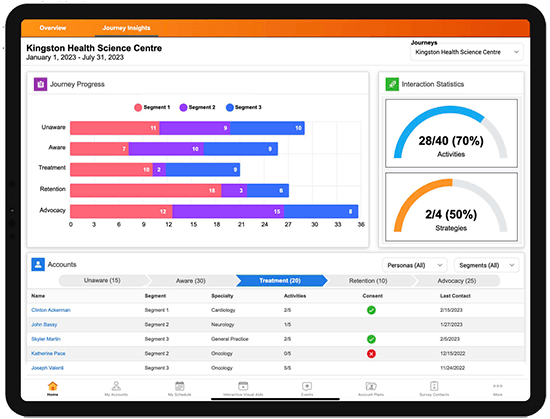
The screenshot displays the 'Journey Insights' dashboard for the Kingston Health Science Centre, covering the period from January 1, 2023, to July 31, 2023. The dashboard is structured into several sections, providing insights into patient journeys. The 'Journey Progress' section uses a horizontal bar chart to visualize the distribution of patients across different stages: 'Unaware', 'Aware', 'Treatment', 'Retention', and 'Advocacy'. Each stage is further segmented into three categories. For example, the 'Unaware' stage has values of 11, 9, and 10 for segment 1, segment 2, and segment 3 respectively. The 'Interaction Statistics' section presents two key metrics: 'Activities' (28/40, 70%) and 'Strategies' (2/4, 50%), displayed with percentage completion gauges. The 'Accounts' section lists patients and their attributes across different journey stages, including 'Unaware' (15 accounts), 'Aware' (30 accounts), 'Treatment' (20 accounts), 'Retention' (10 accounts), and 'Advocacy' (25 accounts). This section includes columns for 'Name', 'Segment', 'Specialty', 'Activities', 'Consent', and 'Last Contact'. Consent is visually indicated with a green check mark or a red 'X'. The dashboard offers filtering options for 'Personas' and 'Segments', allowing users to refine the data displayed.