
Territory Management Dashboard
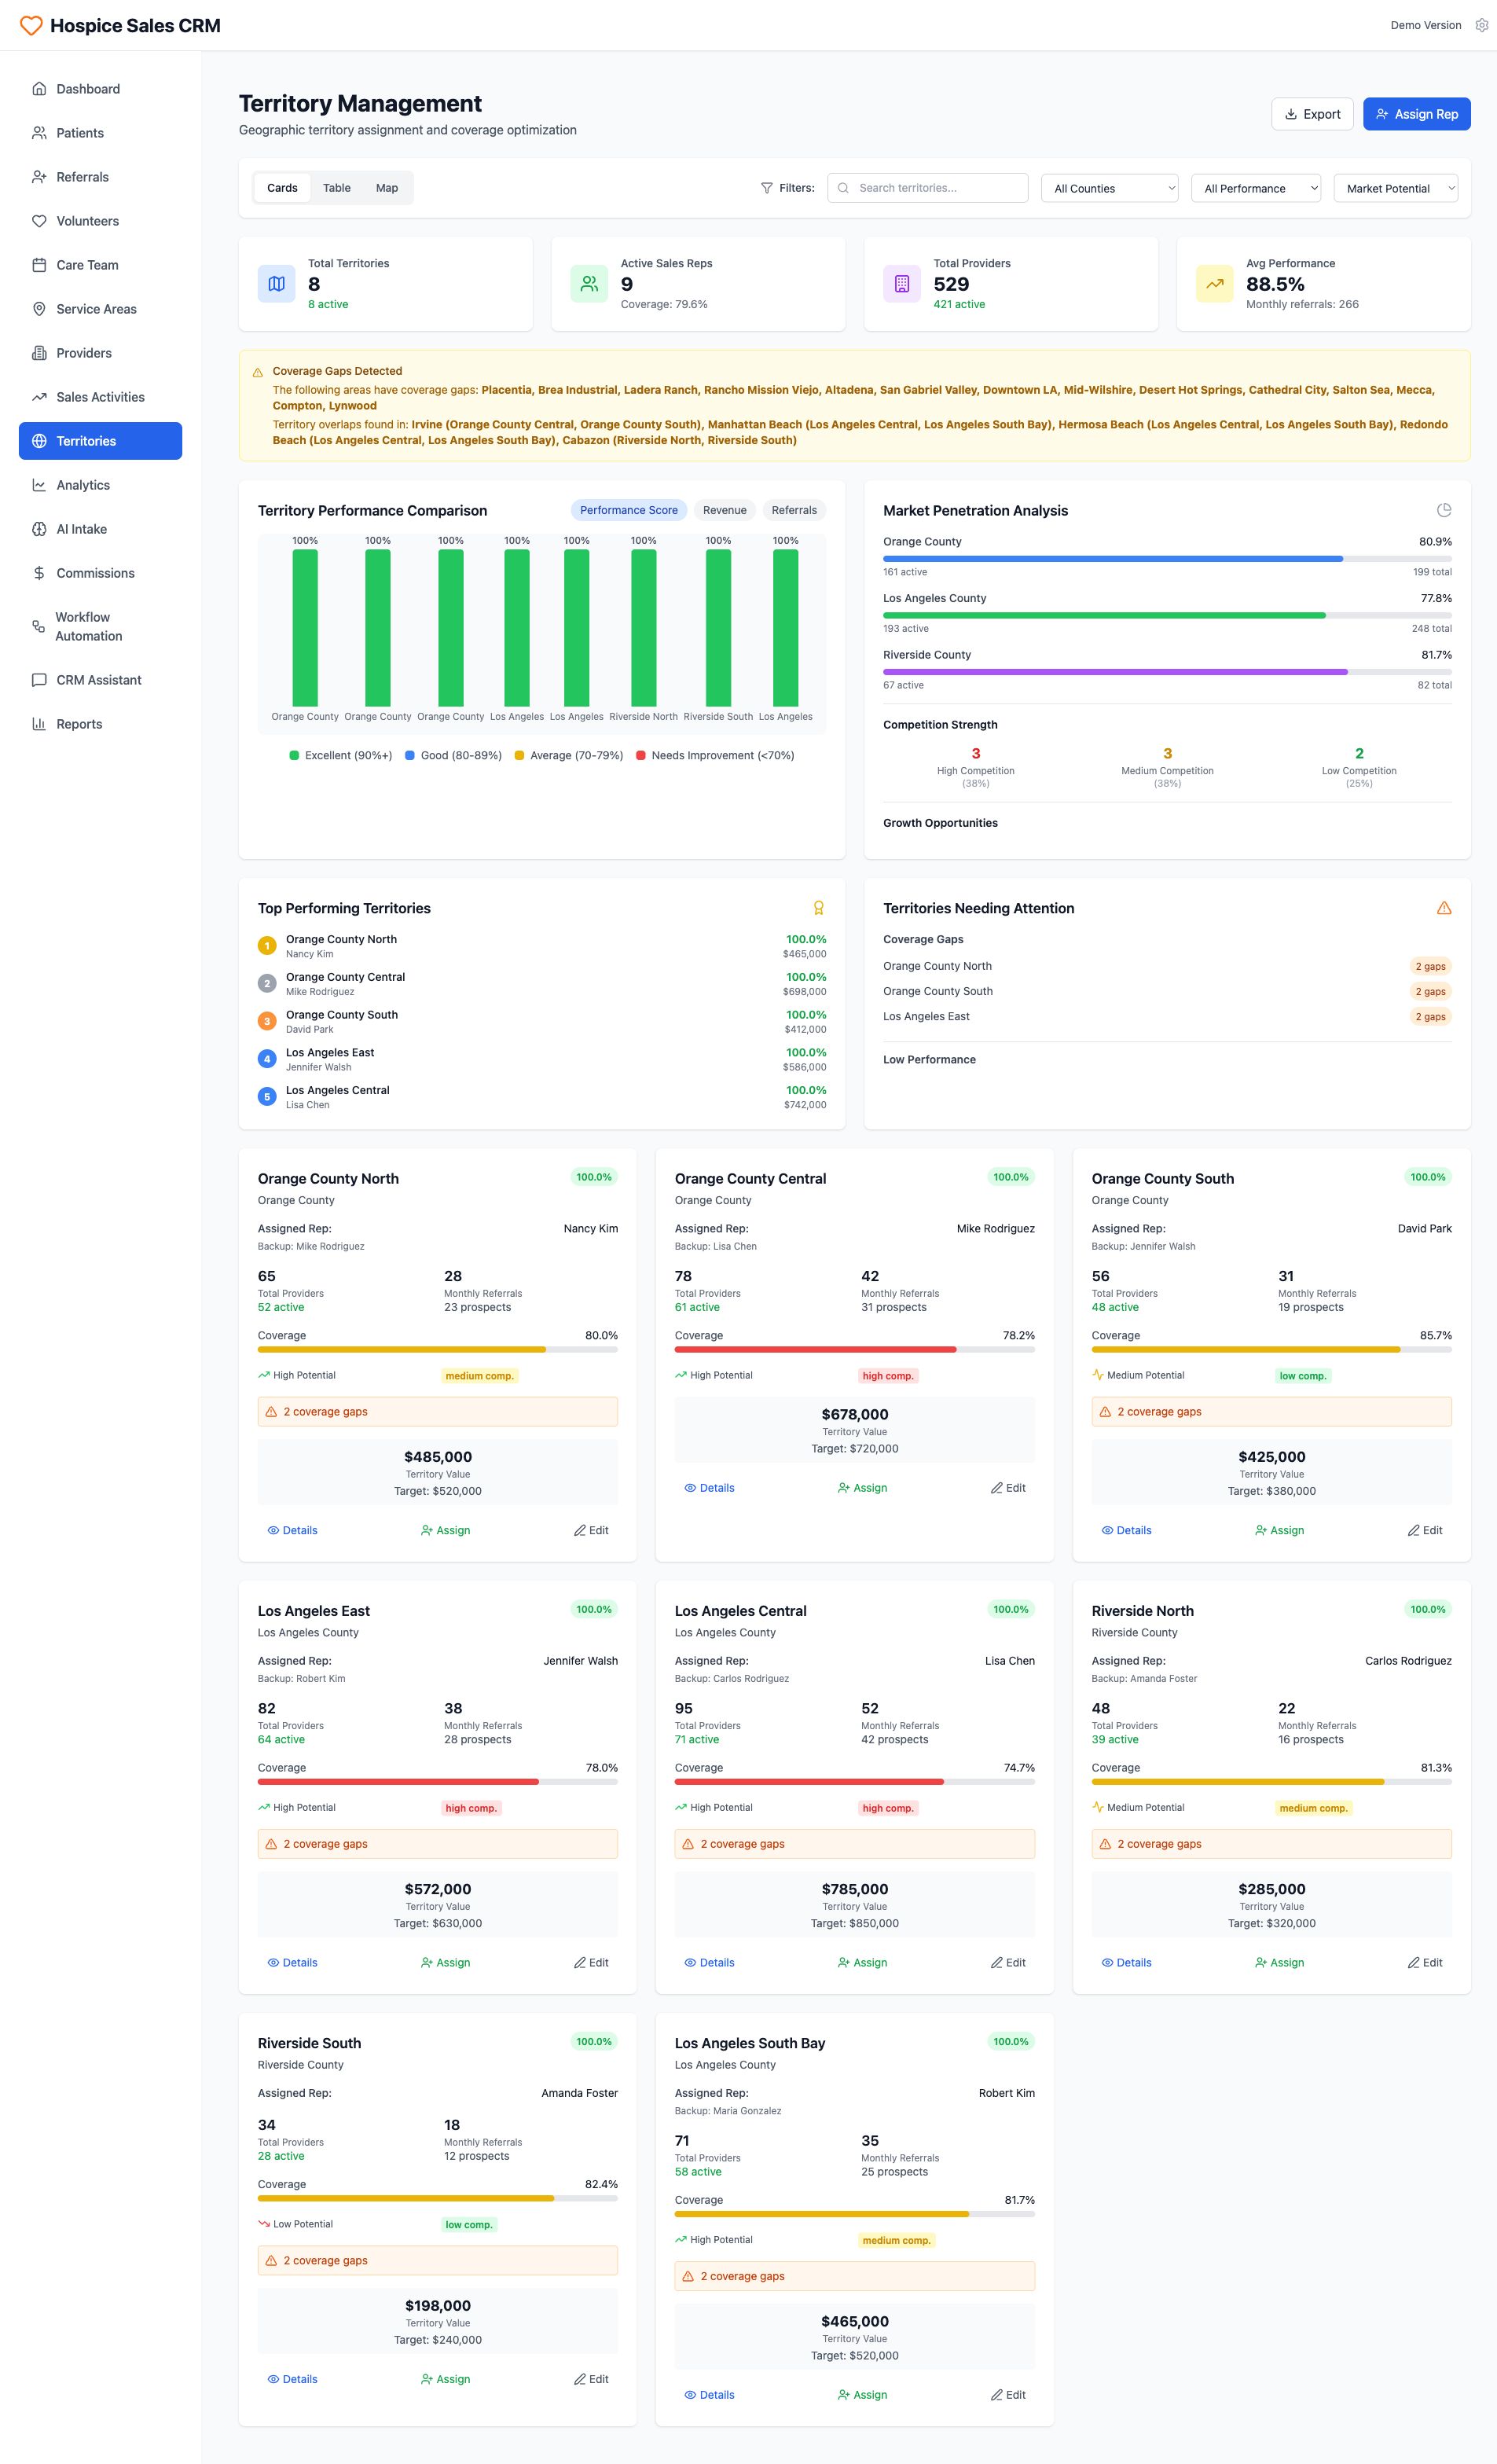
The interface presents a comprehensive 'Territory Management' dashboard, designed for geographic territory assignment and coverage optimization within a Hospice Sales CRM. A left-hand navigation pane features core modules such as Dashboard, Patients, Referrals, Volunteers, Care Team, Service Areas, Providers, Sales Activities, Territories (currently active), Analytics, AI Intake, Commissions, Workflow Automation, CRM Assistant, and Reports. The main content area is structured with interactive filters at the top for searching territories, selecting counties, performance levels, and market potential, alongside 'Export' and 'Assign Rep' buttons. Four summary cards highlight key metrics: 'Total Territories' (8 total, 8 active), 'Active Sales Reps' (9, with 79.6% coverage), 'Total Providers' (529 total, 421 active), and 'Avg Performance' (88.5%, with 266 monthly referrals). A prominent yellow alert box indicates 'Coverage Gaps Detected' in specific geographical areas and identifies 'Territory overlaps' in other regions, listing distinct locations for each. Two analytical sections, 'Territory Performance Comparison' and 'Market Penetration Analysis', provide visual insights; the former displays a bar chart of 'Performance Score' for various territories, with all shown at 100%, while the latter details market penetration percentages for Orange County (80.9%), Los Angeles County (77.8%), and Riverside County (81.7%), and breaks down 'Competition Strength' into High (38%), Medium (38%), and Low (25%) categories. 'Top Performing Territories' lists the top five territories with their assigned reps, coverage, and territory values, such as Orange County North at 100.0% performance. Conversely, 'Territories Needing Attention' highlights 'Coverage Gaps' for several territories, with each showing '2 gaps'. Below these summary sections, a grid of individual territory cards provides detailed information for eight territories including Orange County North, Orange County Central, Orange County South, Los Angeles East, Los Angeles Central, Riverside North, Riverside South, and Los Angeles South Bay. Each card specifies the assigned rep and backup, total and active providers, monthly referrals and prospects, coverage percentage with a progress bar, potential and competition levels, an alert for '2 coverage gaps', current 'Territory Value' versus 'Target', and interactive 'Details', 'Assign', and 'Edit' buttons.