
CRM Dashboard Overview
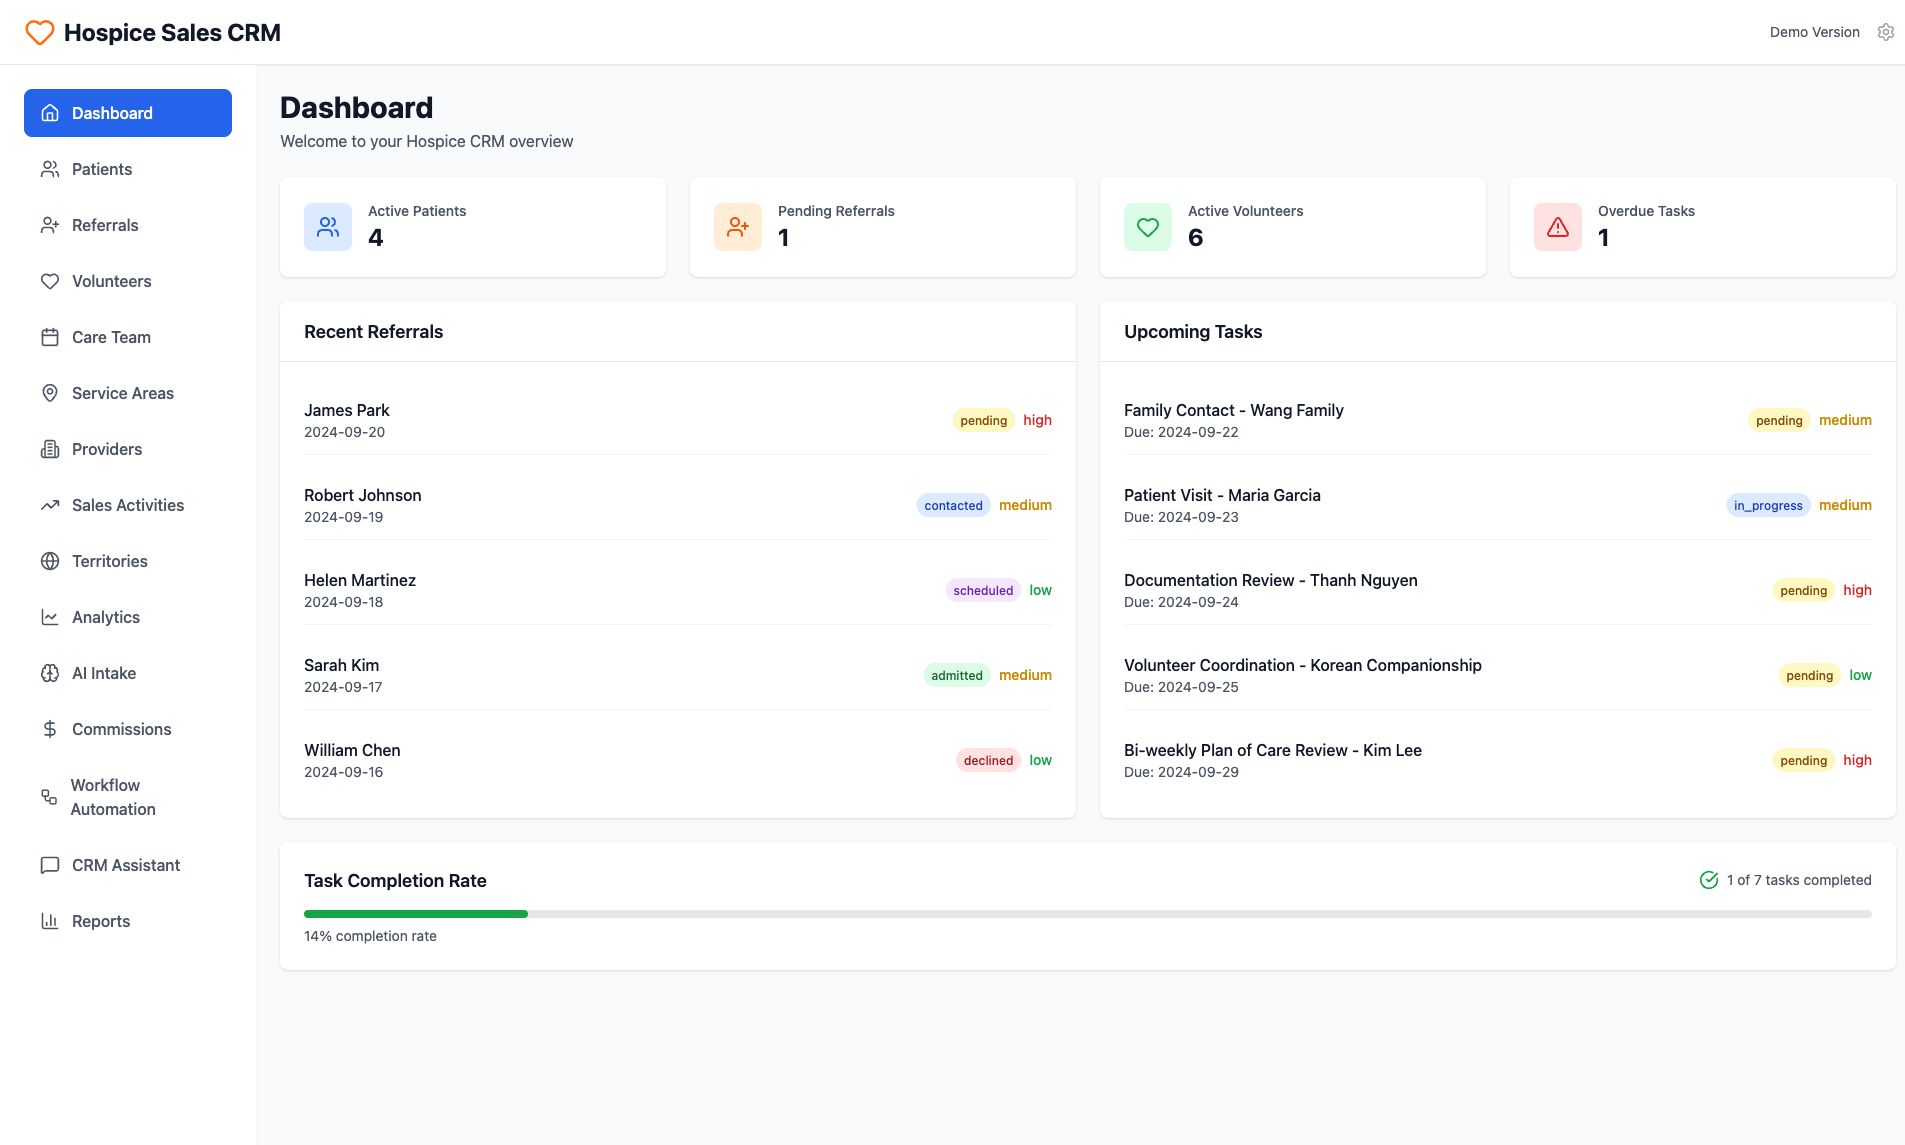
The interface presents a comprehensive dashboard for a Hospice Sales CRM, featuring a clean, organized layout with a left-hand navigation sidebar and a primary content area. The top left corner displays the "Hospice Sales CRM" branding with a heart icon, while the top right includes a "Demo Version" label and a settings gear icon. The left navigation pane, currently highlighting "Dashboard" in blue, lists numerous sections such as Patients, Referrals, Volunteers, Care Team, Service Areas, Providers, Sales Activities, Territories, Analytics, AI Intake, Commissions, Workflow Automation, CRM Assistant, and Reports, each accompanied by a distinct icon. The main dashboard content welcomes the user with "Welcome to your Hospice CRM overview" under the "Dashboard" header. Immediately below, four prominent cards present key performance indicators: "Active Patients" shows a count of 4, "Pending Referrals" indicates 1, "Active Volunteers" totals 6, and "Overdue Tasks" alerts to 1 item, marked with a red warning triangle. Two primary sections organize operational data below these metrics. The "Recent Referrals" panel lists five entries, each with a name (e.g., James Park), a date (e.g., 2024-09-20), and dual color-coded status tags. Examples include "pending" (yellow) and "high" (red), "contacted" (purple) and "medium" (orange), "scheduled" (pink) and "low" (green), "admitted" (light green) and "medium" (orange), and "declined" (red) and "low" (green). Adjacent to this, the "Upcoming Tasks" panel presents five scheduled items. Each task, such as "Family Contact - Wang Family" or "Patient Visit - Maria Garcia", includes a "Due" date (e.g., 2024-09-22) and similar dual status/priority tags like "pending" (yellow) and "medium" (orange), "in_progress" (blue) and "medium" (orange), "pending" (yellow) and "high" (red), or "pending" (yellow) and "low" (green). The final section, "Task Completion Rate," features a horizontal progress bar filled 14% with green, alongside the text "14% completion rate." A distinct indicator to the right confirms "1 of 7 tasks completed" with a green checkmark. This dashboard provides a consolidated operational overview, enabling users to monitor critical metrics, track recent activities, and manage upcoming tasks efficiently with clear visual cues for status and priority.