
CRM Reports Analytics
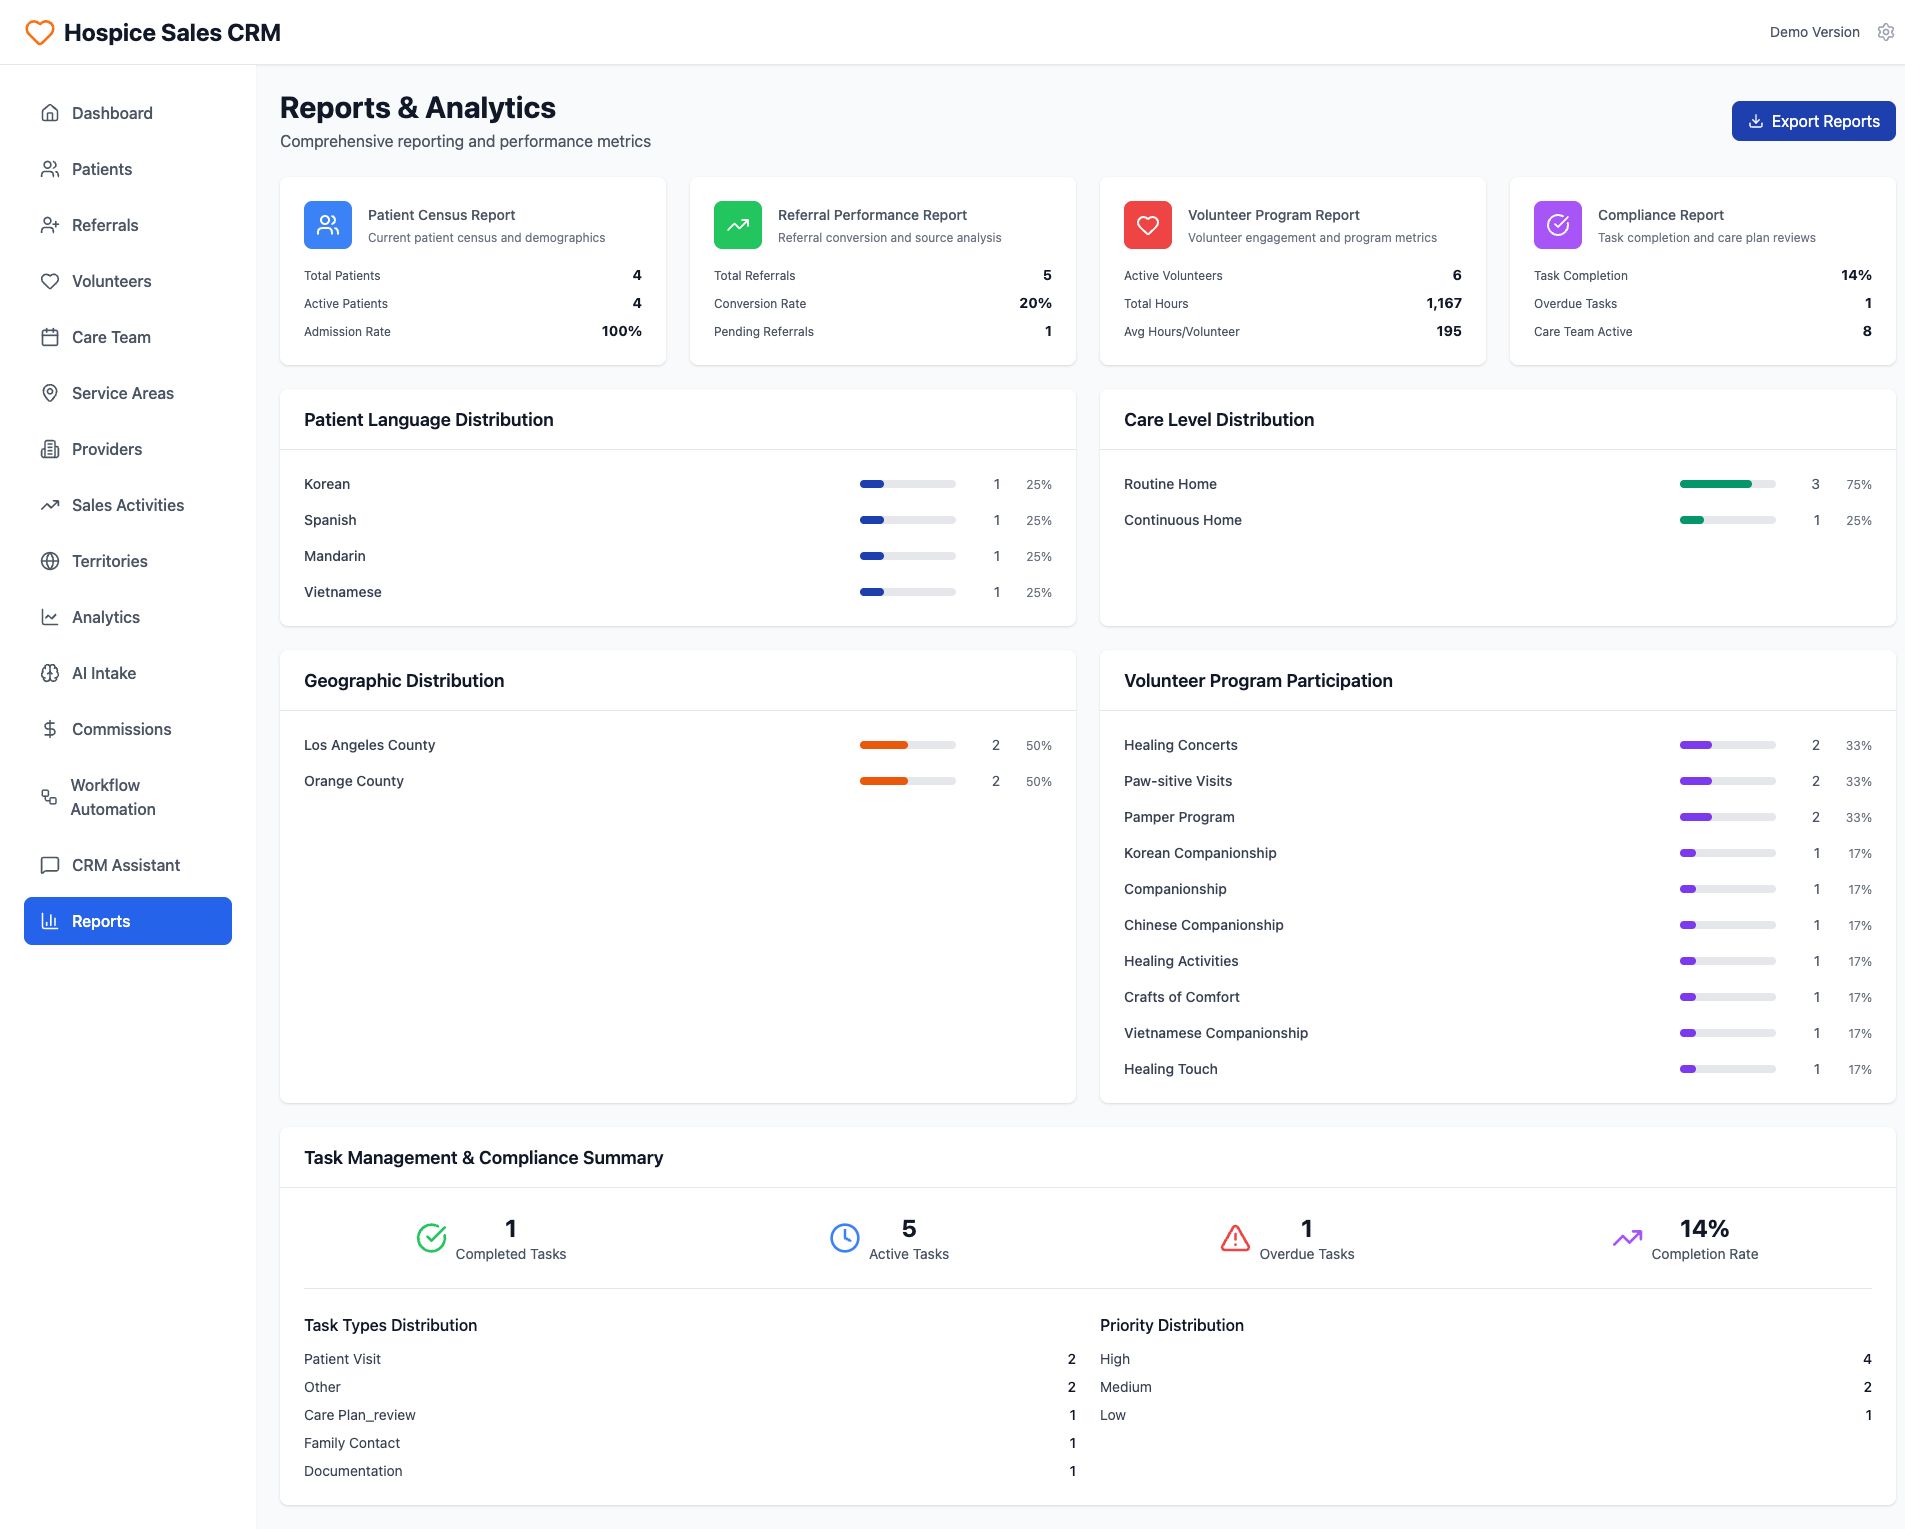
The interface presents a detailed 'Reports & Analytics' dashboard within a 'Hospice Sales CRM' system, designed for comprehensive reporting and performance metrics. A persistent left sidebar navigation menu features modules such as 'Dashboard', 'Patients', 'Referrals', 'Volunteers', 'Care Team', 'Service Areas', 'Providers', 'Sales Activities', 'Territories', 'Analytics', 'AI Intake', 'Commissions', 'Workflow Automation', 'CRM Assistant', and 'Reports', with 'Reports' currently highlighted. The main content area begins with a header displaying 'Reports & Analytics' and a subheading 'Comprehensive reporting and performance metrics', alongside an 'Export Reports' button, a 'Demo Version' indicator, and a settings icon in the top right corner. The primary view is organized into multiple cards and distribution charts. Four key performance indicator cards are visible at the top: 'Patient Census Report' shows 4 Total Patients, 4 Active Patients, and a 100% Admission Rate; 'Referral Performance Report' indicates 5 Total Referrals, a 20% Conversion Rate, and 1 Pending Referrals; 'Volunteer Program Report' displays 6 Active Volunteers, 1,167 Total Hours, and 195 Avg Hours/Volunteer; and 'Compliance Report' details a 14% Task Completion rate, 1 Overdue Tasks, and 8 Active Care Team members. Further down, several horizontal bar charts illustrate various distributions. 'Patient Language Distribution' highlights Korean (1, 25%), Spanish (1, 25%), Mandarin (1, 25%), and Vietnamese (1, 25%) patients. 'Care Level Distribution' shows Routine Home (3, 75%) and Continuous Home (1, 25%). 'Geographic Distribution' covers Los Angeles County (2, 50%) and Orange County (2, 50%). 'Volunteer Program Participation' enumerates categories such as Healing Concerts (2, 33%), Paw-sitive Visits (2, 33%), Pamper Program (2, 33%), and several other companionship and activity-based programs, each with 1 participant (17%). The bottom section, 'Task Management & Compliance Summary', provides an overview of task statuses. It presents four summary metrics: 1 Completed Tasks, 5 Active Tasks, 1 Overdue Tasks, and a 14% Completion Rate. Below these summaries, 'Task Types Distribution' lists Patient Visit, Other, Care Plan_review, Family Contact, and Documentation. Adjacent to this, 'Priority Distribution' categorizes tasks as High (4), Medium (2), and Low (1). The dashboard effectively uses icons, color-coded bar charts, and clear numerical values to convey complex operational data at a glance, facilitating performance monitoring and strategic decision-making.