
Analytics Dashboard
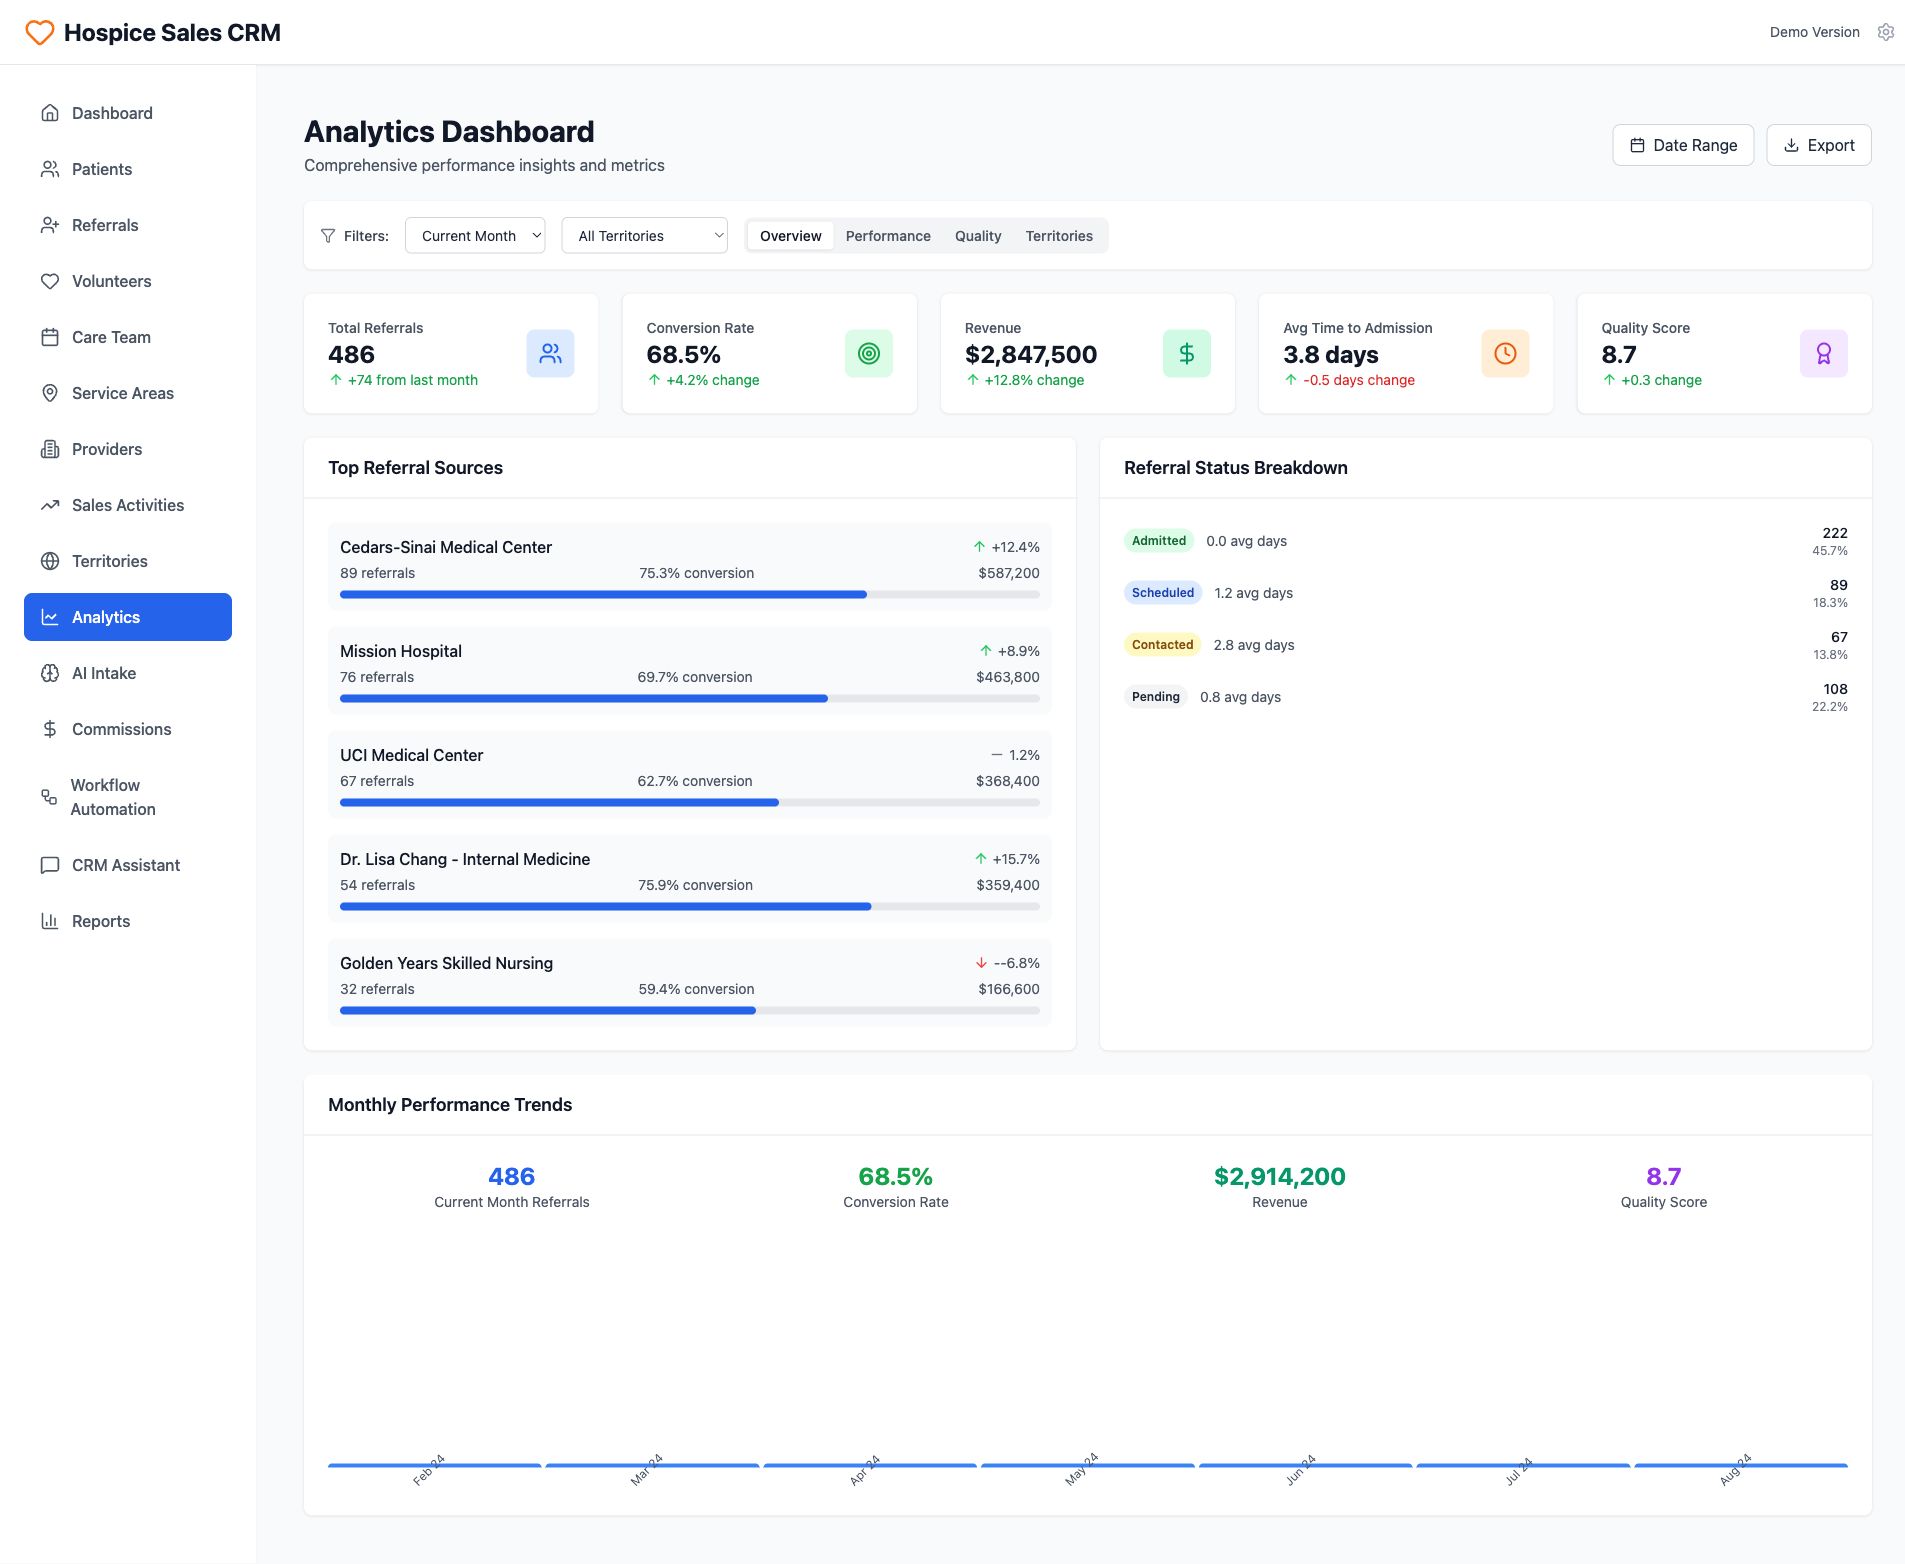
The interface presents a comprehensive 'Analytics Dashboard' within a 'Hospice Sales CRM' system, designed to provide performance insights and metrics. A left sidebar navigation panel features various modules including Dashboard, Patients, Referrals, Volunteers, Care Team, Service Areas, Providers, Sales Activities, Territories, Analytics (currently active and highlighted in blue), AI Intake, Commissions, Workflow Automation, CRM Assistant, and Reports. The main content area begins with the dashboard title and a subtitle indicating comprehensive performance insights. Users can refine the displayed data using 'Filters' dropdowns for 'Current Month' and 'All Territories,' alongside interactive tabs for 'Overview,' 'Performance,' 'Quality,' and 'Territories,' with 'Overview' being selected. Actionable buttons for 'Date Range' and 'Export' are present in the top right, while a 'Demo Version' indicator and a settings gear icon are visible in the global header. Five key performance indicator cards are prominently displayed: 'Total Referrals' showing 486, an increase of +74 from last month; 'Conversion Rate' at 68.5%, up +4.2%; 'Revenue' at $2,847,500, an increase of +12.8%; 'Avg Time to Admission' at 3.8 days, a decrease of -0.5 days; and 'Quality Score' at 8.7, up +0.3. Each metric includes a clear trend indicator with a specific value change. A 'Top Referral Sources' section lists five entities with their respective referral counts, conversion rates, and a visual progress bar indicating conversion. Specific data includes Cedars-Sinai Medical Center with 89 referrals and 75.3% conversion, showing a +12.4% change and $587,200 revenue; Mission Hospital with 76 referrals, 69.7% conversion, +8.9% change, and $463,800 revenue; UCI Medical Center with 67 referrals, 62.7% conversion, -1.2% change, and $368,400 revenue; Dr. Lisa Chang - Internal Medicine with 54 referrals, 75.9% conversion, +15.7% change, and $359,400 revenue; and Golden Years Skilled Nursing with 32 referrals, 59.4% conversion, -6.8% change, and $166,600 revenue. Adjacent to the referral sources, a 'Referral Status Breakdown' panel categorizes referrals by status: 'Admitted' (222 referrals, 45.7%, 0.0 avg days), 'Scheduled' (89 referrals, 18.3%, 1.2 avg days), 'Contacted' (67 referrals, 13.8%, 2.8 avg days), and 'Pending' (108 referrals, 22.2%, 0.8 avg days). Each status is clearly labeled with a distinctive colored tag. The dashboard concludes with a 'Monthly Performance Trends' section, presenting a line graph spanning from February '24 to August '24, indicating historical performance. Above the graph, four prominent metrics recap the current month's performance: 486 'Current Month Referrals,' 68.5% 'Conversion Rate,' $2,914,200 'Revenue,' and 8.7 'Quality Score,' offering a quick glance at key performance indicators over time.