
KPI Comparison
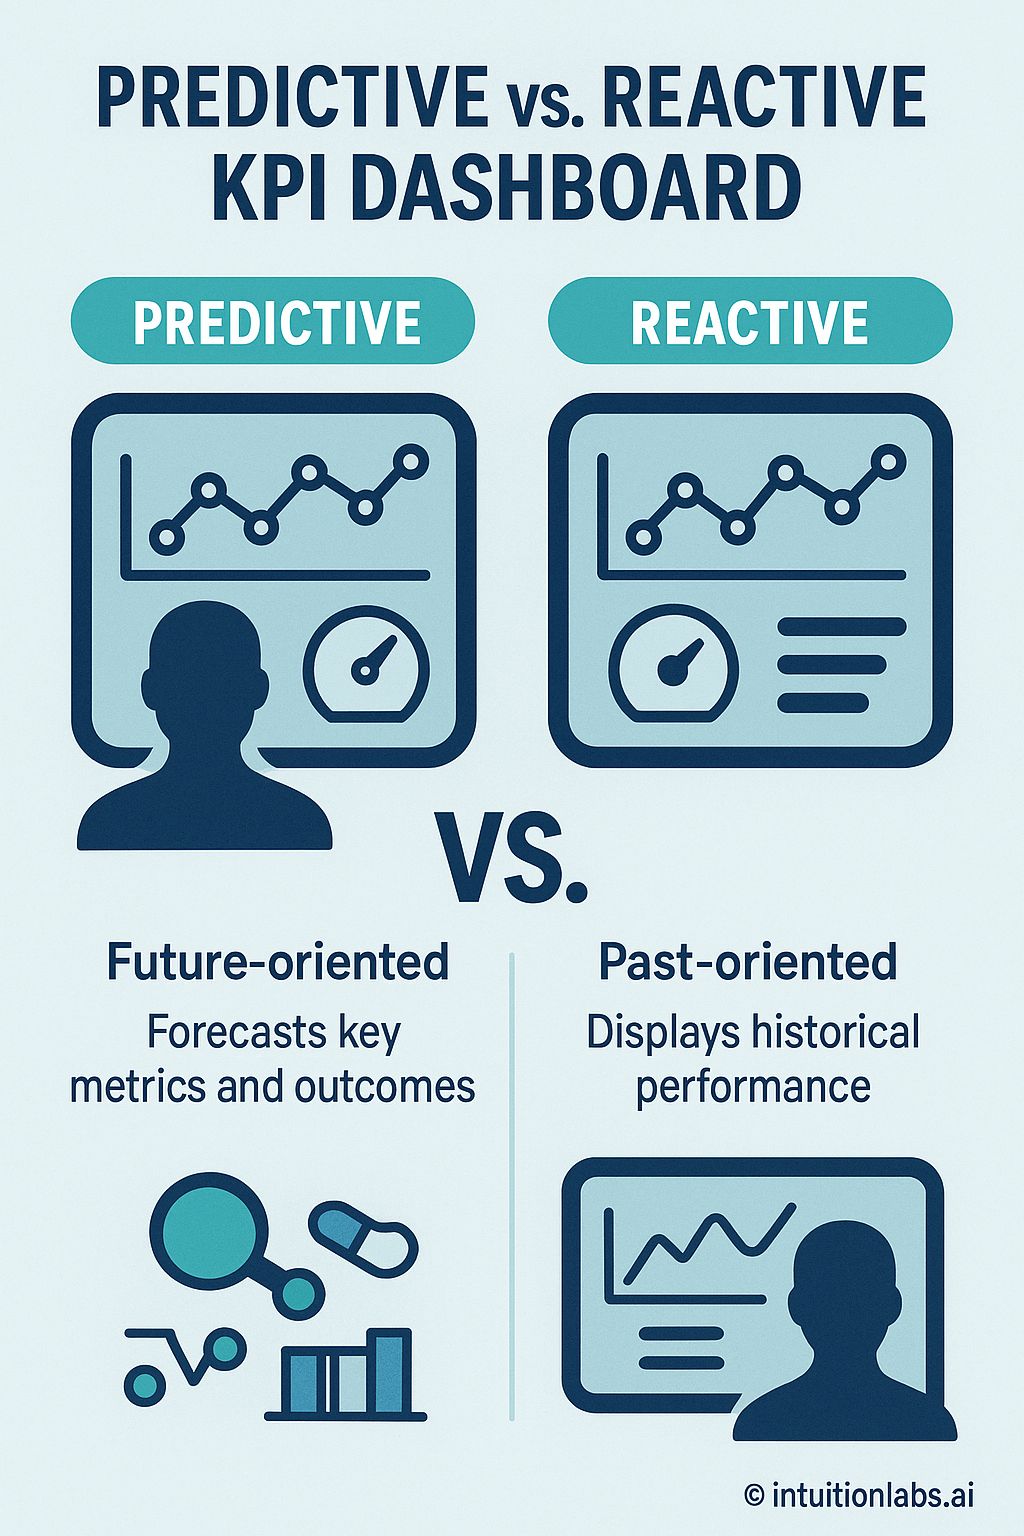
The infographic contrasts predictive and reactive KPI dashboards. It is organized into two main columns, visually separated by the text 'VS.'. The 'Predictive' column on the left features a tile labeled 'Predictive' above an icon composed of a line graph with data points and a gauge. Below this, the text 'Future-oriented' and 'Forecasts key metrics and outcomes' appear, accompanied by icons representing data analysis: a magnifying glass examining data points connected by lines, a capsule, and a vertical bar graph. In contrast, the 'Reactive' column on the right displays a tile labeled 'Reactive' above an icon which shows a similar line graph and gauge alongside three horizontal lines. Beneath, the text 'Past-oriented' and 'Displays historical performance' are featured alongside a different icon. This icon contains a graph, a silhouette of a person, and the same three horizontal lines. The visual layout uses a consistent color palette of teal and light blue, emphasizing a clear distinction between future-oriented forecasting and historical performance analysis. The bottom right corner includes the text '@intuitionlabs.ai'.