
Predictive Drop-Off
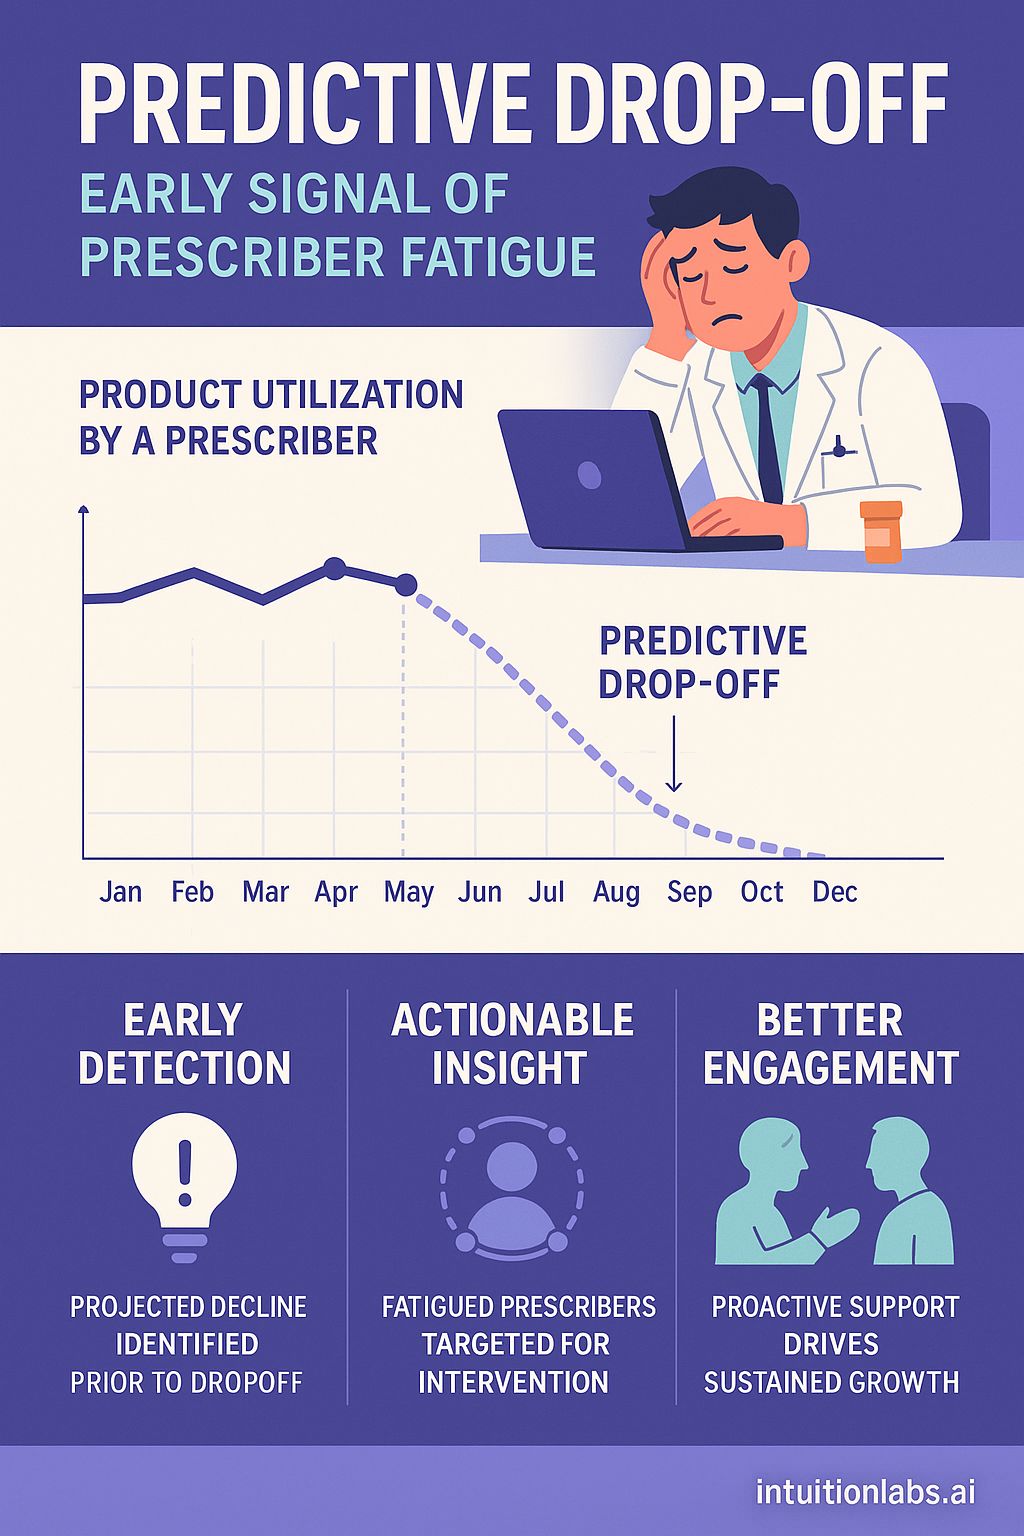
The infographic focuses on the predictive drop-off of product utilization by a prescriber, indicating early signals of prescriber fatigue. A line graph illustrates product utilization over a year, starting in January and ending in December. The graph shows a relatively stable utilization rate from January to May, followed by a sharp decline beginning in May indicated by a dotted line labeled "Predictive Drop-Off", suggesting a predicted decrease in utilization. Below the graph, three key benefits are highlighted: Early Detection, Actionable Insight, and Better Engagement. "Early Detection" is represented by a lightbulb icon and emphasizes that projected declines are identified before the actual drop-off occurs. "Actionable Insight" is represented by a person icon within a dotted circle and indicates that fatigued prescribers are targeted for intervention. Finally, "Better Engagement" is symbolized by two people in conversation, suggesting proactive support drives sustained growth. An illustration shows a doctor at a desk looking stressed at their computer, with a pill bottle next to them.