
Pharma Data Debt
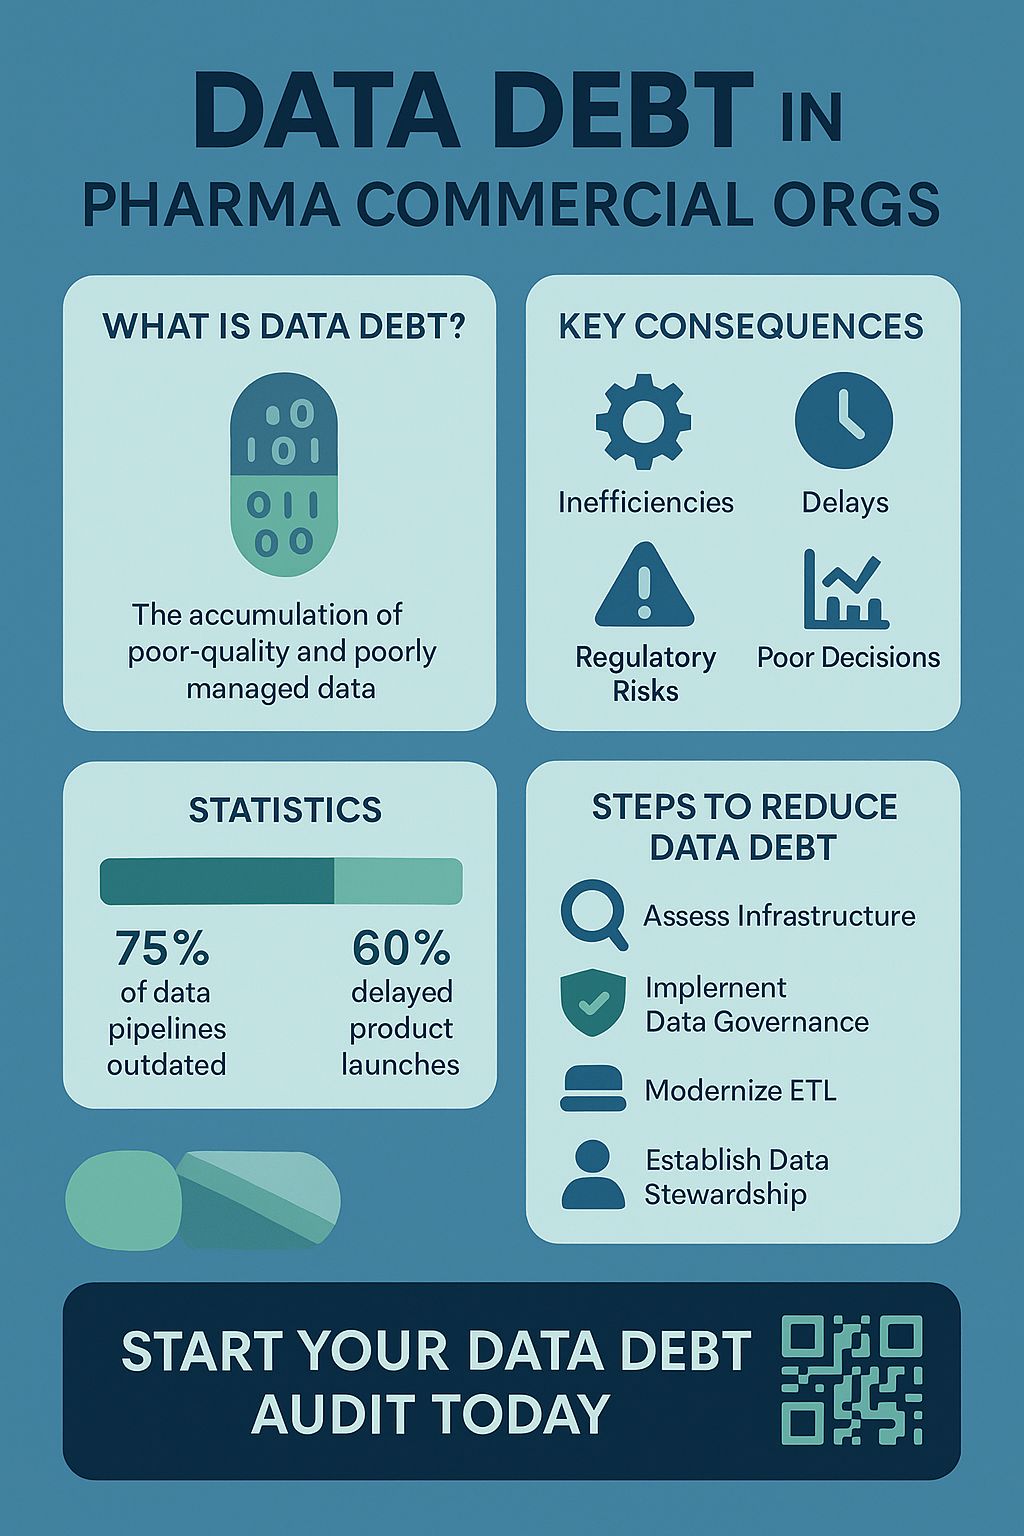
The infographic presents information about data debt within pharmaceutical commercial organizations. It's divided into four main sections. The first section, titled "What is Data Debt?" defines it as the accumulation of poor-quality and poorly managed data, accompanied by an illustration resembling a capsule filled with binary code. The second section, "Key Consequences", lists four negative impacts: inefficiencies (represented by a gear icon), delays (represented by a clock icon), regulatory risks (represented by an exclamation mark in a triangle), and poor decisions (represented by a line graph trending downwards). The third section, "Statistics", presents two data points: 75% of data pipelines are outdated, and 60% of product launches are delayed. Each statistic is visually represented by a progress bar, with the 75% bar being longer than the 60% bar. The fourth section, "Steps to Reduce Data Debt," offers four solutions: Assess Infrastructure (represented by a magnifying glass icon), Implement Data Governance (represented by a shield icon with a checkmark), Modernize ETL (represented by a database icon), and Establish Data Stewardship (represented by a person icon). At the bottom, a call to action says "Start Your Data Debt Audit Today" along with a QR code.