
Pharma Data Debt
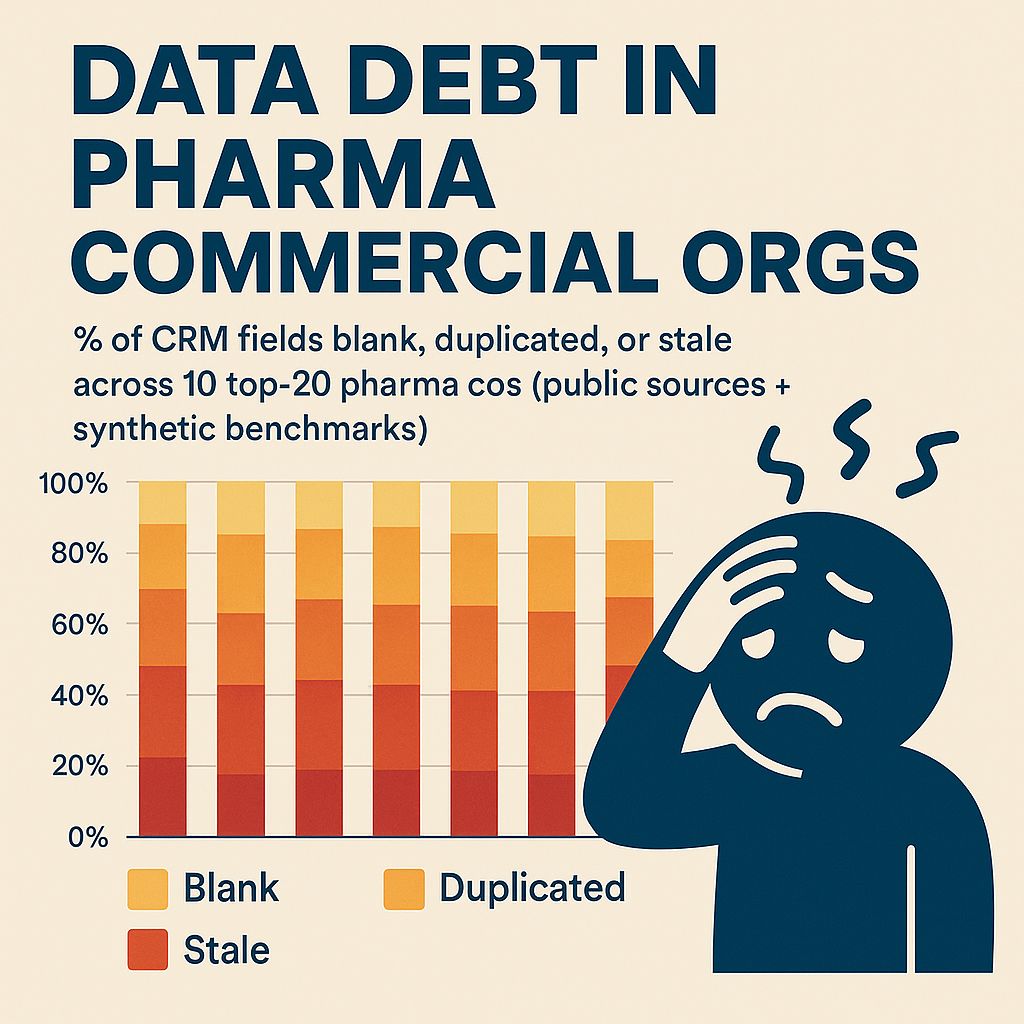
The infographic highlights data debt issues within pharmaceutical commercial organizations. It presents a stacked bar graph illustrating the percentage of CRM fields that are either blank, duplicated, or stale across 10 to 20 top pharma companies, utilizing both public data sources and synthetic benchmarks. The y-axis is scaled from 0% to 100% in increments of 20%. Each bar represents a company, with the bar segmented into three colored sections representing blank, duplicated, and stale fields. The blank fields are depicted in light orange, duplicated in a medium orange, and stale fields in a darker orange. The legend identifies each color to its corresponding status. Visually, a distressed figure is shown next to the chart, conveying a sense of frustration or overwhelm related to the data quality issues. The data suggests a substantial percentage of CRM fields are affected, implying potential inefficiencies or inaccuracies in data-driven decision-making within these organizations. The layering of data segments within the bars provides a clear visual comparison of the relative proportions of blank, duplicated, and stale data across companies.