
Email Calculator
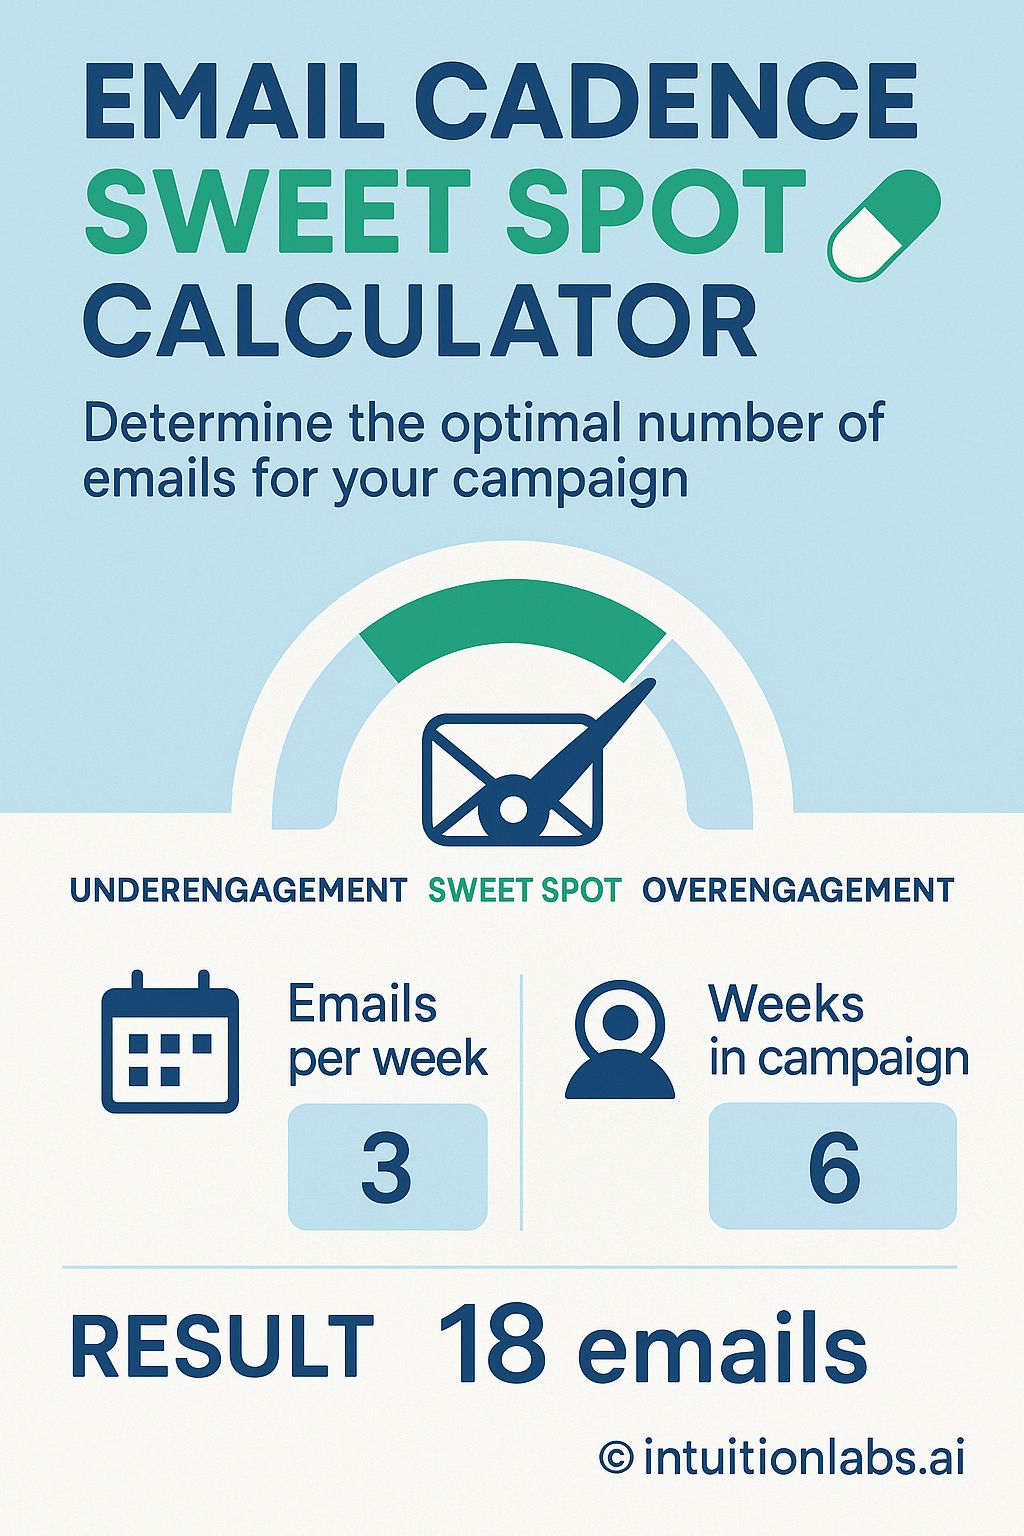
The infographic presents an "Email Cadence Sweet Spot Calculator" designed to determine the optimal number of emails for a marketing campaign. The visual layout includes a semi-circular gauge labeled "UNDERENGAGEMENT SWEET SPOT OVERENGAGEMENT", with a pointer indicating the optimal range. Below the gauge, two data entry fields are displayed. The first field, labeled "Emails per week", has a calendar icon and a value of 3. The second field, labeled "Weeks in campaign", has a user icon and a value of 6. The result of these inputs is prominently displayed as "RESULT 18 emails". The infographic utilizes a clean design with a light blue background and dark blue text, enhancing readability. A capsule graphic appears near the title for emphasis. The bottom displays "© intuitionlabs.ai".