
EHR Triggers
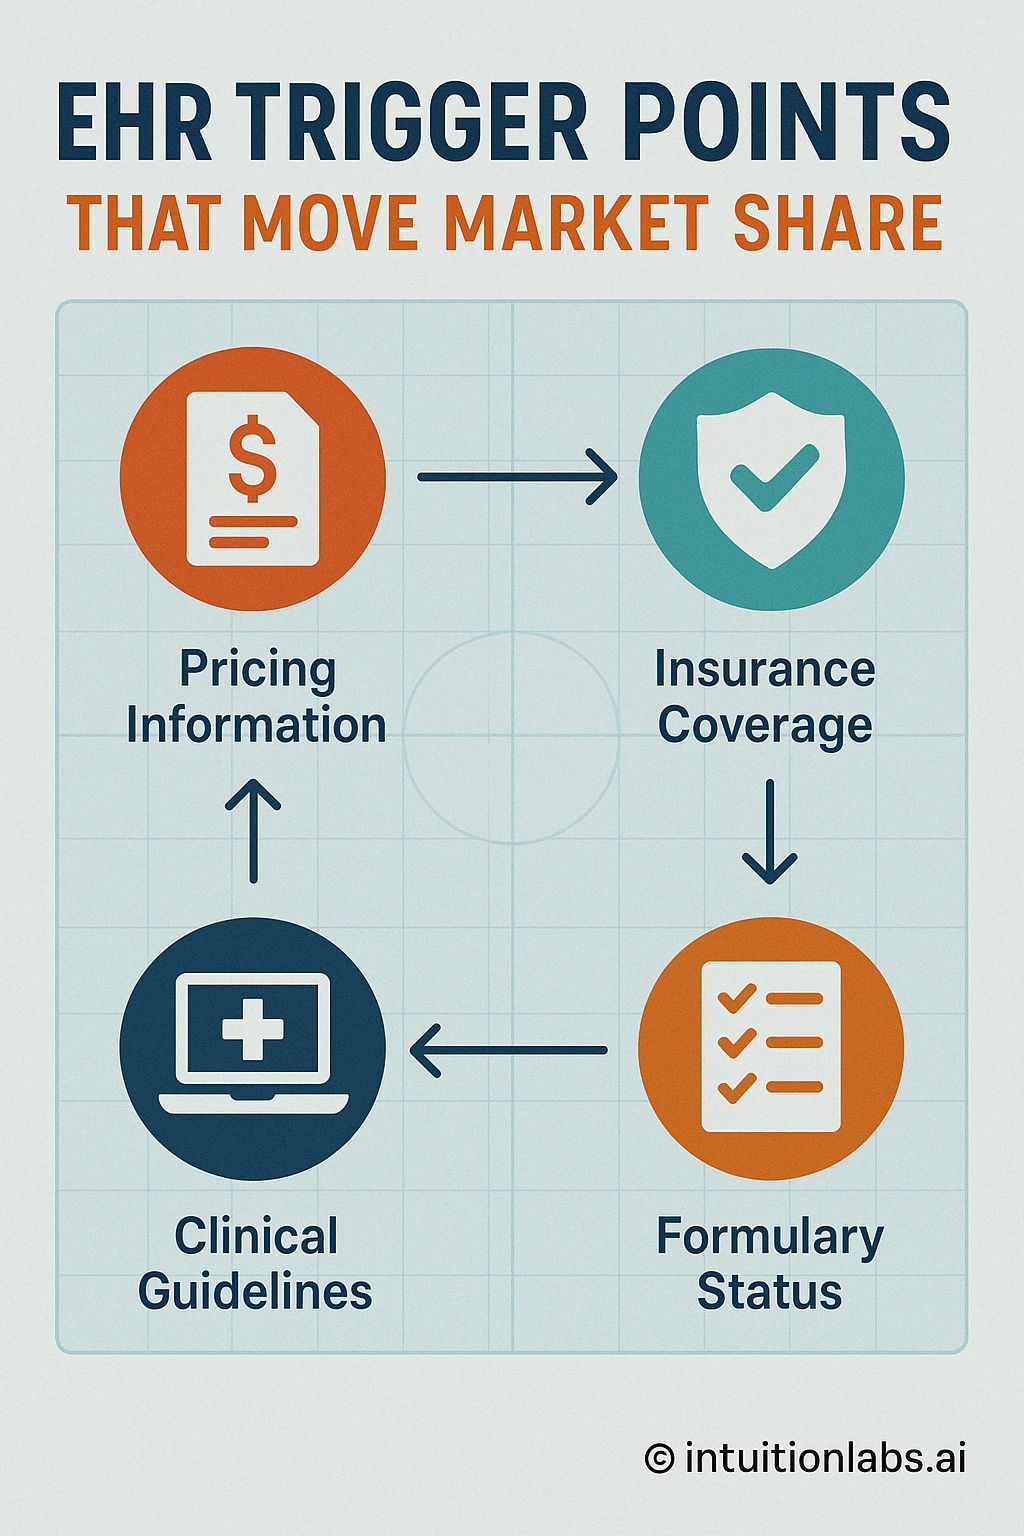
The infographic presents a cyclical flowchart illustrating key factors influencing the Electronic Health Record (EHR) market share. The cycle begins with "Pricing Information," represented by an orange circle containing a document icon with a dollar sign on it. An arrow directs from pricing to "Insurance Coverage," depicted by a teal circle containing a shield icon with a checkmark. A downward arrow leads to "Formulary Status," shown as an orange circle containing a document icon with three checkmarks indicating a list. Finally, an arrow points from formulary status to "Clinical Guidelines", represented by a blue circle containing a laptop icon overlaid with a plus sign. The arrows suggest a circular relationship between these four components, implying an interconnected dependency among them. The flowchart layout highlights a clockwise flow from pricing information, to insurance coverage, to formulary status and finally clinical guidelines. The background features a faint grid pattern, providing visual structure. The copyright at the bottom indicates "intuitionlabs.ai" as the source.