
AI vs Traditional CRM
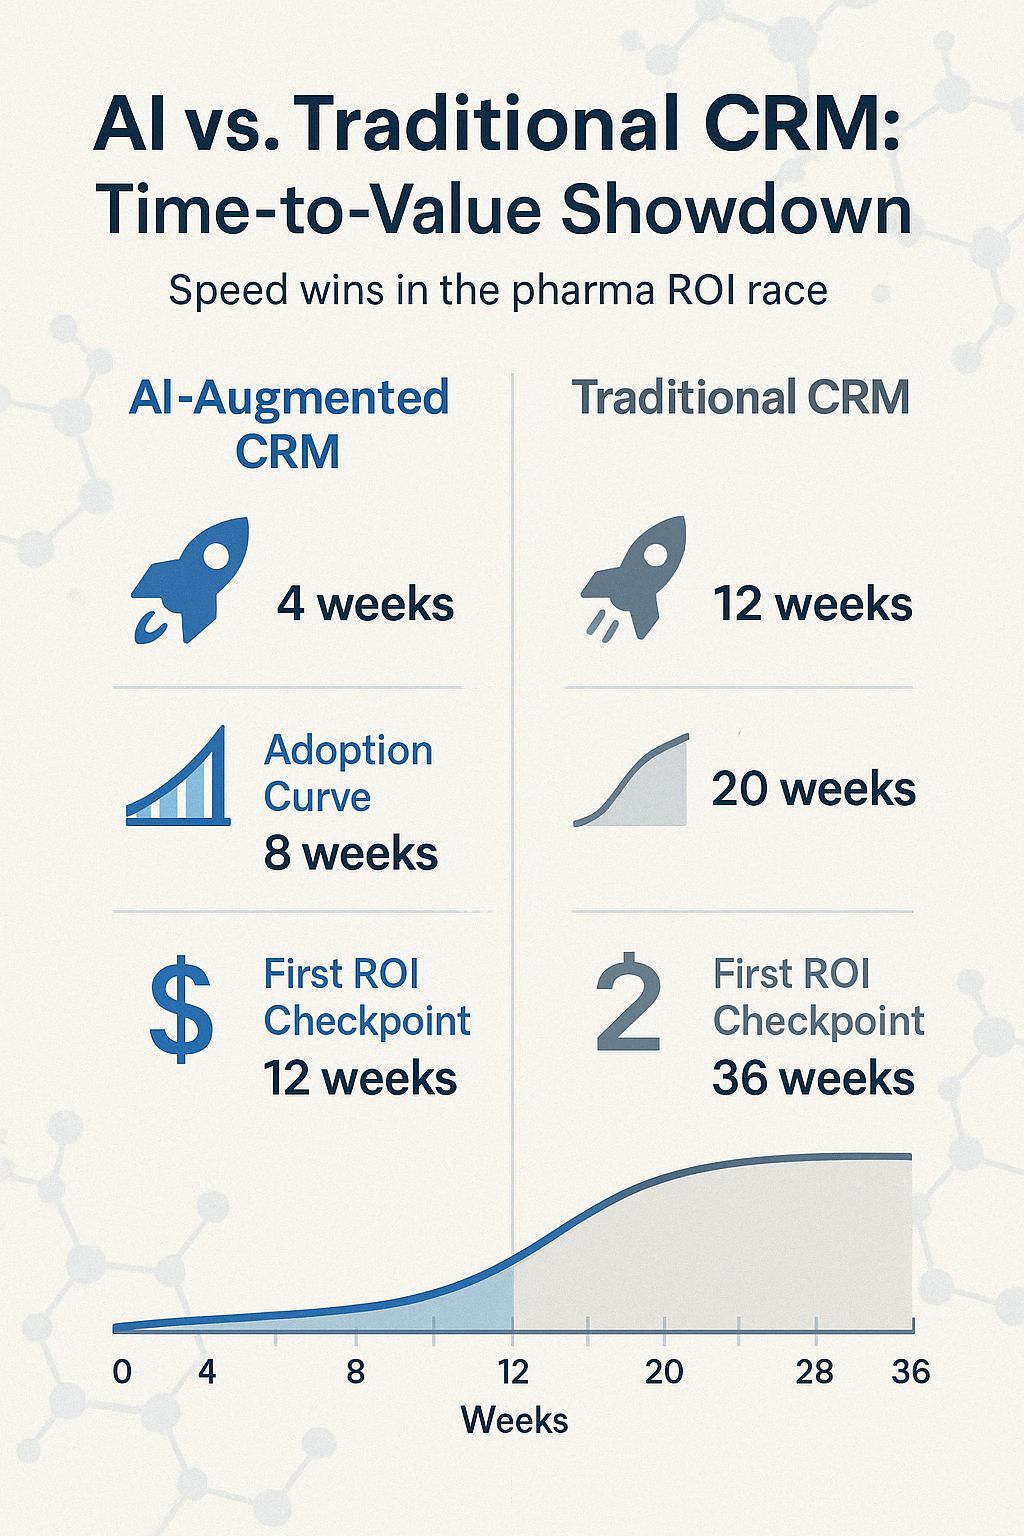
The infographic presents a comparative analysis of AI-Augmented CRM and Traditional CRM, focusing on time-to-value in the pharmaceutical Return on Investment (ROI) race. It highlights the speed advantage of AI-Augmented CRM across three key metrics. For AI-Augmented CRM, the initial setup phase, represented by a rocket icon, takes approximately 4 weeks, whereas for Traditional CRM, it requires 12 weeks. The adoption curve, depicted with a graph icon, shows that AI-Augmented CRM reaches a certain adoption level in 8 weeks, compared to 20 weeks for Traditional CRM. The "First ROI Checkpoint," symbolized by a dollar sign and the number 2 respectively, occurs at 12 weeks for AI-Augmented CRM and significantly later at 36 weeks for Traditional CRM. A line graph visualizes the ROI timeline for both CRM approaches, with the blue line representing AI-Augmented CRM and the grey line representing Traditional CRM. The X-axis of the graph shows time in weeks, ranging from 0 to 36. The AI-Augmented CRM line rises more steeply, indicating a faster ROI, while the Traditional CRM line has a shallower slope, showing a slower ROI realization. The infographic clearly indicates that AI-Augmented CRM provides a substantially faster return on investment compared to Traditional CRM.