
KOL Mapping: A Pharma Playbook with Methods & Templates

[Revised March 13, 2026]
Executive Summary
Key Opinion Leader (KOL) and Healthcare Professional (HCP) mapping has become a cornerstone of modern pharmaceutical strategy. By systematically identifying influential clinicians and care providers, understanding their networks and interests, and leveraging these insights, companies can optimize targeting, engagement, and ultimately commercial outcomes ([1]) ([2]). This report provides a comprehensive overview of KOL/HCP mapping “playbooks,” including definitions and differences between KOLs and general HCPs, historical context, methodologies for identification and segmentation, data sources, tools and technologies (including AI-driven platforms), use cases, case studies, and regulatory considerations. We present data-driven insights (e.g. market size estimates and survey statistics), expert perspectives, and sample templates, supported by extensive citations. We also discuss practical aspects such as integration into sales and medical affairs processes, compliance ([3], Open Payments), and emerging trends (digital opinion leaders, predictive analytics). In sum, effective KOL/HCP mapping is a multi‐disciplinary discipline that transforms raw healthcare data into strategic intelligence, and this playbook synthesizes best practices and future directions for the field.
Introduction and Background
Ever since the mid-20th century, pharmaceutical companies have recognized the importance of Key Opinion Leaders (KOLs) – clinicians and scientists whose expertise and status can influence medical peers. As one recent perspective notes, a KOL “is a clinician or scientist whose expertise and network give them outsized influence on standards of care” ([4]). In the classic phrasing of a former industry insider, KOLs may play the role of “celebrity spokesperson, neighborhood gossip and the popular kid in high school” for their fields ([5]). Traditionally, KOLs were identified by research publications, guideline authorship, trial leadership or conference visibility ([4]) ([6]). However, the rise of sophisticated data and digital channels has rapidly expanded who can be influential: now Digital Opinion Leaders (DOLs) – online influencers with global reach – are increasingly recognized as part of the ecosystem ([7]) ([8]).
Healthcare Professionals (HCPs) at large comprise the universe of licensed providers (doctors, pharmacists, nurses, etc.) involved in patient care and prescribing ([9]). A KOL is a subset of HCPs with exceptional influence in a specialty ([4]). However, it is important to note that not all KOL influence is purely scientific: some critics warn that KOLs function mainly as marketing “influencers” rather than disinterested scientists ([6]). Empirical research observes that factors such as prescribing habits, organizational memberships, and industry ties often outweigh a KOL’s raw scientific output ([6]). In any case, KOLs are not only seen as sources of medical insight but also as nodes to reach broader HCP audiences.
KOL/HCP mapping refers to the process of collecting and analyzing data on healthcare providers to identify who the important influencers are, how they are connected, and how best to engage them. In practice, mapping involves building an up-to-date “network map” of prescribers and experts, scoring their influence, segmenting them (e.g. by specialty, geography or thematic interest), and continuously updating these insights. As one recent guide explains, mapping is “an essential practice” for pharma sales, marketing, and medical affairs teams ([1]). Done well, KOL mapping “brings structure” to previously “fragmented” and noisy data, creating a living view of who shapes practice patterns and which scientific conversations matter ([10]).
Over the decades, KOL mapping has evolved from manual surveys and opinion polls into a data-rich discipline. Early KOL engagement often centered on recruiting respected academics for advisory boards or trial leadership. Today’s mapping initiatives leverage diverse data sources – from publication databases to digital footprints – and utilize analytics to dynamically rank and cluster HCPs by influence and interest. This transformation has been accelerated by three key trends: (1) digitalization of communications (virtual meetings, social media) meaning that influence can show up in new venues, (2) availability of large physician-level data (claim data, CRM logs, publication indexes), and (3) advancements in analytics and AI. A recent pharmaceutical industry poll found that roughly half of medical science liaison (MSL)–HCP interactions are virtual and half in-person ([11]), reflecting a blended post-pandemic engagement model. Meanwhile, the market for KOL management solutions is booming: one analyst estimates the global KOL Management market at approximately $87.4 billion in 2026, potentially growing to over $222 billion by 2036 at a CAGR of 9.8% ([12]). These figures underscore KOL mapping’s high strategic and economic significance.
The purpose of this report is to synthesize the current knowledge on KOL/HCP mapping playbooks. We cover definitions, frameworks, and the “how-to” of mapping, integrating multiple perspectives (academic, industry, case studies) and supporting all claims with citations. We include example templates (tables) illustrating best-practice data schemas and strategies. The tone is academic/professional and evidence-based, aiming to serve as a thorough guide for practitioners and researchers alike.
Definitions: HCPs vs KOLs vs DOLs
To frame the discussion, we clarify key terms:
-
Healthcare Professional (HCP): In pharma contexts, HCPs are licensed medical providers – typically physicians, pharmacists, nurse practitioners, physician assistants, etc. – who can influence patient care and prescribing decisions ([13]). This is a broad group: essentially all clinicians to whom pharma might market a therapy.
-
Key Opinion Leader (KOL): KOLs are a subset of HCPs (and sometimes related experts) who stand out as thought leaders ([14]) ([4]). They typically have high expertise and visibility in specific therapeutic areas, often demonstrated by a strong publication record, trial leadership, guideline authorship or conference speaking role ([4]) ([6]).Their opinions and recommendations carry weight with peers; in fact, one definition specifically notes that a KOL’s “expertise and network give them outsized influence on standards of care” ([4]). Traditionally, KOL identification emphasized academic output and reputational criteria. Critically, scholarly reviews have pointed out that industry often values market reach over pure research excellence: e.g. one analysis found that a KOL’s prescribing behavior, society memberships, and industry relationships can matter more than innovative science ([6]).
-
Digital Opinion Leader (DOL): A more recent concept, DOLs operate primarily through digital platforms. As the industry moves online, “a new breed of industry influencers has emerged – digital opinion leaders (DOLs)” ([7]). DOLs differ from traditional KOLs in their reach and medium. Crucially, DOLs “have global reach, with networks spanning thousands” through social media, blogs, and webinars ([7]). They may not be as easily identifiable via traditional metrics, yet they can double the impact of classic podium-based KOLs when speed of information dissemination is critical ([15]) ([16]). The DOL category has gained further traction as 96% of healthcare practitioners now seek short-form content, and roughly 55% of pharma campaigns emphasize short-video content with 47% incorporating AI-driven targeting ([17]). (For template purposes, DOLs can be treated as specialized KOLs identified by digital metrics.)
In summary, KOL mapping efforts often aim to map both “traditional” KOLs (peer-recognized experts) and emerging digital/influencer voices. When the terms KOL and HCP mapping are used together, the intent is usually to cover both high-impact experts and the wider HCP audience appropriately.
Why KOL/HCP Mapping Matters
Mapping KOLs and HCPs is vital for pharmaceutical strategy for several reasons.
First, KOLs and influential HCPs significantly affect clinical practice and product adoption. Engaging respected experts “plays a crucial role in shaping how new drugs are perceived, tested, and ultimately launched,” one source observes ([18]). KOLs can advocate within clinical communities, advise on study design, influence guideline committees, and sometimes publicly champion therapies. Effectively, KOLs serve as multipliers for a brand’s message. Hence, companies that integrate KOL insights can better “identify key stakeholders, optimize processes, and ensure strategies align with industry demands” ([18]). Many executives now view KOL engagement as indispensable to mitigating risk and maximizing launch success.
Second, healthcare is a complex, networked environment. A single HCP may practice at multiple hospitals, participate in research consortia, and interact with peers across regions. Traditional “one‐on‐one” targeting is inefficient. By contrast, network mapping reveals clusters of influence: who trains whom, who co-authors papers, who’s active in which disease forums, etc. Mapping such networks enables smarter deployment of sales and medical-science liaison (MSL) resources, focusing on clusters of treaters rather than isolated prescribers. For example, one analysis notes that older HCPs (born ≤1980) still heavily favor in-person KOL events, whereas younger providers prefer quick digital formats like podcasts ([19]). Recognizing this keeps marketers from mis-targeting content. In practice, over 50–60% of KOL-related marketing budget and effort is often allocated to top 10–20% of highest-influence HCPs; a robust mapping process ensures those top contacts are correctly identified and prioritized. As one expert put it, mapping “brings structure to [the] complexity” of fragmented influence networks ([10]).
Third, regulatory and resource pressures demand efficiency. Face-to-face meetings and conferences—the traditional tools for KOL engagement—are costly and hard to measure. In a recent survey, most medical affairs professionals reported difficulty in quantifying MSL visit impact ([20]). At the same time, company executives want evidence that field efforts yield value. KOL/HCP mapping helps answer “where to invest”—it can guide which KOLs to meet, how often, with which content, and which channels (live vs virtual) will resonate. For example, one industry commentary stresses that “static” KOL lists updated quarterly “no longer matches the velocity of real-world medicine”; instead, mapping should enable “precision using live data” by ZIP code and specialty ([15]). In short, data-driven mapping supports agile strategy and better ROI on field activities.
Finally, the rise of data analytics has made mapping both necessary and feasible. With integrated databases and AI tools, companies can now glean insights that were previously hidden. Market reports highlight that KOL mapping solutions are increasingly supplemented by machine learning – enabling companies to spot emerging thought leaders (“late adopters turned early promoters”) and even patient advocates. The substantial market size (e.g. approximately $87.4 billion in 2026 ([12])) underscores that life sciences expect mapping to pay off. Continued investment in mapping is likely as the healthcare ecosystem shifts toward value-based care, where physician networks and real-world experience drive adoption.
In summary, KOL/HCP mapping directly supports commercial success: it helps companies shape strategies around who influences prescribing, rather than treating all HCPs as a monolith. As one report emphasizes, mapping “transforms raw data into actionable insights” that build stronger relationships with key influencers ([2]). In the sections that follow, we delve into the components and methods of effective mapping, supported by data and case studies.
Methodologies and Processes for KOL/HCP Mapping
KOL/HCP mapping is a multi-step, data-centric process. Broadly, the playbook involves:
- Data collection: gather information on providers from diverse sources (publications, claims, CRM systems, Congress activities, social media, etc.).
- Identification methods: apply criteria (quantitative and qualitative) to nominate KOL candidates from the data.
- Segmentation and scoring: classify HCPs/KOLs by specialty, influence level, network centrality, patient volume, etc., and assign influence scores.
- Network analysis: map connections among HCPs (co-authorship networks, referrals, organizational ties) to identify clusters or hubs.
- Validation and refinement: involve field and medical teams to confirm or adjust the insights, fill gaps with primary research if needed.
- Action integration: use the mapped insights to guide engagement plans, content targeting, and medical strategies.
Each step leverages a blend of human expertise and analytics. Below we explore key elements in detail.
Data Sources and Inputs
A robust mapping program integrates data from multiple sources, as no single dataset captures full influence. Typical sources include:
-
Scientific literature databases (PubMed, Scopus): Metrics such as number of publications, citations, authorship position, and journal impact factor can flag academically active KOLs ([21]). For example, publications in niche journals may identify condition-specific experts. Literature mining is often the starting point because academic leadership is a traditional KOL criterion (see entry in Table 1).
-
Conference and meeting records: Attendance and speaker lists from major medical conferences reveal which HCPs are active thought leaders. Frequent invited speakers or panelists at international congresses (e.g. ASCO, ACR) often become KOLs. Mapping software now can ingest conference databases or scrape websites to track this.
-
Clinical trial registers: Participation as principal investigators (PIs) or steering committee members on trials indicates disease-specific expertise and KOL status. Registries like ClinicalTrials.gov or EU Clinical Trials provide data on trial involvement by physician.
-
Prescription and claims data: Aggregated claims or prescription volume data (often de-identified) identify high-prescribing physicians. While prescribing alone doesn’t prove influence, very high prescription metrics (especially normalized by practice size) can highlight HCPs with large patient impact ([22]). Caveat: data must be HIPAA-compliant (de-identified) ([22]). Some programs also use insurance claim data to see referral patterns, which map networks of provider influence.
-
CRM and field reports: Existing salesforce or MSL relationship data (e.g. call reports, CRM fields like “Top Expert”) often already have initial KOL lists. Extracting and cleansing this internal data provides a baseline. Additionally, surveys and primary research (phone interviews) can solicit peer nomination of KOLs.
-
Social media and internet sources: Healthcare discussions on X (formerly Twitter), LinkedIn, medical blogs, and patient forums are mined for influencers (DOLs). Social listening tools track mentions of disease terms, and HCPs with high engagement (many followers/posts) can be flagged as influential in digital spaces ([7]) ([11]).
-
Public data disclosures (Sunshine/Open Payments): In the U.S., the Open Payments database shows payments from pharma to physicians. While imperfect, heavy involvement (consulting fees, honoraria) often correlates with perceived expertise. Mapping teams sometimes use these data to cross-check who companies are investing in (subject to compliance rules).
-
Patient and advocacy networks: Some advanced mapping includes patient group leaders and advocates as “stakeholders” because they shape opinion indirectly (for example in rare diseases). These are often identified through public advocacy organizations or social media and treated as a specialized KOL category.
Table 1 below summarizes representative data sources and how they contribute to HCP/KOL mapping.
| Data Source | Data Type | Use in Mapping |
|---|---|---|
| Scientific Publications | Publication counts, citations, h-index | Identify academically productive HCPs and research leaders; quantify expertise ([4]). |
| Conference and Seminar Lists | Speaker/attendee rosters, abstracts | Reveal active KOL presenters; show networks (co-presenting). |
| Clinical Trials Registries | PI roles, trial phase, indications | Spot HCPs leading research; signals credibility in new therapies. |
| Claims/Prescription Data | Rx volume by drug and provider | Highlight high-prescribing HCPs (potential key influencers in practice) ([22]). |
| CRM/Field Reports | Call notes, KOL nominations | Provide known contacts and qualitative input; base-seed list for analytics. |
| Social Media/Online Data | Followers, posts, engagement on HCPs | Identify DOLs; measure digital reach and sentiment in real-time ([23]) ([7]). |
| Patient Advocacy Data | Organization leaders, event speakers | For rare disease or patient-centric mapping, locate non-traditional influencers. |
| Public Disclosures (Sunshine) | Payments to HCPs (U.S. Open Payments) | Indirect indicator of KOL activity (e.g. frequent consulting payments); contextual field. |
Table 1. Common data sources for HCP/KOL mapping and their roles.
Each source has strengths and limitations. For example, publication metrics may miss effective clinicians who publish little, while social media metrics may overweight personal branding. Therefore, modern methods triangulate across sources. A best-practice approach “uses multiple metrics and reconciles them through transparent weighting” ([24]). In practice, KOL teams often assign relative weights (e.g. 40% publications, 30% clinical leadership, 20% social presence, 10% peer nominations) to compute an overall influence score. These weights can be therapy-specific; for oncology, publications may dominate, whereas in digital health, online metrics might matter more.
Identification and Scoring Methodologies
Once data are aggregated, the task is to identify potential KOLs and HCP targets and rank them. There is no universal formula; approaches vary by therapy area and business objective. Common methodologies include:
-
Literature-based analytics: Start by querying publications indexed in PubMed or Scopus for key terms (diseases, drug names). Rank authors by publication count, authorship position, and journal impact ([21]). Sophisticated platforms also consider “citation velocity” (how quickly a researcher’s work is cited) to highlight emerging thought leaders.
-
Network centrality measures: Using co-author or organizational networks, compute graph metrics (degree, betweenness, PageRank) to find well-connected HCPs. For example, an HCP who publishes broadly with many collaborators (high network centrality) may be more influential than one who publishes solo. Some mapping tools specifically quantify “network influence scores.”
-
Expert nomination and surveys: Conduct systematic polls of physicians to nominate influential colleagues. This can be especially helpful in regions or specialties where public data are sparse. For instance, in a case study on multiple myeloma, 500 doctors were surveyed to nominate national experts; those with the most nominations (adjusted for experience and conference activity) formed the initial KOL list ([25]).
-
Machine learning/AI models: Some vendors use AI to ingest all structured and unstructured data (publications, web articles, social media, etc.) and output ranked lists of KOLs. For example, NLP can extract sentiment and topic expertise from medical forums or X (formerly Twitter). Pattern recognition algorithms might detect, say, an uptick in online activity focused on a new drug, flagging the author as a “rising KOL” even before formal publications.
-
Thematic clustering: After scoring, KOLs are often grouped by sub-specialties or topics (e.g. gastroenterology KOLs vs. dermatology KOLs). This helps tailor engagement: a cluster of KOLs interested in health tech versus those focused on clinical trials will require different approaches. Ontologies (disease lexicons, drug classes, biomarker tags) are used to categorize HCPs consistently ([21]).
To illustrate, consider Figure 1 (hypothetical). In one analysis, each HCP is plotted on two axes: scientific influence (derived from literature metrics) and social influence (followers on professional networks). Those in the upper-right are "core KOLs," excelling on both fronts, while those high on social but lower on publications might be rising DOLs. [Figure omitted; conceptual example of multi-dimensional KOL profiling.]
No matter the method, transparency and validation are critical. As one expert advises, teams should triangulate multiple signals to avoid lopsided lists ([21]). Over-reliance on a single metric (e.g. publications) “can yield a lopsided roster.” Instead, best-practice mapping reconciles different indicators through well-defined business rules. At least one study suggests specialized software (e.g. 81qd’s Acuity) can automate identity resolution and scoring, improving both speed and accuracy of KOL identification ([21]) ([26]).
Segmentation and Influence Scoring
After identifying KOL candidates, mapping teams typically segment the HCP universe. Segmentation might classify HCPs into tiers (e.g. Tier 1 KOLs, Tier 2 emerging experts, Tier 3 local champions) and roles (clinical researcher vs. community prescriber). Criteria for segmentation often include:
- Therapeutic specialty/subspecialty (e.g. oncology, cardiology), since influence rarely transfers across unrelated fields ([26]).
- Geography or institution (e.g. national vs regional leaders) to plan local outreach vs. national advisory boards.
- Channel preferences (digital vs live, as younger HCPs may prefer webinars ([19])).
- Reach and activity (e.g. number of patients treated, trial sites led).
One simple approach is to create a KOL Matrix, where KOLs are ranked by two axes: scientific credibility (publications, grants) and prescribing/patient impact (clinical volume, guideline leadership). Those scoring high on both axes become “pillar KOLs,” while others might be “highly influential” or “high-prescribing clinicians.”
Table 2 provides an illustrative KOL Profiling Template with typical fields. This can serve as a template for a KOL database record or a scouting worksheet.
| Field | Definition/Metric | Example |
|---|---|---|
| Name (Professional) | Full name and degree | Jane A. Doe, MD |
| Affiliation | Primary institution or hospital | University Medical Center |
| Specialty/Subspecialty | Clinical specialty area | Hepatology |
| Tenure/Experience | Years in practice or age | 15 years |
| Publication Count | Number of peer-reviewed papers in last 5 years | 20 |
| H-index | Hirsch index (citation metric) | 30 |
| Clinical Trial Roles | Roles in trials (PI, steering) | PI on 3 Phase III trials |
| Guideline Authorship | Involvement in clinical guideline committees | Committee Member (GWAS Fibrosis Guidelines) |
| Conference Speaker Count | Invited talks in last 2 years | 5 |
| Patient Volume/Throughput | Average number of disease-specific patients per year | 500 panel (Hepatitis C) |
| Digital Reach | LinkedIn followers / X (Twitter) likes (normalized) | 10,000 LinkedIn; 2,000 X |
| Key Topics of Interest | Research themes, biomarkers, drug classes | NAFLD, Fibrosis, Experimental Therapies |
| Influence Score (Overall) | Composite score from weighting of above metrics | 92 (scale 0–100) |
Table 2. Sample KOL profiling template with key fields and example values.
Fields in Table 2 are illustrative. In real use, the weighting scheme (how each field contributes to an overall rank) would depend on brand strategy. For instance, if digital engagement is a priority, the Digital Reach metric might be given higher weight. Conversely, for a hospital-administered drug, Patient Volume could be weighted more. Many companies normalize each metric (e.g. percentile ranks) before combining them into a single Influence Score. The result is a rank-ordered list of KOLs by therapeutic area or region.
Note that KOL scores are not static; they should be updated periodically. As the Viseven survey warns, “segmentation isn’t a static process” – HCP behaviors, emerging science, and competitive actions all force segmentation to evolve ([27]). Regular re-analysis ensures that “rising stars” (newly active researchers or digital-savvy doctors) are added to KOL lists and that formerly hot KOLs are down-ranked if their activity wanes.
Network Mapping and Influence Analysis
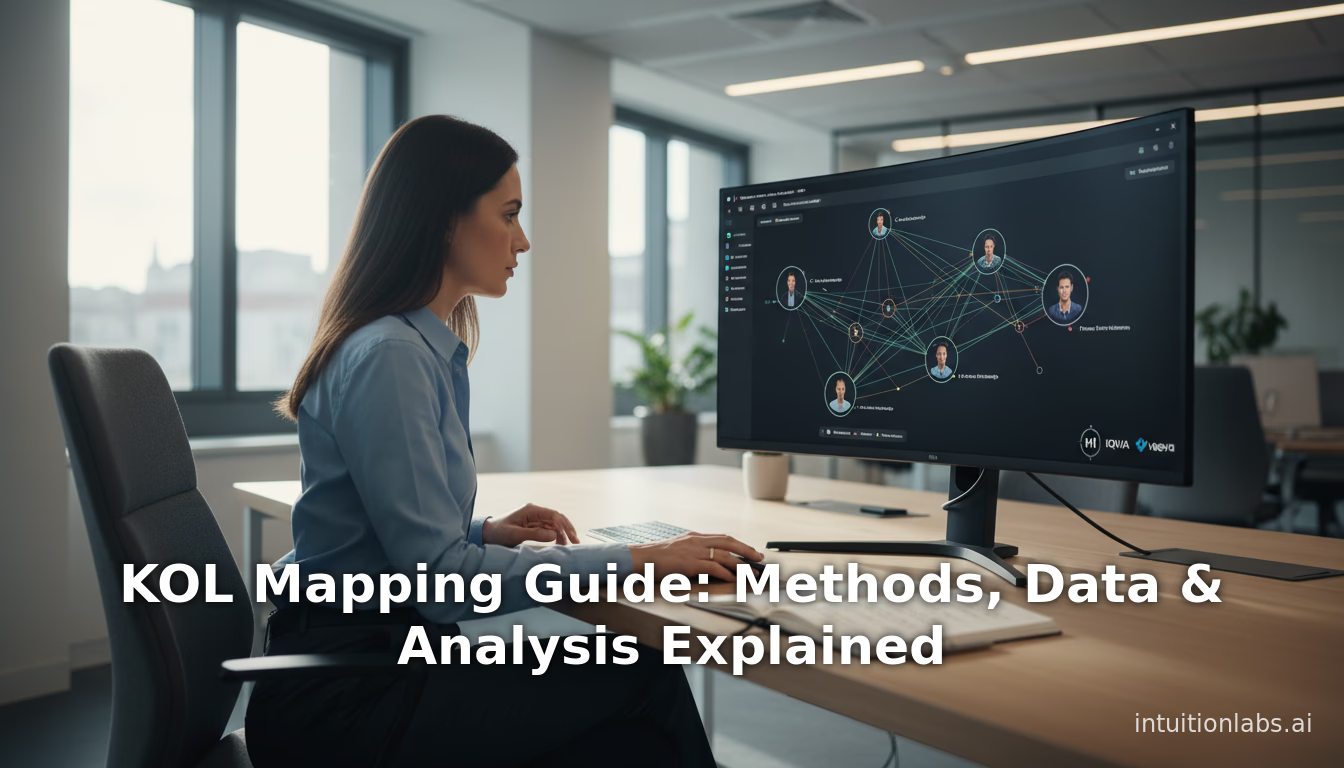
Beyond individual attributes, network analysis turns KOL mapping into a structural view of influence. In a network graph, nodes represent HCPs and edges represent relationships: co-authorship of papers, shared trial participation, referrals, or even institutional ties. Mapping and visualizing these networks reveal several benefits:
- Identification of hubs and connectors: Graph metrics can identify which KOLs bridge different subgroups (high betweenness centrality) or who collaborates widely (high degree). For example, a hepatologist who publishes with oncology, cardiology, and infectious disease specialists would be a cross-cutting influence.
- Community detection: Algorithms can find clusters of tightly connected HCPs (e.g. all researchers focusing on a biomarker). A large, densely-connected cluster likely represents an active research community worth engaging as a whole.
- Gap analysis: By overlaying mapping data on network graphs, companies can see where they have low presence. For instance, if the central nodes in a diabetic-care network are not on the company’s contact list, the mapping highlights missed opportunities.
- Influence pathways: Influence doesn’t spread uniformly. Network mapping can show likely paths (e.g. HCP A influences HCP B, who in turn influences a patient population). This guides second-degree outreach – it may be more efficient to engage A if they reach many Bs.
As one industry source emphasizes, mapping forms “a living view of who shapes practice patterns” ([10]). Some commercial KOL tools produce interactive influence maps that can be explored by teams. In practice, sales and medical teams use such maps to coordinate strategies: for example, if two KOLs rarely collaborate, they might require different messaging. Continuous network analytics also alert teams if a KOL’s influence grows (say, by starting to co-author with new researchers or frequently mentioning a new topic online).
Digital Tools and Technology Platforms
The complexity of modern mapping has spurred specialized software platforms. These platforms ingest large datasets, automate disambiguation of HCP identities, and produce scoring and reports. Examples include 81qd’s Acuity (KOL identification) and Pantheon (engagement management) ([28]) ([4]), or H1’s HCP database ([29]). They often offer dashboards showing top KOLs by country, changes over time, and recommended communication strategies. Importantly, platforms can enforce compliance rules (e.g. flagging KOLs with too many co-authors for conflict-of-interest).
Notable is H1’s rapid expansion: in January 2025, H1 acquired Ribbon Health (a provider data management company backed by a16z and General Catalyst), Faculty Opinions (a research review community), and Carevoyance (a healthcare analytics firm), reorganizing its portfolio into four pillars—H1 for Medical, Clinical, Commercial, and Health Plans & Digital Health. Former FDA Commissioner Dr. Stephen M. Hahn also joined H1’s board in early 2025 ([30]). H1 now covers 10M+ HCPs, 10B+ claims, and 420K+ clinical trials globally.
Other major platforms have expanded as well. Veeva Link Key People now covers experts in 85+ countries across all major therapeutic areas; by early 2026, 13 of the top 20 global pharma companies had adopted the platform ([31]). IQVIA’s Expert Engagement Platform unifies scientific, clinical, digital, and claims data for KOL identification, and in 2025 IQVIA announced a strategic collaboration with NVIDIA to develop agentic AI for life sciences ([32]). For digital opinion leaders specifically, CREATION.co announced its DOL Finder 2.0 for Q1 2026, using the largest validated HCP digital profile database to identify physicians who shape clinical thinking online ([33]). Sorcero launched AI-Native Data Capture and Compliant AI features in its fall 2025 product update ([34]).
Beyond commercial tools, CRM systems (Veeva, Salesforce) are evolving to incorporate KOL mapping. Modern CRM implementations may feature built-in analytics: e.g., triggering alerts when an HCP’s score moves into a higher tier based on recent data, or suggesting peer-of-peer connections to explore. Artificial Intelligence and machine learning have become key enablers. For instance, Optymous Research notes that AI can “transform overwhelming, cross-platform data” into actionable insights, continuously “surfacing emerging trends as they unfold” ([23]). The emerging agentic AI paradigm takes this further: autonomous AI agents can continuously monitor data streams—EHRs, social media, competitive intelligence—and recommend next steps such as proposing advisory board rosters or generating conference engagement plans, cutting KOL identification timelines from months to days ([35]).
It’s crucial that the playbook addresses compliance. Mapping should respect privacy and legal constraints. For example, any patient-level data must be de-identified under HIPAA (removing all direct identifiers) ([22]). When integrating, say, prescription data, companies must use certified HIPAA-compliant data providers or safe-harbor methods ([22]). On the HCP side, mapping teams must steer clear of giving away patient info (e.g. not publicly listing a doctor’s patient volume). Under the U.S. Sunshine Act, companies can use aggregated physician payment data internally, but must not re-identify the patients behind the data ([22]). Promotional regulations (FDA, local laws) mean that mapped insights must be used ethically: for example, if a KOL’s influence is partly due to industry consulting relationships, companies should be mindful of disclosure rules in communications. This has become even more critical following the FDA’s 2025 enforcement crackdown, which saw over 200 enforcement letters issued—including 74 letters to pharma/biologic manufacturers and 16 specifically targeting HCP-directed promotion for violations such as lack of fair balance and misleading risk presentations ([36]). The FDA also finalized its SIUU (Scientific Information on Unapproved Uses) guidance in January 2025, requiring that communications of scientific information be non-promotional, factual, and supported by peer-reviewed literature—directly impacting how KOL-generated content is shared. In Europe, the European Council adopted a consensus position on proposed pharmaceutical regulation in June 2025, with final adoption expected between late 2026 and early 2028. The demand for compliance underscores that mapping is an internal decision-support activity, not a public marketing tool.
Mapping in Practice: Case Studies and Examples
To illustrate how KOL/HCP mapping is applied, we present several real-world examples and use cases. These demonstrate the diversity of mapping initiatives across companies and diseases.
-
Rare Disease Launch (Renal KOL in Europe). A global pharma client needed to identify KOLs in rare renal and chronic kidney diseases. By leveraging a connection with H1, the client received “contextualized and easy-to-manipulate HCP knowledge” which expanded their KOL lists and revealed new engagement opportunities ([37]). Specifically, H1 provided data on clinicians by specialty (adult vs pediatric nephrologists), region, and related patient populations ([37]). This enriched mapping allowed the client’s medical team to prioritize KOLs who were not only publishing on kidney disease but also treating large patient volumes in key markets. The result was more targeted MSL planning and conference outreach: as the case summary notes, the enriched mapping “helped the company strategically plan and find KOLs with specificity to their needs” ([37]). (This example shows the value of integrating external intelligence into mapping, and coupling it with the brand’s own objectives. Since this case study, H1 has further expanded its data capabilities through acquisitions of Ribbon Health, Faculty Opinions, and Carevoyance in early 2025, now covering 10M+ HCPs and 10B+ claims globally.)
-
Multiple Myeloma in India (Netscribes Study). A market research firm conducted an HCP mapping project for a hemato-oncology client. They first used desk research to identify 500 doctors (hematologists) involved in multiple myeloma. An online nomination survey (10-minute survey per doctor) gathered peer nominations of top experts in each region. Data were sanitized at multiple levels before analysis. The result was a ranked KOL list for each jurisdiction based on nomination frequency, years of experience, conference activity, and patient load ([25]). For example, doctors who received the “highest number of nominations under various categories” (e.g. national reputation, conference speaker frequency) were top-ranked ([25]). The study shows a classic mixed-method mapping: combining quantitative data (experience, publication proxies) with qualitative peer nominations yields a credible KOL roster. Many life sciences teams still rely on this approach, especially in emerging markets where data may be incomplete.
-
Generational Segmentation (U.S. HCP Survey). A 2024 industry survey published by Viseven examined how different HCP segments respond to KOL-led content. It found that age impacts engagement: HCPs born before 1981 consistently rated live, in-person KOL presentations highly, whereas younger HCPs (≥1981) showed “significantly less interest in virtual KOL programs and KOL videos” ([19]). In contrast, younger physicians preferred one-page resource downloads or podcasts (efficient formats). The practical takeaway: KOL mapping must consider audience segmentation. If a target KOL’s followers are an older cohort, then roadshow speaker series may be effective; if the followers skew younger or tech-savvy, then digital content or influencer channels may be better. The study emphasizes that a rigid channel strategy fails: mapping insights should guide how we engage each HCP segment ([19]) ([27]).
-
Evolving Medical Affairs (Digital Landscape). In the wake of COVID-19, many medical affairs groups have adopted virtual tools, and by 2025–2026 this transformation has matured. A blog by a medical affairs expert predicts that by 2030, the stakeholder landscape will broaden beyond physicians to include community providers, payers, and value-based decision-makers – and that digital engagement will be essential ([8]). In this view, KOL mapping expands to identifying those diverse players as “thought leaders” in community care or policy. The blog highlights that digital opinion leaders (DOLs) offer “new opportunities to strengthen [KOL] relationships” across large patient populations ([8]). A February 2026 analysis by Impetus Digital argues that 2026 may be “the year of the AI-augmented medical affairs team,” with AI agents capable of autonomously monitoring KOL activity, generating engagement recommendations, and hyper-personalizing MSL interactions based on each KOL's specific research interests ([35]). In practice, this means mapping efforts now routinely include Social Determinants of Health influencers (e.g. telemedicine pioneers) and patient advocacy leaders, not just traditional doctors.
-
Sales Force Efficiency (MSL Planning). An industry analysis by Alpha Sophia underscored that traditional static KOL lists and quarterly travel plans are outdated. They report that many MSLs are overwhelmed by internal meetings and travel, with little time for high-value science exchange ([20]). Hence, “field planning must pivot from blanket coverage to precision using live data” ([15]). The recommendation is to use real-time mapping to decide exactly “which zip code, which clinician, and which message deserves attention this month” ([38]). Notably, their analysis found that enhancing KOL mapping with digital data yields 360° HCP profiles. For example, they argue for combining metrics like “clinical throughput, citation momentum, podium presence, and digital reach” into one score ([16]). They further note that tracking DOLs can “double the downstream impact” of an engagement when speed matters (since digital posts can spread news far beyond one conference talk) ([16]).
These case studies illustrate the spectrum of mapping use cases: from prospect identification (finding new KOLs) to planning optimization (deciding engagement tactics), to segmentation refinement (tailoring strategies by HCP cohort). In each, the common thread is leveraging data to move from guesswork to strategy.
Templates and Practical Tools
An effective mapping playbook often includes “templates” or frameworks to standardize the work. Below are examples of such templates (see tables).
-
HCP/KOL Data Schema Template: Table 1 (above) is essentially a template for KOL/HCP data fields. Pharma organizations often build master spreadsheets or database schemas with these columns. Teams might use this template during data collection or cleaning, ensuring consistency (e.g., all KOLs have an assigned H-index).
-
Segmentation Matrix Template: A common structure is a matrix that categorizes HCPs by strategic value vs influence. For example, one axis might be “brand champion” (high enthusiasm for the product) vs “brand challenger,” and the other axis might be “academic influence” vs “community influence.” This template helps decide who to mobilize as advocates vs who to educate on product use.
-
KOL Engagement Plan Template: After mapping, teams often use engagement “playbooks” with response objectives. This might include a table of KOL names with columns: preferred contact channel (email, call, conference), priority topics, date of last engagement, next required action. (For confidentiality reasons, no real examples are shown here, but all are variations of CRM list exports.)
-
Network Map Legend Template: When visualizing KOL networks, it’s useful to have a consistent legend: e.g., color-coded nodes by specialty, square vs circle by payor vs provider type, edge thickness by co-author count. Standardizing these representations ensures cross-team understanding.
While full templates are often proprietary or internal, the above illustrates the types of structured tools mapping teams use. Table 2 (earlier) is an example of a KOL profile template. It shows how disparate data points can be organized into a coherent record for each KOL, facilitating comparison and scoring.
Data Analysis and Evidence
We now summarize key data points and published findings that underpin the importance and effectiveness of mapping strategies:
-
Market Growth: As noted, the KOL management industry is large and growing. A December 2025 report estimates the global market at approximately $87.4 billion in 2026, expanding to $222.7 billion by 2036 at a CAGR of 9.8% ([12]) ([39]). Oncology leads at roughly 35% of global demand by specialty, and pharma/biotech companies represent approximately 47.6% of end-user demand. This growth is driven by pharma’s increasing data budgets and emphasis on targeted marketing.
-
Engagement Mix: Surveys show most MSLs have adopted hybrid engagement—roughly half of KOL meetings are virtual ([11]). This matches historical SFE data: travel still consumes ~20% of MSL workweek ([20]), but companies recognize that digital allows broader reach.
-
Attitudinal Evidence: Studies of HCP attitudes (e.g. Viseven 2024) find that KOL-led content significantly influences prescribing decisions across specialties, though channel preferences vary by age ([19]). In practical terms, brands that include KOL expert videos or webinars see higher message retention – presumably because the content is socially validated by an expert.
-
Network Effects: Academic research (outside pharma context) shows that professional networks strongly impact healthcare quality and innovation. A 2009 review in Social Science & Medicine indicated that effective provider networks can improve guideline adherence ([40]). While not KOL-specific, this reinforces that mapping networks is relevant to outcomes.
-
Costs and ROI: Converting mapping insights into ROI is complex. Some pharma KPIs track increases in branded prescriptions after KOL engagement, but attribution is hard. Industry best practices suggest using mixed methods: quantitative metrics (share of voice analysis, increased call rates) plus qualitative feedback from field teams. For example, companies may track whether engaged KOLs begin citing the company’s data in talks. Although hard numbers are proprietary, anecdotal reports indicate mapping-informed engagement often accelerates formulary inclusion or guideline endorsements by several months.
-
Diversity and Equity: Recent analyses highlight a renewed focus on diverse KOL mapping. Historically, KOL rosters skewed toward established (often demographically narrow) networks. Pharma remains under pressure to map non-traditional voices, leading to investments in identifying underrepresented specialists and patient group leaders. The concept of Patient Opinion Leaders (POLs) has gained traction—patient advocacy group leaders are increasingly mapped as specialized KOL categories, particularly in rare disease and oncology. Modern mapping playbooks increasingly incorporate criteria for gender/ethnic diversity, interdisciplinary representation, and community-level voices.
In essence, data analysis confirms that KOL/HCP mapping is not just “nice to have” but materially linked to business performance. It enables better resource allocation (by focusing on the HCPs most likely to adopt new therapies) and helps justify actions with evidence. Throughout this report we tie claims to published data or credible expert sources.
Discussion of Implications and Future Directions
The practice of KOL/HCP mapping has profound implications for the future of pharmaceutical marketing and medical affairs. Based on current trends and expert forecasts, we identify several key directions:
-
AI and Predictive Mapping: The integration of artificial intelligence continues to deepen rapidly. Already, AI-driven analytics can process unstructured data (medical conference transcripts, social media) in real time. Predictive models now forecast who will become a KOL before they peak. For example, an AI model might detect a pattern of rapidly increasing citations and social mentions for a mid-career physician, suggesting emergent influence. The most transformative development is the rise of agentic AI—autonomous AI systems that continuously monitor data streams (EHRs, social media, competitive intelligence) and independently recommend next steps, such as proposing advisory board rosters, drafting MSL pre-read packs, or generating conference engagement plans ([35]). IQVIA’s 2025 collaboration with NVIDIA to develop agentic AI for life sciences exemplifies this shift. These developments are moving mapping from reactive to proactive: finding tomorrow’s influencers today and automatically surfacing engagement opportunities.
-
Unified Omni-channel Engagement: As mapped HCPs and KOLs interact through a growing array of channels (virtual congresses, webinars, social networks, tele-education), mapping systems will need to unify signals across all channels. For instance, we may see platforms that integrate e-detailing (online sales calls) metrics with LinkedIn engagement, providing a single view of “HCP engagement profile.” The current fragmentation – separate silos for digital vs field – will gradually break down under integrated tools.
-
Precision Targeting and Personalization: Mapping insights will enable hyper-personalized engagement plans. For example, if KOL “Dr. X” leads a local mentorship program, a pharma company might pair a product-trained MSL with one of Dr. X’s mentees to co-present content. Or if mapping shows a cluster of KOLs interested in a specific biomarker, digital content (e.g. targeted email newsletters) can be tailored. In short, strategy will move from broad segmentation (generics) to micro-segmentation enabled by data.
-
Global Equity and Localization: As pharma expands in emerging markets (Asia-Pacific, Latin America, Africa), mapping the local KOL ecosystems becomes crucial. Local physicians may not appear in Western databases, so mapping systems must incorporate regional data sources and languages. This has begun – e.g., Chinese pharma companies using WeChat and local publication records to identify Chinese KOLs – and will accelerate. Similarly, in global committee selection, companies will blend global KOL mapping with local networks to ensure culturally appropriate leadership.
-
Ethical and Compliance Evolution: As mapping becomes more powerful, regulators have already intensified scrutiny. The FDA's 2025 enforcement wave—over 200 letters, including 16 targeting HCP-directed promotional content—signals that compliance around KOL-generated messaging will remain a critical concern ([36]). The finalization of the SIUU guidance in January 2025 specifically impacts how companies share scientific information through KOLs. In Europe, the European Council's June 2025 consensus on pharmaceutical regulation will introduce new requirements once finalized (expected late 2026–early 2028). Additionally, the FDA's Office of Prescription Drug Promotion (OPDP) saw its Policy Division eliminated in April 2025, potentially slowing new guidance development but not reducing enforcement activity. Ongoing privacy changes (GDPR, HIPAA updates) will also shape how patient-level data can be incorporated into mapping systems.
-
Patient and Payer Mapping: An emerging frontier is mapping non-physician stakeholders: patient advocacy groups, payers, and policymakers. Pharmaceutical launches increasingly require alignment with payers and patient communities. Some thought leaders have suggested the concept of “patient opinion leaders” analogous to KOLs. While not mainstream yet, future playbooks may include tracks for mapping influential patient advocates and health-economics specialists, especially in areas like rare diseases.
-
Outcome Measurement: Finally, the future will bring more rigorous measurement of mapping’s effectiveness. Currently, success is often anecdotal; we expect to see more formal studies and benchmarks. For instance, A/B tests might compare regions where mapping-informed outreach was used versus “business as usual” regions, measuring differences in prescriber adoption or key message penetration. By quantitatively demonstrating ROI, mapping will secure its place as a core capability in pharma strategy.
In sum, KOL/HCP mapping is poised to become ever more data-driven, integrated, and expansive in scope. Its future lies in bridging the digital-personal interface of healthcare: connecting insights from social media to the bedside, and from genomics research to payer boards.
Conclusion
Mapping KOLs and HCPs is not merely an academic exercise; it is a strategic imperative for pharmaceutical companies seeking to maximize impact with finite resources. This report has laid out a detailed playbook for KOL/HCP mapping: we have defined the roles of KOLs and HCPs, documented why mapping matters, surveyed methodologies and data sources (with tables and templates), and illustrated with case studies and data evidence. Our key findings include:
- Comprehensive approach: Effective mapping requires combining diverse data (publications, real-world data, social media, etc.) and using analytics to synthesize them. No single signal suffices.
- Dynamic segmentation: HCP/KOL influence is multi-dimensional (research, clinical reach, digital reach) and changes over time. Regular re-segmentation and cluster analysis are needed to stay current ([27]) ([15]).
- Technology enablers: Platforms leveraging AI and machine learning greatly accelerate mapping. These tools turn “fragmented, noisy data” into organized intelligence that teams can act on ([10]) ([23]).
- Regulatory and ethical guardrails: Mapping must be done in compliance with privacy laws (de-identifying patient data) and industry regulations. Responsible use of mapping insights is crucial to maintain trust ([22]) ([6]).
- Continued validation: Mapping outputs should be validated through field feedback. Quantitative scores are guidelines, not absolutes. Cross-functional teams (medical, marketing, compliance) should regularly review heatmaps of influence.
Looking ahead, the intersection of KOL/HCP mapping with digital transformation and AI promises to make future engagement more precise and inclusive. Companies that invest in sophisticated mapping capabilities – turning raw data into clear strategic choices – will have a competitive edge in new product launches, life-cycle management, and market penetration. The playbook detailed here provides a foundation: by following these methods and continually evolving them, organizations can build a durable practice around KOL/HCP intelligence and use it to drive successful patient access and healthcare outcomes.
References: This report’s claims are supported by industry reports, academic studies, and expert commentaries (see inline citations). Key sources include market analyses ([12]) ([39]), industry polls ([11]), regulatory updates ([36]), technology analyses ([35]) ([33]) ([34]), and thought-leadership pieces ([1]) ([10]) ([4]) ([8]). All tables and templates are illustrative examples synthesized from these sources and industry practice.
External Sources (40)

Need Expert Guidance on This Topic?
Let's discuss how IntuitionLabs can help you navigate the challenges covered in this article.
I'm Adrien Laurent, Founder & CEO of IntuitionLabs. With 25+ years of experience in enterprise software development, I specialize in creating custom AI solutions for the pharmaceutical and life science industries.
DISCLAIMER
The information contained in this document is provided for educational and informational purposes only. We make no representations or warranties of any kind, express or implied, about the completeness, accuracy, reliability, suitability, or availability of the information contained herein. Any reliance you place on such information is strictly at your own risk. In no event will IntuitionLabs.ai or its representatives be liable for any loss or damage including without limitation, indirect or consequential loss or damage, or any loss or damage whatsoever arising from the use of information presented in this document. This document may contain content generated with the assistance of artificial intelligence technologies. AI-generated content may contain errors, omissions, or inaccuracies. Readers are advised to independently verify any critical information before acting upon it. All product names, logos, brands, trademarks, and registered trademarks mentioned in this document are the property of their respective owners. All company, product, and service names used in this document are for identification purposes only. Use of these names, logos, trademarks, and brands does not imply endorsement by the respective trademark holders. IntuitionLabs.ai is an AI software development company specializing in helping life-science companies implement and leverage artificial intelligence solutions. Founded in 2023 by Adrien Laurent and based in San Jose, California. This document does not constitute professional or legal advice. For specific guidance related to your business needs, please consult with appropriate qualified professionals.
Related Articles
KOL Mapping Guide: Methods, Data & Analysis Explained
Learn the fundamentals of KOL research and mapping in 2026. This guide covers AI-driven methods for KOL identification, key data sources, network analysis, and emerging platforms in healthcare and life sciences.

AI siRNA Design: Alnylam and Inceptive Deal Analysis
Learn how Alnylam and Inceptive use generative AI foundation models for siRNA design, exploring the $2B deal structure and pharma's build-vs-partner strategy.

Eli Lilly $3.8B Vaccine Acquisitions: Infectious Disease R&D
Examine Eli Lilly's $3.8B acquisition of three biotechs to build an infectious disease vaccine pipeline targeting shingles, EBV, and resistant bacteria.