Videos
Browse videos by topic
All Videos
Showing 601-624 of 1435 videos

Venture Capital in Healthcare vs. Bootstrapping
AHealthcareZ - Healthcare Finance Explained
@ahealthcarez
May 14, 2023
This video provides an in-depth exploration of the contrasting paths of securing Venture Capital (VC) funding versus bootstrapping for healthcare startups. The speaker, Dr. Bricker from AHealthcareZ, presents a strong perspective that Venture Capital in healthcare operates as an exclusive "club," making it largely inaccessible to the majority of aspiring entrepreneurs. He argues that success in raising VC is often less about the brilliance of an idea or the entrepreneur's skill, and more about their existing network, educational background, and geographical location. The presentation meticulously outlines the typical criteria for entry into this "VC club." These include graduating from elite institutions such as Ivy League schools, MIT, or Stanford, having prior professional connections through previous roles in venture-backed startups or even working directly in venture capital, or possessing personal ties like friends or family members within the VC ecosystem. Geographically, the speaker emphasizes that VC activity is heavily concentrated in the San Francisco Bay Area/Silicon Valley, New York City, and Boston, further limiting opportunities for those outside these hubs. To illustrate his point, the speaker provides the compelling example of RightWay, a healthcare navigation firm that successfully raised over $100 million through multiple funding rounds, including from prominent firms like Tiger Global. He highlights that RightWay's CEO embodied the "prototypical" VC-backed founder, having attended Harvard and worked at Goldman Sachs and in private equity. This background, the speaker contends, was a primary enabler for securing funding, even when the company had a minimal customer base in its early stages. The video then pivots to advocating for bootstrapping as a viable and often superior alternative for the vast majority of entrepreneurs who do not fit the VC club's mold, emphasizing the benefits of maintaining full ownership and control. Key Takeaways: * **Venture Capital as an Exclusive "Club":** Access to venture capital in the healthcare sector is highly restricted, often dependent on an entrepreneur's network, educational background (e.g., Ivy League, MIT, Stanford), or personal connections within the VC community, rather than solely on the merit of their business idea. * **Geographical Concentration of VC:** Healthcare VC funding is predominantly concentrated in three major metropolitan areas: San Francisco/Silicon Valley, New York City, and Boston. Entrepreneurs located outside these hubs face significant disadvantages in securing investment. * **Prior Experience and Connections are Paramount:** Individuals with previous experience in successful startups, direct venture capital roles, or those who are serial entrepreneurs with a proven track record, possess a substantial competitive edge in attracting VC funding. * **Bootstrapping as the Realistic Alternative:** For the vast majority of healthcare entrepreneurs who do not meet the stringent criteria for the "VC club," bootstrapping is presented as the most practical and often more beneficial pathway to building a successful business. * **Preservation of Ownership and Equity:** A major advantage of bootstrapping is that entrepreneurs retain 100% ownership and equity in their company, avoiding the dilution that comes with selling shares to venture capital firms and maintaining full control over their vision and operations. * **The "Two Jobs" Bootstrapping Strategy:** A practical methodology for bootstrapping involves working two full-time jobs concurrently: a primary "day job" to cover living expenses and provide financial stability (40 hours/week), and the startup itself (an additional 40 hours/week). * **Structured Time Management for Bootstrapping:** The speaker suggests a specific time allocation for the startup job: two hours before the day job and two hours after the day job on weekdays (totaling 20 hours), supplemented by 10 hours on Saturday and 10 hours on Sunday (totaling 40 hours for the startup). * **Avoid Wasting Time on Unlikely VC Pursuits:** For entrepreneurs not "in the club," the advice is to avoid expending valuable time and resources on pursuing venture capital, as the probability of success is extremely low and that effort would be better invested directly into building the business. * **Case Study: RightWay's VC Journey:** The example of RightWay, a healthcare navigation firm, illustrates the typical profile of a VC-funded company. Its CEO's background (Harvard, Goldman Sachs, private equity) facilitated raising over $100 million despite a limited customer base in early funding rounds. * **Digital Health Context:** The discussion specifically references "digital health ideas," indicating the relevance of these funding dynamics to technology-driven healthcare startups, which aligns with IntuitionLabs.ai's focus on AI and software solutions in the life sciences. **Examples/Case Studies:** * **RightWay:** A healthcare navigation firm mentioned as a prototypical example of a VC-funded company. Its CEO's background (Harvard, Goldman Sachs, private equity) and successful fundraising journey (seed to Series C, over $100 million from firms like Tiger Global) are highlighted to demonstrate the "club" dynamics of venture capital. **Key Concepts:** * **Venture Capital "Club":** A metaphor used to describe the exclusive and network-driven nature of securing VC funding in healthcare, where personal connections, elite educational backgrounds, and geographical location play a significant role. * **Bootstrapping:** The process of starting and growing a business using only personal finances or operating revenues, without external investment from venture capitalists or angel investors. * **Dilution:** The reduction in the ownership percentage of a company's shares held by existing shareholders due to the issuance of new shares, typically to investors. * **Equity Preservation:** The act of maintaining a higher percentage of ownership in a company, often achieved through bootstrapping, which allows founders to retain more control and a larger share of future profits.

The Changing Dynamic Between Clinical Operations and IT
Healthcare IT Today
/@HealthcareITToday
May 11, 2023
This video explores the profound evolution of IT's role within healthcare, transitioning from a basic infrastructure provider to an indispensable partner in clinical operations and patient care. The discussion highlights the critical need for close collaboration between traditionally siloed IT and clinical departments to drive digital transformation, improve clinician experiences, and ultimately enhance patient outcomes. A central theme is the immense pressure on healthcare IT, which faces increasing technological complexity and stagnant resources, necessitating innovative approaches and third-party support to "do more with less." The interview with Goliath Technologies' CEO emphasizes how end-user experience monitoring, powered by automation and intelligence, provides crucial data-driven insights to proactively manage application performance and bridge the communication gap between IT and clinical leadership. Key Takeaways: * **IT's Integral Role:** IT has become fundamental to every executive-level initiative in healthcare, directly impacting operational efficiency, clinician satisfaction, and patient care, especially with the widespread adoption of EHRs and Telehealth. * **Cross-Functional Imperative:** Successful digital transformation in healthcare demands strong leadership and seamless collaboration between IT and clinical teams, moving beyond purely technical projects to address human-centric goals like clinician satisfaction. * **Resource Scarcity & Complexity:** Healthcare IT departments operate with significantly fewer financial and human resources than their enterprise counterparts, yet must manage highly complex, multi-vendor technology environments, creating a constant challenge to optimize performance. * **Data-Driven End-User Experience:** Proactive monitoring and objective data analytics on end-user application experience are vital for identifying performance bottlenecks, making informed operational adjustments, and improving overall clinician workflow and satisfaction. * **Direct Link to Patient Outcomes & Burnout:** Poor IT performance and application latency directly contribute to clinician frustration and burnout, and can critically delay patient care, underscoring the direct correlation between IT efficiency and clinical effectiveness.

Clinical research vs clinical data management
Global Pharma Academy
/@globalpharmaacademy
May 11, 2023
This video provides an in-depth exploration of the fundamental differences between clinical research and clinical data management, two critical functions within the pharmaceutical and life sciences industries. The speaker begins by establishing that clinical research represents the initial, patient-facing stages of any clinical trial, encompassing phases such as Phase I, Phase II, and Phase III. This phase is characterized by direct interaction with study volunteers, including their recruitment and guidance through the various tests and procedures mandated by the trial protocol. In contrast, clinical data management operates on the data generated during these clinical research phases. While clinical research involves direct patient interaction, clinical data management's primary focus shifts entirely to the handling, processing, and organization of the collected data. The video emphasizes this sequential relationship, where clinical research is responsible for the generation of raw patient data, which then becomes the input for the subsequent data management activities. This distinction highlights a clear division of labor and expertise within the clinical trial ecosystem. The discussion further elaborates on the typical job roles associated with each domain. For clinical research, positions such as Clinical Research Coordinator (CRC) and Clinical Research Associate (CRA) are highlighted, reflecting roles that often involve direct engagement with study participants and trial execution. Within clinical data management, roles like Clinical Data Trainee, Clinical Data Operator, and Clinical Data Coordinator are mentioned, indicating a focus on data-centric tasks such as data entry, validation, cleaning, and database management. The speaker concludes by offering career advice, suggesting that while both fields offer good opportunities, an entry-level professional might prefer to start in clinical research before potentially transitioning into clinical data management, implying a foundational understanding gained from direct trial experience. Key Takeaways: * The core distinction between clinical research and clinical data management lies in their primary focus: clinical research involves direct patient interaction and trial execution, while clinical data management focuses on processing and managing the data generated from those interactions. * Clinical research encompasses the initial phases of clinical trials (Phase I, II, III), where new drugs or treatments are tested on human volunteers. * Key responsibilities within clinical research include the recruitment of study volunteers and guiding them through the specific tests and procedures outlined in the clinical trial protocol. * Clinical data management begins *after* the direct patient interaction, with its main objective being to work with, organize, and ensure the quality of the data collected during the clinical research phase. * The workflow is inherently sequential: clinical research generates the raw patient data, which then flows into clinical data management for processing, cleaning, and validation. * Common entry-level job roles in clinical research include Clinical Research Coordinator (CRC), who manages trial activities at the site level, and Clinical Research Associate (CRA), who monitors trial progress and compliance. * Typical job titles within clinical data management include Clinical Data Trainee, Clinical Data Operator, and Clinical Data Coordinator, all focused on data-centric tasks. * While both career paths are considered valuable, the speaker suggests that starting in clinical research can be a good entry point, potentially providing a foundational understanding of trial execution before moving into data management. * Understanding this clear division of labor is crucial for optimizing operations and ensuring regulatory compliance within the pharmaceutical and life sciences sectors. * The video implicitly underscores the critical importance of accurate and well-managed clinical data, as it forms the basis for regulatory submissions and drug approvals. * For firms specializing in AI and data solutions for life sciences, recognizing these distinct roles highlights opportunities to develop targeted tools for both clinical trial execution support and advanced clinical data processing and analysis. Key Concepts: * **Clinical Research:** The branch of healthcare science that determines the safety and effectiveness of medications, devices, diagnostic products, and treatment regimens intended for human use. It involves direct interaction with study participants and the execution of trial protocols. * **Clinical Data Management (CDM):** A critical process in clinical research that involves the collection, cleaning, and management of data from clinical trials. Its primary goal is to ensure the accuracy, completeness, and validity of clinical data for analysis and regulatory submission. * **Clinical Trial Phases (Phase I, II, III):** The structured stages through which new drugs or treatments are tested in humans to assess safety, dosage, efficacy, and side effects before regulatory approval. * **Volunteer Recruitment:** The process of identifying, screening, and enrolling eligible individuals to participate in a clinical trial. * **Clinical Research Coordinator (CRC):** A professional responsible for the day-to-day management and conduct of clinical trials at a specific site, often serving as the primary point of contact for participants. * **Clinical Research Associate (CRA):** A professional who monitors the progress of clinical trials, ensuring that they are conducted according to the protocol, Good Clinical Practice (GCP), and regulatory requirements. * **Clinical Data Trainee/Operator/Coordinator:** Roles within a clinical data management team responsible for various tasks such as data entry, query generation and resolution, database design, and ensuring data quality.
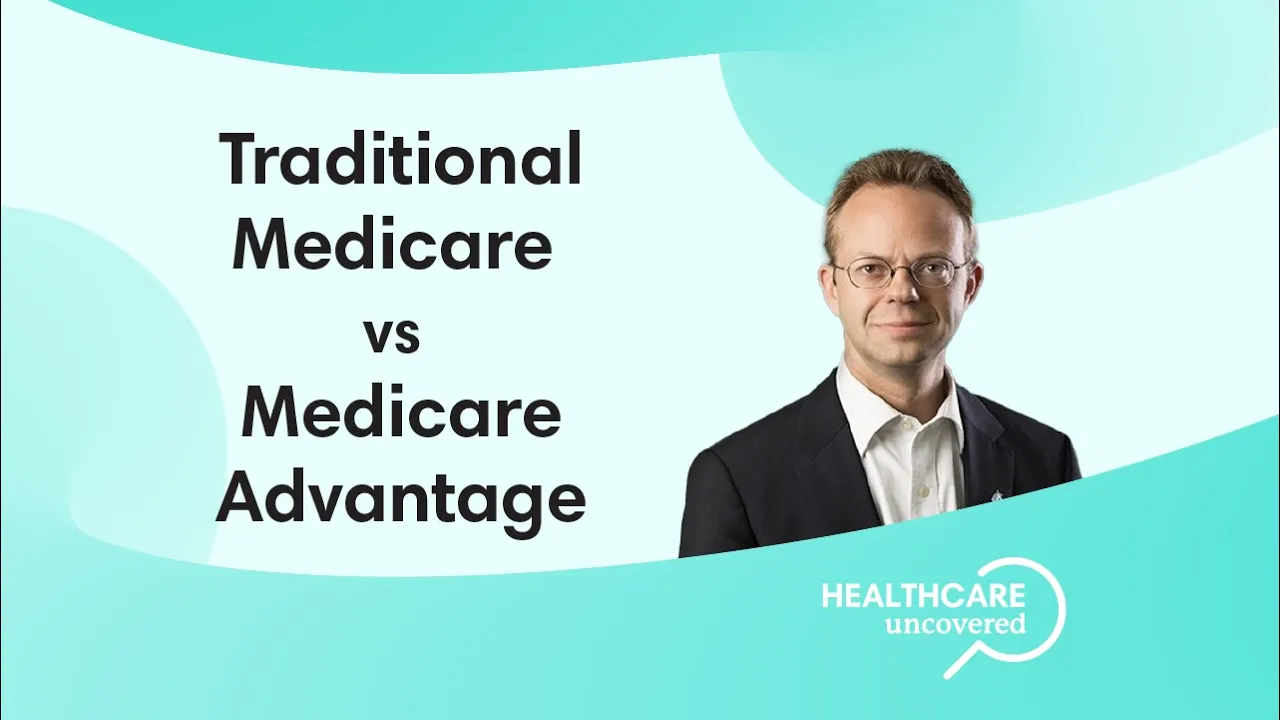
Traditional Medicare vs. Medicare Advantage Explained
AHealthcareZ - Healthcare Finance Explained
@ahealthcarez
May 10, 2023
This video provides a detailed comparison between Traditional Medicare (TM) and Medicare Advantage (MA), focusing specifically on the financial and operational implications for healthcare providers. Presented by Dr. Eric Bricker, a healthcare finance expert, the analysis establishes the critical importance of understanding this distinction, given the rapid market growth of Medicare Advantage. The video highlights that MA has reached 50% market penetration among seniors, equaling Traditional Medicare, and is projected to reach 70% by 2030, making it the dominant insurance structure for the senior population. The core of the analysis rests on differentiating the financial and structural models of the two programs. Traditional Medicare operates on a fee-for-service (FFS) model, where the Centers for Medicare and Medicaid Services (CMS) sets the reimbursement rates. Doctors bill Medicare directly, and payment is made for covered services without significant administrative hurdles. In contrast, Medicare Advantage functions as a hybrid system. CMS provides a fixed, per-patient, per-month (capitated) payment to commercial health insurance companies (such as Blue Cross, United, Cigna, or Aetna). These commercial insurers then negotiate fees with providers to create a specific MA network, which is distinct from their networks for the under-65 population. A critical operational difference highlighted is the administrative burden imposed by Medicare Advantage. While the payment rates for MA networks are generally comparable to TM (paying approximately 95% to 105% of traditional Medicare rates), MA plans frequently mandate prior authorization and referral requirements for medications, tests, procedures, and specialist visits. This is the major point of friction for doctors and their staff, as Traditional Medicare does not impose these requirements. This administrative overhead is characterized as a significant disadvantage of MA plans from the provider's perspective, even though the financial reimbursement is similar. The video concludes by summarizing MA as a growing alternative to TM that, despite offering comparable pay, introduces disliked administrative requirements. Key Takeaways: • **Medicare Advantage Dominance:** Medicare Advantage (MA) has achieved 50% market share among seniors, matching Traditional Medicare (TM), and is projected to grow to 70% of the senior health insurance market by 2030. This shift necessitates that pharmaceutical commercial operations and market access teams prioritize understanding MA dynamics. • **Payer Model Divergence:** Traditional Medicare operates on a fee-for-service (FFS) model with direct CMS reimbursement, offering simplicity in billing. Medicare Advantage utilizes a capitated model, where CMS pays a fixed monthly amount per patient to commercial insurers, who then manage the network and payments. • **Reimbursement Parity:** Despite being managed by commercial insurers, MA networks typically pay providers only 95% to 105% of what Traditional Medicare pays. This near-parity in payment rates, combined with increased administrative work, can disincentivize some providers from participating in MA networks. • **Prior Authorization (PA) Burden:** The most significant operational difference is the mandatory use of prior authorizations and referral requirements within Medicare Advantage plans for medications, tests, and specialist visits. Traditional Medicare does not impose these requirements. • **Impact on Pharmaceutical Access:** The widespread use of prior authorization in MA plans directly impacts pharmaceutical market access and commercial strategy. Pharma companies must develop robust strategies and tools (like AI-powered PA automation) to navigate these payer restrictions and ensure patient access to their products. • **Network Segmentation:** Commercial insurers maintain separate networks for their Medicare Advantage beneficiaries compared to their networks for the under-65 population (employer-sponsored plans). The under-65 networks typically offer much higher reimbursement rates than MA networks. • **Hybrid Insurance Structure:** Medicare Advantage should be conceptualized as a hybrid system, blending the government-funded nature of Medicare with the network management and administrative controls typical of commercial insurance. • **Commercial Operations Optimization:** IntuitionLabs' clients in commercial operations must integrate MA prior authorization requirements into their Veeva CRM strategies and sales training. Sales Ops Assistants powered by Generative AI should be equipped with up-to-date MA plan rules to assist sales teams in addressing access barriers. • **Data Engineering Focus:** The shift to MA generates complex claims data managed by multiple commercial payers. Data engineering efforts must focus on integrating and normalizing this diverse claims data to provide accurate business intelligence regarding drug utilization, PA denial rates, and patient adherence across various MA plans. Key Concepts: * **Traditional Medicare (TM):** A government-run, fee-for-service (FFS) health insurance program for seniors, where CMS sets reimbursement and providers bill directly. It lacks prior authorization or referral requirements. * **Medicare Advantage (MA):** An alternative to TM where CMS pays a fixed, per-member, per-month amount (capitation) to private commercial insurance companies (e.g., United, Cigna) to manage benefits. MA plans require prior authorization and referrals. * **Fee-for-Service (FFS):** A payment model where services are paid for separately, based on the volume of services provided. * **Capitation:** A payment arrangement where a fixed amount is paid to a provider or insurer per patient, regardless of how many services the patient uses. * **Prior Authorization (PA):** A requirement by the insurance plan that a healthcare provider obtain approval before prescribing a specific medication, performing a test, or conducting a procedure. This is a major administrative burden for providers and a key hurdle for pharmaceutical access.

Health Insurance Carriers Are Prescription Drug Pushers
AHealthcareZ - Healthcare Finance Explained
@ahealthcarez
May 7, 2023
This video provides an in-depth exploration of the financial incentives driving health insurance carriers to favor expensive prescription drugs, specifically focusing on how pharmaceutical rebates to Pharmacy Benefit Managers (PBMs) can circumvent the Medical Loss Ratio (MLR) regulations. Dr. Eric Bricker, the speaker, begins by outlining the fundamental financial structure of a fully insured health plan, using a hypothetical group of 100 employees paying $1 million annually in premiums. He details how the MLR mandates that 85% of this premium must be spent on healthcare claims, while 15% can be retained by the carrier for administration and profit. The presentation then meticulously breaks down the claims portion, estimating that approximately 25% of total healthcare spend is allocated to pharmacy, translating to about 21% of the total premium. The core revelation is that a significant portion of this pharmacy spend, estimated at 25% (or even 27% in one cited study), is returned to the insurance carrier or its PBM in the form of "rebates" from pharmaceutical companies. This 5% of the total premium, derived from these rebates, is then effectively added to the carrier's 15% administrative and profit margin, resulting in a minimum 20% retention of the total premium. Crucially, this 5% "escapes" the MLR calculation, directly boosting the carrier's bottom line without being counted as administrative overhead. Dr. Bricker further addresses the common counter-argument that insurance carriers implement prior authorizations (PAs) to control drug costs. He explains that pharmaceutical companies strategically counter these PAs with sophisticated "Market Access Programs," citing Humira Complete as a prime example. These programs provide extensive support, including pre-templated medical necessity letters and appeal forms, to help both patients and physicians navigate and bypass the prior authorization process, ensuring that prescribed medications are approved. This dynamic illustrates the inherent conflict of interest for insurance carriers, who are simultaneously beholden to pharmaceutical companies for rebate payments and to employers for premium payments, leading to a "two masters" scenario that Dr. Bricker argues is unsustainable in the long run. Key Takeaways: * **MLR Loopholes and Rebate Exclusion:** The Medical Loss Ratio (MLR) rule, which mandates that 85% of health insurance premiums be spent on claims, does not fully account for pharmaceutical rebates. These rebates, paid by drug manufacturers to PBMs/carriers, are often not passed through to employers and effectively escape the MLR calculation, boosting carrier profits. * **Financial Incentives for Expensive Drugs:** Health insurance carriers are financially incentivized to have plan members receive more and more expensive medications. Higher drug spend leads to larger rebate payments from pharmaceutical companies, which directly contributes to the carrier's profit margin beyond the MLR cap. * **PBMs as Intermediaries:** Pharmacy Benefit Managers (PBMs), often owned by or closely affiliated with health insurance carriers, play a crucial role in negotiating and collecting these pharmaceutical rebates, which are then retained by the carrier. * **Magnitude of Rebate Payments:** Approximately 25% of all prescription drug spend can come back to the health insurance carrier in the form of pharmaceutical company "rebates," which are essentially commissions. This translates to roughly 5% of the total health insurance premium. * **Impact on Carrier Profit Margins:** The 5% of premium dollars collected as rebates is added to the 15% administrative and profit margin allowed under the MLR, meaning carriers can effectively retain at least 20% of the total premium, a substantial increase to their bottom line. * **Pharma's Market Access Programs:** Pharmaceutical companies actively develop "Market Access Programs" (e.g., Humira Complete) to help patients and doctors navigate and bypass prior authorization requirements for expensive medications. These programs provide step-by-step guidance, pre-templated forms, and direct support to streamline the approval process. * **Conflict of Interest for Carriers:** The business model of health insurance carriers creates a fundamental conflict of interest, as they serve "two masters": pharmaceutical companies (who pay them rebates) and employers (who pay them premiums). This inherent conflict undermines their ability to genuinely control drug costs for employers. * **Regulatory Ambiguity:** While CMS rules (42 CFR 438.8(e)(2)(ii)(B)) dictate that "Prescription drug rebates received and accrued" must be deducted from incurred claims, it remains unclear if other pharmaceutical payments to PBMs, such as administrative fees, formulary placement fees, and market share bonuses, are considered "rebates" under this regulation. * **Importance for Employers:** Employers need to be acutely aware of the complex financial flows within their health plans, particularly regarding PBM contracts and the retention of rebates, to understand the true cost of prescription drugs and advocate for better cost containment. * **Unsustainable Business Model:** Dr. Bricker posits that the underlying business model of health insurance carriers, characterized by serving conflicting masters, is ultimately unsustainable and will likely fail in the long term. Tools/Resources Mentioned: * **42 CFR 438.8(e)(2)(ii)(B):** A specific CMS rule regarding prescription drug rebates and their deduction from incurred claims. * **Law.cornell.edu/cfr/text/42/438.8:** Link to the Cornell Law School's Legal Information Institute for the Code of Federal Regulations. * **Civhc.org/2021/08/13/prescription-drug-rebates/:** A source discussing prescription drug rebates. * **Humirapro.com/patient-support:** Website for Humira Complete, a market access program for the drug Humira. * **AHealthcareZ PBM Money Flow Video:** Another video by the same channel explaining PBM financial flows. Key Concepts: * **Medical Loss Ratio (MLR):** A provision of the Affordable Care Act (ACA) that requires health insurance companies to spend a minimum percentage (typically 80% or 85%) of premium revenue on medical care and quality improvement activities, rather than administrative costs or profits. * **Pharmacy Benefit Managers (PBMs):** Third-party administrators of prescription drug programs for health insurance companies, Medicare Part D plans, large employers, and other payers. They negotiate drug prices, process claims, and manage formularies. * **Pharmaceutical Rebates:** Payments made by pharmaceutical manufacturers to PBMs or health plans in exchange for favorable formulary placement or market share for their drugs. * **Prior Authorization (PA):** A process used by health insurance companies to determine if they will cover a prescribed medication, procedure, or service based on medical necessity criteria. * **Market Access Programs:** Strategies and support systems developed by pharmaceutical companies to help patients and healthcare providers overcome barriers (like prior authorizations) to accessing their prescribed medications. Examples/Case Studies: * **Hypothetical Fully-Insured Group:** A group of 100 employees paying $10,000 per employee per year, totaling $1 million in annual premiums, used to illustrate the MLR and rebate calculations. * **Colorado Employer Study:** A reference to a study of employers in Colorado that found 27% of their total pharmacy spend was returned to the insurance carrier/PBM in rebate payments. * **Humira Complete:** Presented as a specific example of a pharmaceutical company's market access program designed to assist patients and doctors in navigating and bypassing prior authorization processes.

Pharmaceutical company's data migration into a VEEVA CRM system
ProductLife Group
/@productlifegroup4730
May 5, 2023
This video provides an in-depth exploration of the critical process of migrating third-party data into a pharmaceutical company's Veeva CRM system, specifically in the context of a corporate acquisition. The case study focuses on a leading pharmaceutical company that acquired a smaller firm and faced the immediate challenge of integrating the acquired company’s commercial data into its existing Veeva platform. The initial attempt by the client to handle the migration internally, relying primarily on configurational changes, proved insufficient due to the complexity and risk involved, highlighting the necessity of specialized external expertise for such critical enterprise projects. The progression of the successful migration project centered on a highly structured, risk-mitigating methodology. The external experts began by reviewing the client's general design plan for the integration, which allowed them to proactively identify potential gaps and inconsistencies in the proposed approach. This foundational review was immediately followed by crucial data preparation steps: conducting thorough harmonization and risk analyses. These analyses ensured that the disparate data sets from the acquired company could be mapped accurately and safely into the structured Veeva environment while minimizing potential data integrity issues. Following the initial assessments, the consulting team developed a comprehensive action plan and executed a mandatory Data Readiness Assessment (DRA). The DRA served as a gatekeeping step, verifying that the source data was clean, complete, and structured appropriately for the target CRM system. The consultants then assumed full project management responsibility for the entire migration process into the Veeva CRM system. Beyond the technical data transfer, the scope included providing essential training on CRM best practices to the client's teams and executing rigorous bug-fixing procedures to ensure immediate post-migration stability. The ultimate outcome was a seamless data integration achieved with minimal errors and reduced system downtime, coupled with an updated, optimized configuration of the client’s Veeva CRM system aligned with current industry best practices for commercial operations. Key Takeaways: • **M&A Data Integration Complexity:** Mergers and acquisitions in the pharmaceutical sector necessitate complex data migration projects, requiring specialized expertise to integrate the acquired company’s commercial data into the existing enterprise CRM (Veeva) platform without disrupting ongoing operations. • **Limitations of Internal Configuration:** Relying solely on internal IT teams and basic configurational changes is often inadequate for large-scale, high-stakes data migration projects, particularly when dealing with disparate third-party data sets that require extensive harmonization. • **Structured Assessment is Mandatory:** A successful migration must begin with a structured assessment phase, including a detailed review of the general design plan and proactive identification of potential gaps in the proposed integration strategy. • **Prioritize Data Harmonization and Risk Analysis:** Before any data transfer, specialized consultants must conduct thorough harmonization and risk analyses to ensure data integrity, map disparate fields correctly, and mitigate the risk of data loss or corruption in the target Veeva environment. • **The Role of the Data Readiness Assessment (DRA):** A critical step is performing a Data Readiness Assessment (DRA) to formally verify that the source data meets the quality and structural requirements necessary for a successful and compliant integration into the regulated Veeva CRM system. • **Expert Project Management:** End-to-end project management by experienced consultants is vital for coordinating the technical execution, managing timelines, ensuring stakeholder alignment, and maintaining control over the complex migration lifecycle within a regulated industry. • **Post-Migration Optimization:** The project deliverables should extend beyond simple data transfer; they must include updating and optimizing the Veeva CRM configuration based on the latest industry best practices to maximize the system’s utility for the newly integrated commercial operations. • **Minimizing Operational Downtime:** Leveraging external expertise allows pharmaceutical companies to execute complex data migrations with significantly reduced downtime and minimal errors, ensuring business continuity during and immediately following the integration. • **Training and Support for Adoption:** Comprehensive training on the updated CRM configuration and best practices, coupled with immediate post-go-live bug-fixing procedures, is essential for ensuring high user adoption rates and long-term system stability. Tools/Resources Mentioned: * Veeva CRM System (The primary platform for the data migration and integration) Key Concepts: * **Data Harmonization:** The process of standardizing data from different sources (in this case, the acquired company) so that it can be accurately combined and analyzed within a single target system (Veeva CRM). * **Data Readiness Assessment (DRA):** A formal evaluation conducted prior to migration to determine if the source data is sufficiently clean, complete, and structured to meet the requirements of the target system, mitigating risks of failure or data quality issues post-migration. * **Configurational Changes:** Adjustments made within the existing software platform (Veeva CRM) settings, often contrasted with deeper data engineering or custom development required for complex integrations. * **Industry Best Practices:** Standardized, proven methods and approaches for configuring and utilizing enterprise software (like Veeva CRM) within the pharmaceutical industry to ensure efficiency, compliance, and optimal commercial performance.

Analyzing Veeva's Post-IPO Pitch Deck like a VC
Relentless VC
/@relentlessvc
May 4, 2023
This video provides an in-depth analysis of Veeva's Q2 2017 post-IPO pitch deck, offering a venture capitalist's perspective on the company's business model, market strategy, and financial performance. Presented as part of a Venture Capital and Entrepreneurship coursework, the speaker dissects Veeva's positioning as a leading vertical SaaS company in the life sciences industry, contrasting it with horizontal SaaS models like Buffer and Front. The analysis highlights how Veeva achieved its massive scale and profitability by addressing specific, complex needs within the pharmaceutical and biotech sectors. The presentation systematically breaks down Veeva's financials, including its $8 billion market cap at the time, $672 million projected annual revenue, 28% year-on-year ARR growth, and impressive 72% gross margins. A core theme is Veeva's strategy of replacing fragmented, manual processes, particularly those heavily reliant on Excel, within pharmaceutical companies. The video emphasizes the vast opportunity in digitizing critical business operations, citing that 85% of processes in the $1.7 trillion clinical trials industry still involved Excel. Veeva's solution involves a comprehensive suite of integrated products, described as an "industry Cloud for Life Sciences," which eliminates the need for companies to stitch together dozens of disparate point solutions. The analysis further delves into Veeva's extensive product portfolio, comprising 26+ distinct software products across four main lines, all tailored for the life sciences sector. This breadth allows Veeva to achieve significant market penetration (8.4% of an estimated $8 billion total addressable market) and exhibit strong "winner-take-most" characteristics, attributed to expertise network effects inherent in vertical SaaS. The video also highlights Veeva's high average revenue per user (ARPU) of $1.2 million per year, underscoring the critical and complex nature of the software it provides. This high-value offering necessitates a high-touch sales approach, involving industry summits where C-suite executives engage directly. The analysis concludes by showcasing Veeva's exceptional customer retention and expansion rates, with older cohorts buying significantly more products over time, leading to revenue retention numbers reaching 740% by year four and 2200% by year five, demonstrating a powerful land-and-expand strategy. Key Takeaways: * **Vertical SaaS Dominance in Life Sciences:** Veeva exemplifies a highly successful vertical SaaS model, focusing exclusively on the life sciences industry (pharmaceutical and biotech companies) to deliver specialized software solutions. This deep industry focus allows for tailored products and strong market defensibility. * **"Industry Cloud" Strategy:** Veeva's approach is to offer a comprehensive "industry Cloud" with multiple integrated software products rather than single point solutions. This strategy enables them to serve a wide range of needs for the same customer, from CRM to clinical trials management. * **High Profitability and Defensibility:** Even at a large scale, Veeva maintained impressive 72% gross margins and significant profitability. This indicates a highly defensible business model where pricing is linked to the substantial benefit provided to customers, rather than just cost. * **Addressing Manual Process Inefficiencies:** A core value proposition of Veeva is replacing fragmented, manual, and often Excel-driven processes within pharmaceutical companies. The video highlights that a significant portion of critical industry operations, such as clinical trials, still heavily rely on manual Excel work, presenting a massive opportunity for specialized software. * **Vast Opportunity in Digitizing Industries:** The reliance on Excel for critical business processes is not unique to life sciences; it's prevalent across all industries. This presents a long-term opportunity for vertical SaaS startups to identify and replace these cumbersome, fragile, and manual systems with robust software solutions. * **Extensive Product Suite for Cross-Selling:** Veeva's portfolio of over 26 distinct software products across four lines allows for significant cross-selling and upselling opportunities. This extensive suite is a key driver of their exceptional customer lifetime value and revenue retention. * **High Market Penetration and Network Effects:** With an 8.4% market penetration in an $8 billion TAM, Veeva demonstrates the "winner-take-most" characteristics often seen in vertical SaaS. This is partly due to "expertise network effects," where the value of the software increases as more industry participants adopt it and contribute to its specialized knowledge base. * **High Average Revenue Per User (ARPU):** Veeva's ARPU of $1.2 million per year per customer underscores that it sells extremely complex software handling critical tasks for large pharmaceutical companies, impacting thousands of employees and delivering substantial value. * **Strategic High-Touch Sales Model:** Selling million-dollar software products necessitates a high-touch sales approach, including organizing industry summits where C-suite executives and VPs from across the pharma industry gather, fostering direct engagement and relationship building. * **Exceptional Revenue Retention and Expansion:** Veeva exhibits extraordinary revenue retention rates, reaching 740% by year four and 2200% by year five. This indicates that older customers not only stay but significantly expand their spend by adopting more products from Veeva's comprehensive suite over time. * **Long-Term Growth and Enterprise Value:** The company's expectation to reach $1 billion in revenue within three years and having 13 customers paying over $10 million in ARR annually highlights the immense long-term growth potential and enterprise value creation possible with a successful vertical SaaS strategy. Key Concepts: * **Vertical SaaS:** Software as a Service tailored for a specific industry or niche, providing deep functionality and expertise for that sector. * **Horizontal SaaS:** Software as a Service designed for broad application across multiple industries or business functions (e.g., email marketing, project management). * **ARR (Annual Recurring Revenue):** A key metric for subscription-based businesses, representing the predictable revenue from subscriptions over a year. * **Gross Margins:** The percentage of revenue left after subtracting the cost of goods sold, indicating the profitability of a company's core operations. * **Market Penetration:** The percentage of the total addressable market (TAM) that a company has captured with its products or services. * **ARPU (Average Revenue Per User/Customer):** The average amount of revenue generated from each customer over a specific period. * **Expertise Network Effects:** A phenomenon where the value of a product or service increases as more users contribute to and benefit from the specialized knowledge or data embedded within the system, particularly relevant in vertical SaaS. * **Cohort Analysis/Revenue Retention:** A method of tracking customer behavior and revenue generated from groups of customers acquired at the same time, revealing patterns of churn, expansion, and lifetime value. Examples/Case Studies: * **Veeva Systems:** Presented as a prime example of a successful vertical SaaS company, specifically in the life sciences industry, demonstrating how deep industry focus, comprehensive product suites, and effective sales strategies lead to market dominance and high profitability. * **Buffer and Front:** Mentioned as examples of horizontal SaaS companies, used for comparative analysis to highlight the distinct characteristics and business models of vertical versus horizontal SaaS. * **Excel in Clinical Trials:** The video uses the example of 85% of processes in the $1.7 trillion clinical trials industry involving Excel to illustrate the widespread reliance on manual, inefficient systems that vertical SaaS companies like Veeva aim to replace.

When Should You Start A QMS? | Proxima CRO
Proxima Clinical Research
/@proximacro
May 4, 2023
This video addresses a critical operational and regulatory challenge for drug and medical device developers: determining the optimal timing for initiating a Quality Management System (QMS). Presented by a Regulatory Affairs Specialist from Proxima Clinical Research, the content defines a QMS as a comprehensive set of production-related policies, processes, and recordkeeping tools specifically designed to address and prevent quality issues with a product. The speaker establishes the QMS not merely as a best practice, but as a critical prerequisite for operating within all regulated sectors of medtech and biotech, emphasizing its role in ensuring that products meet the stringent standards outlined in the Code of Federal Regulations (CFR). The core recommendation provided is to implement the QMS as early as possible in the product’s development cycle. This early adoption strategy is framed as essential for maximizing the system's utility from the outset, which translates directly into long-term savings in time, effort, and financial expenditure. By establishing the necessary quality infrastructure early, companies can build compliance into their processes rather than attempting costly and complex retrofitting later on. This proactive approach is foundational to maintaining operational efficiency and regulatory integrity. Furthermore, the video stresses that an early-stage QMS is vital for effective risk mitigation. Having a robust system in place before encountering any quality concerns or recalls allows the company to immediately identify and address the main cause of issues, thereby preventing future occurrences. This proactive identification and resolution capability is crucial for maintaining product safety and avoiding severe regulatory consequences. The speaker concludes by noting that while early implementation is ideal, it is never too late to integrate a QMS, and companies that adopt the system at later stages will still realize significant gains in quality control and compliance management. Key Takeaways: * A Quality Management System (QMS) is defined as a critical, comprehensive set of production-related policies, processes, and recordkeeping tools that must be established to ensure product quality assurance and prevent systemic issues throughout the development lifecycle. * The QMS serves as the foundational regulatory prerequisite for all regulated life sciences sectors, including medtech and biotech, specifically designed to ensure that the developed product adheres to the standards mandated by the Code of Federal Regulations (CFR). * The optimal strategy for drug and device developers is to initiate QMS implementation at the earliest possible stage of product development, maximizing the system’s utility and embedding quality into the core operational workflow. * Proactive implementation yields significant operational efficiencies, allowing companies to save substantial time, effort, and financial resources that would otherwise be spent on complex and expensive efforts to retrofit compliance later in the process. * An early-stage QMS is essential for proactive risk mitigation, providing the necessary framework to identify, document, and address the root cause of any quality concerns *before* they escalate into costly product recalls or severe regulatory actions. * The QMS structure is vital for establishing robust data collection protocols and ensuring quality assurance throughout the development cycle, which is crucial for subsequent clinical trials, manufacturing scale-up, and successful regulatory submissions. * The speaker emphasizes that while early adoption is strongly recommended, integrating a QMS is beneficial at any stage; companies that implement the system later will still realize substantial gains in quality control and regulatory adherence. * The system is designed to manage the complexities of regulated product development, highlighting its necessity in maintaining complete audit trails and ensuring adherence to GxP principles (implied by the focus on CFR compliance). * The video, produced by a Contract Research Organization (CRO), implicitly underscores the value of leveraging external expertise, such as knowledgeable CROs, when building and implementing complex and robust quality management systems. Key Concepts: * **Quality Management System (QMS):** A formalized system that documents processes, procedures, and responsibilities for achieving quality policies and objectives. It is essential for ensuring product quality and regulatory compliance in regulated industries. * **Code of Federal Regulations (CFR):** The codification of the general and permanent rules published in the Federal Register by the executive departments and agencies of the U.S. federal government. Compliance with relevant CFR sections (e.g., 21 CFR Part 820 for medical devices or 21 CFR Parts 210/211 for pharmaceuticals) is mandatory for life sciences companies. * **Regulatory Prerequisite:** A mandatory condition or requirement that must be satisfied before a company can legally operate, manufacture, or market a product in a regulated sector.

The Evolution of PBMs with The "PBM Princess", Rachel Strauss of EHIM
Self-Funded
@SelfFunded
May 2, 2023
This video features an in-depth discussion on the Pharmacy Benefits Management (PBM) industry, focusing on the evolution toward transparency, the complexities of pharmaceutical rebates, and strategies for cost containment. Rachel Strauss, the "PBM Princess" of EHIM (recently merged with ProCare RX), provides expert commentary on the market dynamics, emphasizing that PBM selection should prioritize strategy and partnership over simple price quotes. The conversation highlights EHIM's history as a transparent, "no rebate" PBM and how its acquisition by ProCare RX was driven by the need to integrate advanced back-room technology and data capabilities while maintaining a focus on lowest net cost for clients. A central theme explored is the deceptive nature of pharmaceutical rebates, which the speakers refer to as the "seven-letter four-letter word." The core issue is the misalignment of incentives: PBMs set up to maximize rebates are often incentivized to keep the highest-cost medications on the formulary, delaying the adoption of cheaper generics or lower-cost alternatives. The speakers stress that true transparency involves showing clients what is driving the rebates, getting down to the claim level, and ensuring that any collected rebates are passed through quickly to the plan sponsor, rather than being held for months as "float." This discussion underscores the necessity of moving beyond simple discount audits to evaluate a PBM’s underlying formulary philosophy and commitment to lowest net cost. The podcast also addresses the influx of competition, including Mark Cuban’s Cost Plus model, which is noted as essentially a return to spread pricing, albeit transparently disclosed. The analysis suggests that when all factors are accounted for, PBM pricing should generally be within a narrow 3-4% margin of each other, meaning that true savings must come from clinical strategy and effective claims management, not just repricing games. Furthermore, the discussion touches on the volatile specialty drug market, including the pushback against third-party carve-out vendors by manufacturers and the ongoing debate surrounding coverage for new high-cost drugs like Ozempic for weight loss, which forces employers to grapple with philosophical questions about whether obesity is a choice or a disease state. Looking toward the future, the speakers predict that regulatory reporting mandates—specifically those requiring PBMs to track and report dollars and rebates—will expose companies whose earnings are heavily reliant on withholding or manipulating rebate dollars. This increased scrutiny will force the industry to prioritize creativity, collaboration, and the effective use of data. The key for consultants and plan sponsors is to demand actionable insights from their PBM data, moving beyond simple reporting to implement programs that address compliance issues, manage trend, and mitigate risk proactively. ### Key Takeaways * **PBM Selection Must Go Beyond Price:** Due to the complexity of pricing models (spread, PEPM, transaction fees, rebates), most PBMs should be within a 3-4% margin of each other if operating honestly; therefore, selection must be based on clinical strategy, data access, and partnership commitment, not just the lowest initial quote. * **Rebate Misalignment is a Core Problem:** PBM structures designed to maximize rebates often force plans to keep high-cost brand drugs on the formulary, preventing the shift to generics or lower-cost alternatives, which ultimately drives up the total net cost for the client. * **Demand Granular Data Transparency:** Consultants must require PBMs to provide data that shows exactly what is driving the rebates, down to the claim level, to ensure the PBM is truly working toward the lowest net cost for the plan sponsor. * **Beware of RFP Games:** PBMs may use different assumptions or high-impact formulary shifts in RFPs to show misleading projected savings (e.g., saving 30% on an incumbent’s own claim file); consultants must get guarantees and assumptions in writing and conduct post-implementation audits. * **Data Must Be Actionable:** PBM data is useless unless it is turned into actionable insights; PBMs should be proactive in identifying trends (e.g., poor diabetic medication compliance, narcotic usage) and proposing specific, collaborative programs to mitigate risk and manage trend. * **Regulatory Exposure is Increasing:** Upcoming reporting mandates will require PBMs to track and disclose dollars and rebates, potentially exposing companies that rely heavily on rebate earnings they were previously withholding, forcing a shift in financial models. * **Specialty Drug Strategies are Evolving:** The market is seeing pushback against third-party specialty carve-out vendors by manufacturers who argue these programs were intended for members to offset out-of-pocket costs, not for employers to save money, indicating a need for PBMs to integrate specialty management internally. * **Understand PBM Incentives:** When vetting PBM consultants, ensure their incentives are aligned with the client's goals; some PBM consultants charge higher admin fees than the PBM itself, creating a conflict of interest. * **Future Focus on Risk Management:** The future of successful PBMs will be defined by their ability to manage risk, contain cost, and create healthier populations, moving beyond being merely an AWP (Average Wholesale Price) or NADAC (National Average Drug Acquisition Cost) pricing engine. * **Ozempic Coverage Debate:** The decision to cover high-cost anti-obesity drugs like Ozempic is a philosophical and financial choice for self-funded employers, tied to the debate of whether obesity is a disease; this decision must be weighed against the potential reduction in comorbidities and associated medical costs. ### Key Concepts * **Spread Pricing:** The practice where a PBM negotiates a low price with a pharmacy but charges the client a higher, marked-up price, keeping the difference (the "spread") as profit. * **Lowest Net Cost:** A PBM strategy focused on ensuring the total cost of medication to the plan sponsor, after accounting for discounts and any passed-through rebates, is minimized, often prioritizing formulary flexibility over maximizing rebate collection. * **Rebate Aggregation:** The process where a PBM or third-party company pools the claims volume of multiple clients to gain greater negotiating leverage with pharmaceutical manufacturers for rebates. * **Formulary Exclusivity:** A condition in some rebate contracts that requires a specific drug (often high-cost) to be the sole covered option in its therapeutic class, preventing the PBM from shifting to a lower-cost generic or competitor, even if one becomes available. * **Trend Management:** The strategy of controlling the year-over-year increase in pharmaceutical spend for a client, often achieved through clinical programs, formulary design, and member compliance initiatives. ### Examples/Case Studies * **Incumbent PBM Repricing Game:** A consultant stripped a client’s claim file of identifying information and submitted it to the incumbent PBM as a new prospect. The PBM returned a proposal showing 30% savings on the group's own previous year's claims, demonstrating that the PBM was withholding potential savings from the existing client. * **Humira Skyrocketing:** The example of Humira becoming the number one specialty drug in the country was cited not as a result of a sudden epidemic, but as a consequence of aggressive marketing and formulary placement driven by PBM incentives. * **Diabetic Medication Cost Reduction:** A recent example was given where a major insulin product was significantly reducing its cost, highlighting the challenge PBMs face in immediately capitalizing on such reductions if they are locked into rebate contracts for competitive products.

Medical Billing Fraud and Abuse... How to Stop It.
AHealthcareZ - Healthcare Finance Explained
@ahealthcarez
Apr 29, 2023
This video provides an in-depth exploration of medical billing fraud and abuse, highlighting its significant financial impact on healthcare spending and offering actionable strategies for employers to mitigate these issues. The speaker begins by establishing the sheer scale of the problem, citing FBI estimates that 3-10% of all healthcare spending is attributed to fraud and abuse, affecting both Medicare/Medicaid and commercial insurance. To illustrate, a company with 1,000 employees spending $10 million annually on healthcare could be losing between $300,000 and $1 million each year to fraudulent or abusive billing practices. The core mechanism of abusive billing is identified as "upcoding," where healthcare providers strategically apply diagnosis (ICD-10), procedural (CPT), inpatient (DRG), and other codes (Hicks picks) to maximize reimbursement, often operating in a gray area between legitimate and abusive coding. The presentation then critically analyzes the common industry responses to overbilling, specifically insurance denials and prior authorizations. The speaker argues that these tools are largely ineffective and act as "blunt instruments" that often miss fraudulent claims while simultaneously denying legitimate ones. A visual framework is used to demonstrate this misalignment: a rectangle representing all submitted claims, with a segment for fraud and abuse, and another overlapping rectangle for denied/prior authorized claims. The key insight is that these two rectangles do not sufficiently overlap; payers deny many valid claims while still paying out a substantial portion of fraudulent ones. This creates a dual problem where providers feel underpaid by insurers, and insurers feel overbilled by providers, with both perspectives holding some truth. The video progresses to offer practical, employer-centric solutions, emphasizing that the power to address this issue lies with the employers themselves. The financial impact is quantified at $25 to $83 per employee per month (PEPPM), an amount often equivalent to an employer's entire ASO (Administrative Services Only) or TPA (Third-Party Administrator) administrative fees. The speaker challenges employers to apply the same level of scrutiny to fraud and abuse as they do to negotiating these admin fees. Key strategies include becoming self-funded to gain direct control over claims review, rigorously evaluating the effectiveness of carriers' fraud, waste, and abuse programs, and shifting away from traditional fee-for-service models towards non-claims-based healthcare services like on-site clinics or direct contracting. The video concludes by stressing that this is a long-standing problem (over 25 years) that will persist unless employers actively intervene, empowering them to take decisive action. Key Takeaways: * **Significant Financial Drain:** Medical billing fraud and abuse account for an estimated 3-10% of all healthcare spending, translating to substantial financial losses for employers (e.g., $300K-$1M annually for a 1,000-employee company). * **Understanding Upcoding:** "Upcoding" is the primary form of abusive billing, involving the strategic application of medical codes (ICD-10, CPT, DRG, Hicks picks) to maximize reimbursement, often existing in a gray area between correct and abusive practices. * **Ineffectiveness of Traditional Controls:** Insurance denials and prior authorizations are largely ineffective at catching fraudulent claims; they often deny legitimate claims while still paying out a significant portion of fraudulent ones. * **Misaligned Payer Efforts:** The current system results in payers denying "good" claims that should be paid, while simultaneously failing to catch "bad" (fraudulent/abusive) claims, leading to a lose-lose scenario for both providers and payers. * **Substantial Employer Cost:** Billing fraud and abuse cost plans approximately $25 to $83 per employee per month (PEPPM), an amount comparable to an entire ASO or TPA administrative fee, an area typically subject to intense scrutiny. * **Employer Empowerment:** Employers have the power to address this issue and should assume they are paying fraudulent claims until proven otherwise, as the problem often occurs unbeknownst to them. * **Strategy 1: Become Self-Funded:** Moving to a self-funded model allows employers to directly review their own claims, gaining greater control and insight into billing practices. * **Strategy 2: Scrutinize Carrier Effectiveness:** Employers should actively double-check the effectiveness of their insurance carriers' fraud, waste, and abuse detection programs, as current processes are often inadequate. * **Strategy 3: Utilize Lower-Threshold TPAs:** Consider working with Third-Party Administrators (TPAs) that have a lower threshold for reviewing claims (e.g., $3,000-$5,000) compared to major carriers ($10,000-$15,000), increasing the likelihood of identifying smaller fraudulent claims. * **Strategy 4: Shift from Fee-for-Service:** Transitioning away from traditional fee-for-service models towards non-claims-based healthcare services, such as on-site or near-site clinics and direct contracting, can reduce opportunities for billing abuse. * **Historical Persistence:** Medical billing fraud and abuse is a long-standing problem, having persisted for over 25 years, indicating that it will continue unless active and deliberate measures are taken to combat it. Key Concepts: * **Upcoding:** The practice of assigning a higher-paying diagnostic or procedural code than the service actually rendered, to increase reimbursement. * **ICD-10 Codes:** International Classification of Diseases, 10th Revision, used for diagnosis coding. * **CPT Codes:** Current Procedural Terminology, used for procedural coding. * **DRG Codes:** Diagnosis-Related Group, used for inpatient services only to classify hospital cases into groups expected to have similar hospital resource use. * **Hicks picks codes:** Healthcare Common Procedure Coding System, used for services, procedures, and equipment not covered by CPT codes. * **Fee-for-service:** A payment model where services are unbundled and paid for separately, incentivizing volume over value. * **Self-funded plans:** Health insurance plans where the employer assumes the financial risk for providing healthcare benefits to its employees. * **ASO/TPA Admin Fees:** Administrative Services Only (ASO) or Third-Party Administrator (TPA) fees are charges for managing health plan administration without assuming financial risk. * **Prior Authorization:** A requirement from a health insurance company that a healthcare provider obtain approval before providing a specific service or medication. * **Denials:** The refusal by an insurance company to pay for a healthcare service or claim.

Why the Money in Healthcare is SO Important... Behind the Scenes with Healthcare Uncovered
AHealthcareZ - Healthcare Finance Explained
@ahealthcarez
Apr 26, 2023
This video provides an in-depth exploration of the critical lack of financial understanding among physicians and the systemic issues contributing to the opacity and complexity of the U.S. healthcare system. Dr. Eric Bricker, an internist and healthcare finance expert, partners with Nomi Health to launch the "Healthcare Uncovered" series, aiming to democratize information on healthcare finance for medical professionals. He emphasizes that while doctors are highly educated in medicine, they receive virtually no training in the economics of healthcare, leaving them vulnerable to financial exploitation and hindering their ability to advocate effectively for their patients and practices. Dr. Bricker draws on his extensive experience, including founding Compass Professional Health Services, a company that helped 1.8 million people navigate the U.S. healthcare system, from doctors' visits to hospital stays and insurance complexities. He asserts that healthcare, despite its perceived intricacy, becomes "incredibly easy to understand" once one grasps the underlying incentives driving the behavior of various stakeholders—insurance companies, hospitals, doctors, and the government. He posits that money is a major, though not sole, incentive, and understanding its flow is key to comprehending the system's current state and identifying pathways for improvement by altering incentive structures. He even frames misaligned incentives within healthcare as a "public health threat," akin to environmental hazards. The discussion delves into the root causes of this financial illiteracy and systemic dysfunction. Dr. Bricker highlights the "complete vacuum of non-information" in medical education regarding how doctors get paid, how patients pay, and how hospitals are compensated. Furthermore, he points to a significant "lack of transparency" and "lack of competition" across the healthcare industry. He explains that consolidation among hospitals, health insurance companies (decreasing from dozens to just three or four major players), and Pharmacy Benefits Managers (PBMs) has been fueled by historically low interest rates and cheap debt, enabling mergers that subsequently lead to increased prices and reduced accountability. This absence of competitive pressure allows organizations to cut corners and avoid providing full, transparent answers. Ultimately, Dr. Bricker aims to empower physicians by helping them understand these dynamics. He acknowledges the widespread disheartening experiences among doctors but believes that by comprehending the "why" behind systemic issues and recognizing their inherent power, physicians can take "small, concrete steps" to improve patient care and their professional lives. The "Healthcare Uncovered" series is designed to provide these initial "training wheels," enabling doctors to begin their journey toward financial literacy and systemic change, fostering a more transparent and patient-centric healthcare environment. Key Takeaways: * **Critical Gap in Physician Financial Literacy:** Doctors receive virtually no formal training in healthcare finance during medical school or residency, leading to a profound lack of understanding regarding how they are paid, how patients pay for care, and how hospitals are compensated. This "vacuum of non-information" leaves them unprepared for the economic realities of their profession. * **The "Incentives" Framework for Understanding Healthcare:** The U.S. healthcare system, though complex, can be demystified by understanding the financial incentives that drive the behavior of key players, including insurance companies, hospitals, doctors, and the government. Comprehending these money flows is crucial for identifying systemic issues and pathways for change. * **Misaligned Incentives as a Public Health Threat:** Dr. Bricker views the current incentive structures within healthcare as detrimental to patient care and professional well-being, likening them to a public health hazard that needs to be addressed by physicians. * **Lack of Transparency and Competition:** A significant problem in healthcare is the pervasive lack of transparency and robust competition among providers, insurers, and other entities. This absence of competitive pressure allows organizations to operate with less accountability, leading to higher costs and less clear information. * **Impact of Industry Consolidation:** The healthcare sector has experienced extensive consolidation among hospitals, health insurance companies (reducing from dozens to a few major players), and Pharmacy Benefits Managers (PBMs). This consolidation, ironically fueled by cheap debt and low interest rates, leads to reduced competition, increased prices, and a further erosion of transparency. * **Physician Empowerment Through Knowledge:** Despite feeling disheartened by the system, physicians possess tremendous power. By understanding the underlying financial and structural dynamics, they can identify actionable, small steps to improve patient outcomes, enhance their professional careers, and advocate for systemic change. * **Simplifying Complex Healthcare Information:** The "Healthcare Uncovered" series aims to break down complex healthcare finance topics into understandable language, avoiding jargon, to make this critical information accessible to busy physicians who may not know where to start. * **Historical Context of Consolidation:** The video highlights a historical trend where the number of major health insurance companies has drastically decreased over the past 20-30 years, illustrating the long-term impact of consolidation on market dynamics. * **The Role of Debt in Consolidation:** Low interest rates and readily available cheap debt have inadvertently fueled consolidation across healthcare sectors, enabling mergers and acquisitions that subsequently allow consolidated entities to raise prices due to reduced competition. * **Actionable Steps for Physicians:** The initiative encourages physicians to take "baby steps" in learning about healthcare finance, asserting that even small increases in understanding can open up a world of possibilities for positive change in their practices and for their patients. Tools/Resources Mentioned: * **Nomi Health:** A partner in creating the "Healthcare Uncovered" series, focused on bringing transparency to healthcare finance. * **Healthcare Uncovered:** A video series designed to educate physicians and others about healthcare finance. * **Compass Professional Health Services:** Dr. Bricker's former company, which provided healthcare navigation services to employers and individuals. Key Concepts: * **Healthcare Finance:** The economic aspects of healthcare, including how services are paid for, how providers are compensated, and the financial flows within the system. * **Incentives:** The financial or non-financial motivators that influence the decisions and behaviors of individuals and organizations within the healthcare system. * **Transparency:** The degree to which information about healthcare costs, quality, and financial dealings is openly available and understandable to the public and stakeholders. * **Competition:** The presence of multiple providers or payers vying for business, which typically drives down prices and improves quality and transparency. * **Consolidation:** The process by which smaller companies merge or are acquired by larger ones, leading to fewer, larger entities dominating a market. * **Pharmacy Benefits Manager (PBM):** An intermediary between pharmaceutical manufacturers, pharmacies, and health insurance plans that manages prescription drug benefits. Examples/Case Studies: * **Compass Professional Health Services:** Dr. Bricker's company that grew to serve over 2,000 employer clients and 1.8 million people, demonstrating the need for and impact of healthcare navigation services. * **Consolidation of Health Insurance Companies:** The reduction from "dozens" of major health insurance companies 20-30 years ago to only "three or four" today, illustrating the dramatic impact of market consolidation. * **Consolidation of PBMs:** Mentioned as another sector where consolidation has reduced choices and competition.

How to Find Money in Medical Bill Errors - Zoe Holderness - Co-Founder of Slingshot
Self-Funded
@SelfFunded
Apr 25, 2023
The podcast features an interview with Zoe Holderness, CTO and co-founder of Slingshot, a software company dedicated to auditing medical bills for self-funded employer groups. The discussion centers on the prevalence of medical billing errors, the administrative complexity of the U.S. healthcare system, and how Slingshot leverages software engineering and data analysis to achieve significant cost savings for both employers and their employees. Holderness details her personal journey, which began after successfully fighting an overcharged gynecology bill, leading her and her co-founder to recognize a scalable business opportunity in automating the auditing and recoupment process. Slingshot’s core value proposition is its ability to perform continuous, post-adjudication audits of every claim that flows through an employer’s plan data stream. By integrating with data sources like TPAs or partners like navMD, Slingshot ingests claims data (including CPT codes, diagnosis codes, and procedure codes) and runs it through proprietary algorithms to identify objective errors, such as incorrect modifiers, unbundling (charging for components separately when a single, cheaper code exists), or pattern abuse (e.g., a provider consistently billing maximum severity levels). This post-adjudication approach is critical, as it eliminates "noise" and stress for the member; the provider has already been paid, and Slingshot’s case managers only contact the member when a check is being sent back, resulting in a high Net Promoter Score. Slingshot reports a 70% recoupment rate on identified errors, translating to an average savings of 5% to 10% of the medical plan spend. Beyond claims auditing, Slingshot addresses another major administrative failure: the underutilization of financial assistance policies at non-profit hospitals. Non-profit hospitals are legally required to offer community benefits, often including financial assistance for patients whose household income falls below a certain threshold—sometimes as high as 400% of the federal poverty level (up to $120,000 for a family of four). Slingshot uses employer income data to proactively identify members who qualify for this assistance. They then manage the complex application and follow-up process with the hospital, ensuring the member’s out-of-pocket portion is written off. This service is enhanced by saving member financial information, allowing for rapid re-application if the member or a family member requires subsequent hospital visits, significantly reducing the administrative burden on employees. Holderness emphasizes that the ability to perform this service at scale is a recent development, largely driven by the transparency requirements introduced by the Consolidated Appropriations Act (CAA), which mandates that employers have access to their claims data. Her long-term "moonshot" vision is to leverage transparency and technology to reduce the cost of healthcare for the U.S. consumer by 30%, viewing Slingshot’s current audit and assistance services as foundational tools necessary to achieve this systemic change. The company’s success hinges on combining technical expertise (software engineering and machine learning) with the willingness to perform the necessary human follow-up and dispute resolution with providers. Key Takeaways: * **Leveraging Post-Adjudication Audits for Member Experience:** Slingshot operates retrospectively (post-adjudication), meaning claims are audited after they have been paid. This strategy minimizes member disruption, as the first contact a member receives is often notification of a refund check, leading to a positive perception of the solution and eliminating the stress of balance billing. * **Quantifiable Savings from Coding Errors:** Slingshot’s rule-based algorithms identify objective billing errors, such as "unbundling" (using multiple codes for a procedure that should be covered by a single, cheaper code) or incorrect modifier usage. These audits yield a high success rate, with approximately 70% of disputed claims resulting in recoupment, saving an average of 5% to 10% of total medical plan spend. * **Data Access as a Prerequisite for Action:** The ability for self-funded employers to access and utilize their claims data (often via CSV files or TPA feeds) is the essential first step for any actionable cost-saving solution. The Consolidated Appropriations Act (CAA) has been instrumental in making this data accessible, enabling data-driven solutions in healthcare. * **The Power of Continuous Auditing:** While retrospective audits (looking back up to a year) are possible, continuous auditing (receiving and processing claims data weekly) yields the highest success rate because providers are more likely to correct recent errors than those from many months prior, which improves the 70% recoupment rate. * **Financial Assistance Policies are Underutilized:** Non-profit hospitals are mandated to offer financial assistance, often covering patient out-of-pocket costs for families earning up to 400% of the federal poverty level (e.g., $120,000 for a family of four). This resource is poorly advertised, and employers should proactively seek solutions to help members access it. * **Automating Financial Assistance Applications:** Slingshot automates the complex process of identifying eligible members, confirming their income, applying for assistance, and performing the necessary follow-up with the hospital. This transforms a task that typically takes an individual 20 hours into a low-work confirmation process for the employee. * **The Need for Human Case Management in Dispute Resolution:** While software identifies the errors and patterns, the critical step of dispute resolution—contacting the provider, presenting the CPT guideline rationale, and ensuring the money is sent back—requires experienced case managers and can take two weeks to three months. * **Focus on Objective, Rule-Based Errors:** Slingshot focuses exclusively on errors that are highly objective and rule-based (e.g., NCCI rules, CPT guidelines). This ensures the audits are defensible and leads to a higher recoupment rate, as opposed to subjective disputes. * **The Moonshot Vision for Healthcare Cost Reduction:** The long-term goal is to leverage transparency and technology to achieve a 30% reduction in healthcare costs for the U.S. consumer, suggesting that the current level of administrative waste and error represents a massive, addressable portion of healthcare spending. * **Machine Learning for Abuse Detection:** The platform uses machine learning algorithms to detect patterns of abuse, such as a provider consistently billing for the highest level of severity (Level 5 E/M codes) when the median level of care (Level 3) would be expected, providing actionable intelligence to the employer. Tools/Resources Mentioned: * **navMD:** A data integration partner that provides existing relationships and data streams for claims data access. * **Y Combinator:** The accelerator program that provided funding, mentorship, and business education to Slingshot's founders. Key Concepts: * **Unbundling:** A billing error where a provider uses multiple procedure codes to describe services that should have been covered by a single, comprehensive code, often resulting in overcharging. * **Post-Adjudication Audit (Retrospective Audit):** Reviewing medical claims after they have been processed and paid out by the payer (TPA/insurer). This approach minimizes member disruption and stress. * **400% of Federal Poverty Level (FPL):** A common threshold used by non-profit hospitals for determining eligibility for financial assistance, which can cover the patient's out-of-pocket portion of the bill. * **Consolidated Appropriations Act (CAA):** Legislation that, among other things, strengthened employers' fiduciary duty and access to their claims data, enabling data-driven solutions like Slingshot. Examples/Case Studies: * **Founder's Personal Experience:** The company was founded after Zoe Holderness successfully reduced her own gynecologist bill by 40-50% after requesting an itemized bill, reviewing CPT codes, and requesting four separate audits. * **Hamburger Analogy for Unbundling:** Unbundling is described as being charged for the bun, lettuce, and tomato separately, rather than just the single price of a hamburger, illustrating how multiple codes are used to describe a single service. * **ER Level 5 Severity Pattern:** Slingshot’s machine learning algorithms look for patterns, such as an Emergency Room provider consistently billing for the highest level of severity (Level 5), which is statistically unlikely given the median level of care typically required in an ER setting.

Veeva Vault RIM Health Check
Daelight Solutions
/@daelightsolutions2128
Apr 24, 2023
The video introduces the "Veeva Vault RIM Health Check," a specialized consulting service designed to help pharmaceutical and life sciences organizations maximize the utility and regulatory compliance of their existing Veeva Vault Regulatory Information Management (RIM) environment. The service is positioned as a tool to unlock the full potential of the system by empowering both business and IT stakeholders—specifically the RIM System Administrator and System Owner—to effectively manage regulatory data and ensure continuous compliance with evolving requirements. The core value proposition is to evaluate the current Vault configuration and implementation against actual business needs, end-user experience, and usage patterns. The presentation highlights several common organizational pain points that necessitate a health check. These indicators include low user adoption rates, which suggest a disconnect between the system and end-user workflows, and business processes that have evolved beyond the capabilities of the current Vault configuration. Furthermore, many organizations find that the complexity of their business has outgrown their initial Vault security setup, leading to potential compliance risks. The service also addresses the challenge of underutilization, helping clients determine how to best leverage the latest application features released in recent Vault updates to gain efficiency. The health check is described as a flexible offering, adapting to the specific needs and concerns of the client, recognizing the unique nature of every Vault RIM implementation. The comprehensive evaluation process involves expert consultants assessing several critical dimensions of the RIM system. These key areas include a deep dive into the effectiveness of current state business processes and an analysis of actual RIM feature usage. The consultants also evaluate the impact of existing training programs and review operational metrics captured through reports, dashboards, and key performance indicators (KPIs). Crucially, the assessment extends to technical and compliance areas, scrutinizing the Vault's security configuration, overall system performance, operational procedures, and the critical Computer System Validation (CSV) strategy. A significant emphasis is placed on Vault governance, ensuring the long-term sustainability and controlled evolution of the system. By systematically evaluating these functional and technical areas, the health check provides organizations with the necessary support and resources to succeed with Vault RIM. The ultimate outcome is a clear roadmap for optimization, ensuring the system is configured for maximum efficiency, robust compliance, and high user satisfaction. This proactive review helps organizations identify configuration gaps, streamline inefficient processes, and mitigate potential regulatory risks, thereby securing their ability to achieve overarching regulatory goals in a dynamic industry landscape. Key Takeaways: • **Regulatory Data Optimization:** The primary goal of the health check is to ensure the effective use and management of regulatory data within Veeva Vault RIM, thereby maintaining continuous compliance with ever-changing regulatory requirements. • **Indicators of System Underperformance:** Key warning signs that necessitate a health check include low user adoption, business processes that are no longer supported by the current configuration, outdated security setups, and failure to utilize new application features. • **Targeted Stakeholder Support:** The service is specifically designed to support the RIM System Administrator and System Owner by providing an objective, expert evaluation of the Vault configuration relative to current business demands and end-user satisfaction. • **Process Alignment Assessment:** Consultants evaluate the effectiveness of current state business processes to ensure they are properly mapped within the Vault RIM system, avoiding situations where system limitations dictate inefficient workflows. • **Feature Usage Analysis:** The evaluation includes a review of which core RIM features are actually being used by the organization, identifying areas where training or configuration changes could unlock untapped system value. • **Security and Complexity Review:** A critical component is assessing the Vault's security configuration to ensure it remains robust enough to manage the increasing complexity of the organization's data and operational needs. • **Operational Metrics Scrutiny:** The health check analyzes existing reports, dashboards, and metrics to validate that the organization is capturing accurate, actionable data necessary for measuring performance and regulatory impact. • **Computer System Validation (CSV) Strategy:** The review includes an essential assessment of the organization’s CSV strategy, which is vital for maintaining GxP compliance and ensuring all system changes are validated according to regulatory standards (e.g., 21 CFR Part 11). • **Performance and Operational Procedures:** The service evaluates overall system performance to ensure speed and reliability, alongside a review of operational procedures necessary for day-to-day system management and maintenance. • **Vault Governance Framework:** A focus on Vault governance ensures the establishment of robust, long-term frameworks for system control, change management, and sustainable compliance. Tools/Resources Mentioned: * Veeva Vault RIM (Regulatory Information Management) Key Concepts: * **Veeva Vault RIM:** A specialized cloud-based platform utilized by life sciences companies for managing global regulatory submissions, registrations, and correspondence. * **Vault Governance:** The established set of rules, policies, and procedures that dictate how the Veeva Vault system is managed, maintained, and evolved over time to ensure data integrity and compliance. * **CSV Strategy (Computer System Validation):** The required regulatory process for documenting that a computer system performs consistently and accurately according to its specifications, essential for systems handling GxP data.
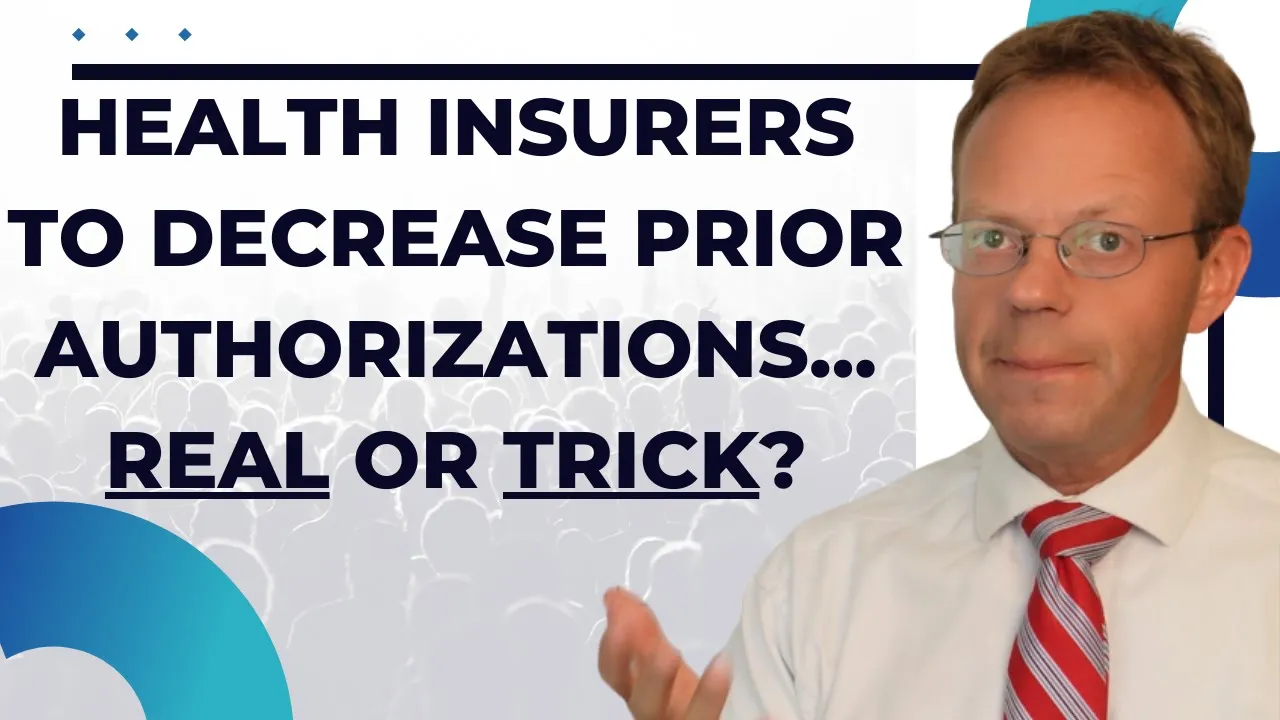
Health Insurance Denials and Prior Authorizations--Impact on Patients, Doctors and Wall Street.
AHealthcareZ - Healthcare Finance Explained
@ahealthcarez
Apr 23, 2023
This video provides an in-depth exploration of the true financial implications of health insurance prior authorizations and denials, challenging the perceived impact of announced reductions by major insurers like UnitedHealthcare. The speaker, Dr. Bricker, leverages the Pareto Principle (the 80/20 rule) to demonstrate how a seemingly significant decrease in the *number* of prior authorizations may have a minimal effect on the *total dollar amount* of claims requiring authorization, thereby maintaining tight control over medical loss ratios for insurance companies. The presentation progresses from an initial debunking of insurer claims to a detailed analysis of high-cost medical areas, the strategic motivations of health insurers, and the ultimate financial burden placed on patients and healthcare providers. Dr. Bricker meticulously explains the Pareto Principle, illustrating that approximately 80% of the total claim spend requiring prior authorization is concentrated within only 20% of the actual prior authorization requests. This stratification is further detailed, showing that the top 4% of prior authorizations account for 50% of the money, while the bottom 20% accounts for merely 1%. This principle is then applied to UnitedHealthcare's pledge to reduce prior authorizations from 13 million to 10 million annually (a 23% reduction). The video argues that this reduction, if applied to the low-dollar, high-volume prior authorizations, would result in barely more than a 1% decrease in overall payments to providers, rendering the reduction largely financially insignificant from the insurer's perspective. The discussion then shifts to identifying the specific high-dollar medical procedures that drive the majority of prior authorization costs. These include orthopedic and neurosurgeries (e.g., joint replacements, spine surgeries, scoliosis), organ transplants (predominantly kidney transplants), and oncology treatments (surgery, chemotherapy, radiation for common cancers like breast, colon, prostate, lung), as well as certain cardiac procedures (pacemakers, ICDs, stress tests, echocardiograms). These procedures often cost hundreds of thousands of dollars, making their prior authorization crucial for insurers. The video concludes by revealing that insurance companies intentionally maintain prior authorizations and denials as a "thermostat" to tightly control their Medical Loss Ratio (MLR), ensuring it stays within the Affordable Care Act's mandated 80-85% range. This control is so precise that even during periods of significant healthcare utilization shifts, such as the COVID-19 pandemic, major insurers like UnitedHealthcare maintained remarkably consistent MLRs, demonstrating their ability to adjust claim payments through these mechanisms. Key Takeaways: * **The Pareto Principle in Healthcare Finance:** The 80/20 rule is critical for understanding healthcare costs; 80% of the financial impact of prior authorizations comes from only 20% of the total number of authorizations. Similarly, 80% of a health plan's costs are driven by 20% of its members. * **Deceptive Prior Authorization Reductions:** A reduction in the *number* of prior authorizations (e.g., UnitedHealthcare's 23% decrease) does not equate to a proportional reduction in the *dollar amount* of claims impacted. Such reductions often target low-cost, high-volume procedures, leading to a minimal financial impact (potentially just over 1% of total payments). * **High-Dollar Prior Authorization Categories:** The vast majority of claim spend requiring prior authorization is concentrated in expensive clinical areas such as orthopedic and neurosurgeries (joint replacements, spine surgeries), organ transplants (especially kidney), oncology treatments (cancer surgeries, chemo, radiation), and complex cardiac procedures (pacemakers, ICDs). * **Strategic Use of Denials and Prior Authorizations:** Health insurance companies intentionally keep denials and prior authorizations in contracts to serve as a "thermostat" for tightly controlling their Medical Loss Ratio (MLR), which is the percentage of premium revenue spent on claims. This control is crucial for meeting regulatory requirements (ACA) and satisfying Wall Street analysts. * **Consistent Medical Loss Ratios:** Despite natural variability in medical care and claims submissions (e.g., higher claims in Q4 due to met deductibles, or shifts during a pandemic), major insurers demonstrate remarkably consistent MLRs quarter-over-quarter. This consistency is achieved by actively adjusting claim payments through denials and prior authorizations. * **Impact on Provider Revenue:** Prior authorizations and denials impose a significant financial burden on doctors and hospitals, costing them 16-25% of their revenue to manage these processes and fight for payment. This constricts their cash flow and operational efficiency. * **Patient Financial Responsibility:** Patients are ultimately financially responsible for care if their insurance company denies payment. The term "medical policy" used by insurers is often deceptive, masking what is effectively a document outlining non-coverage, leading to delayed or denied access to care. * **Quality of Engagement Over Quantity:** When engaging a patient population to control costs, it's crucial to focus on the "quality" (who is being engaged) rather than just the "quantity." Engaging the bottom 60% of plan members, who only drive 8% of total spend, will have almost zero impact on overall plan costs. * **Implications for Pharma and Med Device:** Pharmaceutical and medical device companies need to understand the PA landscape for their products. The prevalence and financial impact of PAs directly affect market access, patient adherence, and commercial strategies for high-cost drugs and devices, especially in areas like oncology, specialty drugs, and complex surgical implants. * **Data-Driven Market Access:** Leveraging data engineering and business intelligence to analyze PA trends, denial rates, and their correlation with specific products or clinical areas can provide critical insights for pharma companies to optimize market access strategies and patient support programs. Key Concepts: * **Pareto Principle (80/20 Rule):** An observation that roughly 80% of effects come from 20% of causes. In healthcare, this means a small percentage of prior authorizations or plan members account for a large percentage of costs. * **Prior Authorization (PA):** A requirement by some health insurance plans for a healthcare provider to obtain approval from the plan before performing a service or prescribing a medication. * **Denials:** When an insurance company refuses to pay for a medical service or prescription. * **Medical Loss Ratio (MLR):** The percentage of premium revenue that health insurers spend on medical care and quality improvement activities. The Affordable Care Act (ACA) mandates that insurers spend 80-85% of premiums on claims. * **Elective Surgeries:** Non-emergency surgical procedures that can be scheduled in advance, often subject to prior authorization. Examples/Case Studies: * **UnitedHealthcare's PA Reduction:** The video analyzes UnitedHealthcare's promise to decrease prior authorizations from 13 million to 10 million per year, demonstrating how this 23% reduction in count would likely result in a minimal (barely >1%) financial impact due to the Pareto Principle. * **High-Cost Procedures:** Specific examples include hip/knee replacements, spine surgeries, scoliosis surgeries, kidney transplants, and treatments for breast, colon, prostate, and lung cancers, as well as cardiac devices like pacemakers and ICDs. * **COVID-19 Impact on MLR:** The video highlights how UnitedHealthcare maintained remarkably consistent MLRs during Q3 and Q4 of 2021 and Q1 of 2022, despite the pandemic causing a decrease in elective surgeries and subsequent rebound, illustrating the insurer's tight control through PAs and denials. Tools/Resources Mentioned: * **Becker's ASC:** A source cited for news on UnitedHealthcare's prior authorization cuts. * **QIMacros.com:** A resource mentioned for understanding the Pareto Principle and Pareto charts. * **Dr. Bricker’s Book:** "16 Lessons in the Business of Healing," available at ahealthcarez.com.

Agatha eTMF, QMS, Document Management Software for life sciences - Biotech - Medical device - Pharma
Agathalife EN
/@Agathalife_EN
Apr 20, 2023
This video provides an overview of Agatha, an electronic document management (EDM) suite specifically designed for the highly regulated life sciences sector, including pharmaceutical, biotech, and medical device companies. The primary goal of the platform is to help these organizations scale operations, streamline processes, and accelerate the time-to-market for their products by establishing a centralized, compliant, and paperless document repository. The presentation details how Agatha moves beyond traditional or "legacy platforms" by offering a full-featured, cloud-based solution focused on ease of use and cost-effectiveness. The core functionality of Agatha centers on controlling the entire document lifecycle, from initial drafting and review through distribution and final archiving, ensuring a "single source of truth" for all critical documentation. The suite is modular, offering specialized applications such as Agatha Clinical eTMF (Electronic Trial Master File), Agatha Remote ISF (Investigator Site File), Agatha SOP, Agatha Quality, and Agatha Regulatory. This specialization allows the platform to cater directly to the needs of clinical operations and quality management departments, which are central to regulatory success in the life sciences. A critical component of Agatha’s value proposition is its robust regulatory compliance and guaranteed inspection readiness 365 days a year. The platform achieves this through comprehensive features like full traceability and detailed audit trails. Explicitly, Agatha applications are compliant with major global regulations, including FDA 21 CFR Part 11, GDPR, and EU Annex 11, which ensures secure and legally sound electronic signatures. Furthermore, the system is designed to embed quality systems into the business structure by allowing users to build customizable workflow and lifecycle templates. These templates automatically route necessary actions to the appropriate personnel at the correct time, facilitating proactive quality control. The platform also features tools to quickly view training statuses, enabling organizations to identify and address non-compliance issues efficiently. The overall approach is to provide a clean, user-friendly interface where personnel can easily complete tasks, search documentation, track metrics, and build reports from a central dashboard. Key Takeaways: • Agatha is a dedicated electronic document management (EDM) suite tailored for the life sciences industry (Pharma, Biotech, Medical Device), focusing on streamlining clinical operations and quality management (QMS). • The platform functions as a centralized, paperless repository that manages the complete document lifecycle—from drafting and review to distribution and archiving—establishing a single source of truth for all critical documentation. • A key feature is the guarantee of inspection readiness year-round, which is supported by comprehensive audit trails and full traceability of all document actions and changes within the system. • Regulatory compliance is foundational, with the platform explicitly meeting the requirements of FDA 21 CFR Part 11, GDPR, and EU Annex 11, ensuring the validity and security of electronic signatures. • The suite includes specialized, modular applications addressing core industry needs, such as Agatha Clinical eTMF, Agatha Remote ISF, Agatha SOP, Agatha Quality, and Agatha Regulatory documentation management. • Quality processes are controlled and automated through the ability to build custom workflow and lifecycle templates, which ensure that required actions are routed to the correct personnel promptly. • The system aids in organizational compliance by allowing users to quickly view training statuses, making it easy to identify and address pockets of non-compliance across the business. • Agatha positions itself as a modern, lower-cost alternative to complex legacy platforms, emphasizing ease of implementation and a user-friendly interface to achieve tangible results faster. • Users interact with the platform via a clean dashboard interface, which facilitates task completion, documentation searching, metric tracking, and report generation. • The platform is designed to embed quality systems into all layers of the business, moving beyond simple storage to actively manage and enforce quality processes and documentation standards. • A testimonial from a Senior Quality Manager at NS Pharma highlights the platform’s simplicity and ease of use, noting that it was a reasonable cost investment compared to other complicated systems available to smaller biotech firms. Tools/Resources Mentioned: * Agatha Clinical eTMF * Agatha Remote ISF * Agatha SOP * Agatha Quality * Agatha Regulatory Key Concepts: * **Electronic Document Management (EDM):** A system for managing documents throughout their lifecycle, from creation to disposition, in an electronic format. * **eTMF (Electronic Trial Master File):** A digital repository for the essential documents required to conduct a clinical trial, ensuring compliance and inspection readiness. * **21 CFR Part 11:** The FDA regulation governing electronic records and electronic signatures, ensuring they are trustworthy, reliable, and equivalent to paper records and handwritten signatures. * **EU Annex 11:** The European regulation concerning computerized systems used in regulated GxP activities. * **Inspection Readiness:** The state of having all necessary documentation, processes, and audit trails organized and accessible to satisfy regulatory inspections at any given time.

End to End Regulatory Information Management Case Study of a Veeva RIM Implementation
Astrix On Demand Webinars for Life Sciences
/@astrixlifescience
Apr 19, 2023
This. The discussion covers critical aspects like harmonizing global regulatory processes, managing data migration and integration from legacy systems, ensuring compliance, and navigating large-scale enterprise software adoption within the life sciences industry. This video explores an end-to-end Veeva Regulatory Information Management (RIM) system implementation for a top 10 pharmaceutical company, transitioning from disparate legacy systems to a globally consistent solution. The speakers discuss the complexities of harmonizing processes and terminology across global teams managing regulatory, CMC, and safety submissions. The case study highlights a multi-year journey involving current state assessment, future state design, detailed requirements gathering, configuration, and phased rollout strategies. A key theme is the collaborative approach between the client, Astrix (the consulting firm), and Veeva, emphasizing strong program management, communication, and meticulous planning for process and data readiness, as well as user adoption in a highly regulated environment. Key Takeaways: * **Complex Global Harmonization:** Large pharmaceutical companies face significant challenges in harmonizing regulatory processes and terminology across global teams due to reliance on disparate legacy tools (spreadsheets, SharePoint, bespoke systems). * **Structured Multi-Workstream Approach:** Successful large-scale implementations require a highly structured approach with dedicated workstreams for different functional areas (e.g., CMC, Safety, Regulatory, Authoring, Archive, Labeling), ensuring focused effort and expertise. * **Criticality of Process & Data Readiness:** Meticulous assessment of current processes, definition of harmonized future states, alignment on terminology, and comprehensive data mapping, migration, and integration planning are fundamental to a successful RIM system rollout. * **Vendor Collaboration is Key:** Direct and continuous collaboration with the software vendor (Veeva) is crucial for understanding system capabilities, best practices, configuration options, and leveraging product roadmaps for future enhancements. * **Comprehensive Change Management & Adoption:** Effective user adoption plans, including stakeholder analysis, continuous communication (newsletters, intranet), and tailored training, are essential to manage the learning curve and ensure business continuity during phased rollouts. * **Navigating Implementation Hurdles:** Common challenges include managing team member bandwidth, coordinating global time zones, addressing workstream dependencies, and adapting to system changes while maintaining ongoing critical operations and submission deadlines. * **Phased Rollout Strategy:** An iterative, phased rollout, starting with core capabilities and gradually expanding scope based on system readiness, legacy constraints, and business continuity, is an effective strategy for managing large-scale enterprise software implementations.

Where's My Money? Part 2: Doctor Pay Fails to Keep Pace with Healthcare Costs
AHealthcareZ - Healthcare Finance Explained
@ahealthcarez
Apr 19, 2023
This video provides an expert analysis of the widening financial gap between overall healthcare costs and physician compensation in the United States, using specific financial data since 2015. The speaker, a healthcare finance expert, establishes the central problem: while overall healthcare costs have surged by 52%—nearly double the rate of inflation—doctor pay has only increased by 29%. This significant disparity prompts an investigation into where the majority of healthcare dollars are being allocated, revealing critical financial dynamics within the life sciences and provider ecosystems. The analysis identifies two primary drivers for the disproportionate rise in costs relative to physician pay. The first driver is high hospital costs, rooted in superior negotiation power with commercial insurance companies. Hospitals, on average, are reimbursed at 224% of Medicare rates by commercial payers, whereas physicians receive only 129% of Medicare rates. This structural difference in reimbursement creates a massive financial imbalance favoring institutional providers over individual practitioners. The second major driver is the high cost of prescription medications, noting that the U.S. spends approximately $1,000 per person annually on drugs, which is double the expenditure seen in other industrialized nations. To illustrate how these factors play out, the video presents a stark comparison using a patient with rheumatoid arthritis. The example contrasts the reimbursement for institutional services and pharmaceutical products versus physician services. A knee replacement procedure for this patient costs over $50,000 for the hospital. If the patient is treated with a specialty drug like Humira, the annual cost is $78,000. In sharp contrast, a doctor seeing that same patient four times a year receives only $600 in total compensation. This example powerfully demonstrates that the vast majority of healthcare expenditure is directed toward facility fees and pharmaceutical products, leaving physicians with a minimal share of the total cost of care. The video concludes by proposing Direct Contracting as a viable solution for physicians to bypass the current broken system, reduce overall costs, and secure fairer compensation. Key Takeaways: • **Disparity in Healthcare Cost Growth:** Since 2015, overall U.S. healthcare costs have increased by 52%, a rate almost double that of inflation, while physician compensation has lagged significantly, rising only 29% during the same period. • **Hospital Reimbursement Advantage:** Commercial insurance companies pay hospitals an average of 224% of Medicare rates, granting them a substantial financial advantage over physicians, who are only reimbursed at 129% of Medicare rates for their services. • **Pharmaceutical Cost Burden:** High prescription drug costs are identified as a major driver of overall healthcare inflation, with the U.S. spending approximately $1,000 per person annually on medications, highlighting the significant financial role of the pharmaceutical sector. • **Specialty Drug Cost Example:** The annual cost of specialty medications, exemplified by Humira, which costs $78,000 per year, dwarfs the compensation received by the treating physician, illustrating where the majority of the healthcare dollar is concentrated. • **Low Physician Share of Care Cost:** In a specific case study involving a rheumatoid arthritis patient, the physician’s annual compensation for four visits ($600) is negligible compared to the costs associated with facility fees (e.g., $50,000 for a knee replacement) or specialty drug costs ($78,000/year). • **Commercial Operations Context:** For pharmaceutical companies, the high cost of specialty drugs like Humira ($78,000) underscores the necessity of robust commercial operations, market access strategies, and data engineering to justify and manage these high price points within the complex reimbursement landscape. • **Impact on Commercial Strategy:** The financial pressure on physicians due to low reimbursement suggests that pharmaceutical companies must consider physician financial viability and administrative burden when designing commercial support programs and digital tools (like AI sales assistants or chatbots). • **Direct Contracting as a Solution:** The video advocates for Direct Contracting as a mechanism for physicians to circumvent the traditional fee-for-service model, potentially leading to lower overall healthcare costs for the nation and improved financial equity for practitioners. • **Market Dynamics for Life Sciences:** The analysis provides critical context for life sciences firms regarding the financial ecosystem, emphasizing that cost drivers are primarily institutional (hospitals) and product-based (pharmaceuticals), rather than physician services. Tools/Resources Mentioned: * **Direct Contracting:** A payment and service delivery model where providers contract directly with employers or payers, bypassing traditional insurance intermediaries. * **Nomi Health:** The sponsor, promoted as an open network of physicians utilizing direct contracting models to reduce red tape and improve physician compensation. Key Concepts: * **Medicare Reimbursement Multiples:** The practice of commercial insurance companies paying providers (hospitals and doctors) a rate calculated as a percentage multiple of the standard Medicare rate, revealing significant negotiation disparities. * **Healthcare Cost Inflation:** The rapid increase in overall healthcare expenditures (52% since 2015) compared to general economic inflation and physician wage growth.

How Artificial Intelligence is Powering the Future of Underwriting
Self-Funded
@SelfFunded
Apr 18, 2023
This video provides an in-depth exploration of how Artificial Intelligence (AI) and machine learning are fundamentally transforming the health insurance underwriting process, specifically within the self-funding and stop-loss insurance markets. Featuring Matt Weaver, Director of Sales for Gradient AI, the discussion establishes that AI is moving from a novelty to a necessity for accurately predicting risk, especially for small to mid-sized groups that typically lack sufficient claims data—a segment often referred to as the "messy middle." The core value proposition is the automation of risk assessment, allowing carriers, MGUs, and consultants to make faster, more informed decisions regarding whether a group should move to self-funding and at what price point the risk should be assumed. Gradient AI's flagship product, the "SAIL" (Census Lookup Tool), operates by taking a basic census (first name, last name, gender, date of birth, zip code) and running it through a sophisticated, proprietary data aggregator ecosystem. This ecosystem integrates over 40 different points of signal, drawing on a vast pool of over 300 million de-identified U.S. patient records. The resulting output is a comprehensive risk profile generated in minutes, replacing time-consuming manual processes like individual medical questionnaires (IMQs/PHQs). The data leveraged includes claim line medical information (ICD-10s, procedure codes), pharmaceutical data (retail, specialty, J codes, gene therapy), and, uniquely, newly integrated lab data, with the model trained to score off the most recent four years of history. The system delivers several critical outputs: a risk score (calibrated nationally on a 1.0 scale, where above 1.0 is less preferred), a prediction of expected cost for the group over the next 12 months, and a detailed high-cost claimant report. Crucially, the tool provides transparency by listing the top chronic and high-cost conditions (ICD-10s) and top drugs, ranked by expected spend (Tier 1 drugs are those exceeding $150,000 in spend). This granular data allows underwriters and consultants to not only triage risk (red, yellow, or green light) but also to craft specific cost containment strategies, such as adjusting PBM formularies or recommending specific care management solutions based on identified high-cost conditions like gene therapy candidates. The speaker emphasizes that this AI is designed as advanced decision support, not a replacement for seasoned human underwriters, but rather a tool to accelerate and enhance their expertise. The rapid adoption of this technology—growing from a handful of clients to over 120 in two years, including six of the ten largest stop-loss carriers—underscores its market disruption. The speaker predicts that within the next 12 to 24 months, any carrier not utilizing some form of AI in its underwriting process risks being selected against due to competitive disadvantages in pricing and efficiency. Future applications of this technology are expected to move beyond front-end risk exposure prediction into performance analytics and claims management, helping care management teams drive better outcomes for existing blocks of business. The system maintains strict regulatory compliance by ensuring all data returned is de-identified and by avoiding the use of social determinant data (like credit history or social media posts) to mitigate concerns regarding inherent bias or discrimination. ### Detailed Key Takeaways * **AI as a Necessity in Underwriting:** The market is rapidly adopting AI for risk prediction; carriers and MGUs that do not integrate advanced AI tools within the next 12-24 months risk being selected against due to slower, less accurate, and less efficient underwriting processes. * **Solving the "Messy Middle" Data Gap:** AI tools are most valuable for small to mid-sized groups (e.g., 125 lives) moving from fully insured to self-funded status, where claims data is often limited or non-existent, allowing for accurate risk assessment where traditional methods fail. * **Advanced Data Aggregation:** Gradient AI utilizes a data aggregator ecosystem that pings a census against over 300 million de-identified U.S. patient records, achieving an industry-leading match rate of 92-93% for medical, RX, or lab data. * **Data Types for Predictive Lift:** The model relies on three core data types for predictive accuracy: claim line medical data (ICD-10s, procedure codes), comprehensive RX data (including specialty drugs and J codes for gene therapy/infusion), and lab data, which provides significant predictive lift. * **Replacing Manual Questionnaires:** The AI model's predictive accuracy allows risk-bearing entities to use the AI prediction in lieu of time-consuming and often incomplete individual medical questionnaires (IMQs/PHQs), streamlining the submission process for brokers and carriers. * **Consultant Use Case for Prospecting:** Consultants can use the AI tool to run a prospect's census to objectively determine if self-funding is appropriate for their risk profile, providing data-backed recommendations rather than generic sales pitches. * **Transparency and Actionable Insights:** The output includes not just a risk score and cost estimate, but also a curated list of top chronic and high-cost conditions (ICD-10s) and top drugs by spend, enabling targeted interventions like PBM formulary adjustments or specific cost containment vendor recommendations. * **Mergers and Acquisitions Risk Vetting:** The tool is crucial for vetting the risk of new acquisitions, especially when a group is considering moving to a self-funded plan, by identifying high-cost claimants or severe conditions (e.g., hemophilia, cancer) that could destabilize the combined risk pool. * **Focus on Medical Data over Social Determinants:** Gradient AI avoids using social determinant data (e.g., credit history, social media posts) because it sees greater predictive accuracy in actual medical/RX data and wishes to avoid potential regulatory scrutiny or claims of inherent bias/discrimination. * **Dynamic Risk Monitoring:** The pricing model allows clients (e.g., consultants or carriers) to run a group through the model multiple times per year to monitor how the risk profile is evolving against actual claims experience or to assess the impact of new acquisitions. * **Future in Claims Analytics:** The future roadmap includes leveraging the trained AI models for performance analytics and claims management, helping claims managers and care teams use advanced data to drive better clinical and financial outcomes for existing business. ### Tools/Resources Mentioned * **Gradient AI (SAIL):** Flagship census lookup tool utilizing AI and machine learning for predictive risk modeling in A&H insurance. * **Veeva:** Mentioned in the company context as a key platform for pharmaceutical industry operations (IntuitionLabs.ai provides consulting). * **David Young:** Mentioned as a partner with complete API integration with Gradient AI. ### Key Concepts * **Predictive Analytics:** The use of statistical algorithms and machine learning techniques to forecast future outcomes (e.g., claims costs, high-cost claimants) based on historical and aggregated data. * **Self-Funding/Stop-Loss:** Insurance mechanisms where the employer takes on the financial risk for employee health claims, mitigated by stop-loss insurance to cover catastrophic claims. * **Morbidity Score:** A component of the risk score that specifically measures the health status of a group, independent of demographic factors like age and gender. * **De-identified Data:** Health information that has been stripped of identifiers (like name or SSN) so that the individual cannot be reasonably identified, ensuring HIPAA compliance. * **Messy Middle:** A term used to describe small to mid-sized employer groups (e.g., 100-500 lives) that are often difficult to underwrite accurately due to limited or incomplete historical claims data. * **ICD-10s/Hicks Picks/J Codes:** Standardized coding systems used for medical diagnoses (ICD-10s), procedures (Hicks Picks), and specific injectable or specialty drugs (J Codes), all of which are analyzed by the AI model.

Financial Implications of Ozempic, Wegovy and Mounjaro... Training Session Highlights
AHealthcareZ - Healthcare Finance Explained
@ahealthcarez
Apr 16, 2023
This video provides an in-depth exploration of the financial implications of GLP-1 agonist medications, specifically Ozempic, Wegovy, and Mounjaro, for employer-sponsored health plans. The speaker, Dr. Bricker, begins by detailing each drug's profile, including its active ingredient (Semaglutide for Ozempic/Wegovy, Tirzepatide for Mounjaro), mechanism of action (primarily appetite suppression via GLP-1 agonism), FDA approval status (diabetes vs. weight loss), and typical dosages and administration. He highlights the significant weight loss potential of these drugs, while emphasizing that studies were conducted in conjunction with caloric deficits and exercise, not as standalone solutions. The presentation then transitions to the substantial costs associated with these medications and their rapid market adoption. Dr. Bricker provides specific sales figures for each drug in 2022, demonstrating their explosive growth and market impact. He calculates the annual cost of treatment for each medication, noting the pricing strategies employed by manufacturers. A core segment of the video is a detailed cost projection model for a hypothetical employer group, illustrating how quickly these drug costs can escalate from thousands to millions of dollars annually as adoption rates increase among eligible employees. Finally, the video delves into various cost containment strategies for employers. Dr. Bricker frames these options using the healthcare cost equation (cost per unit x number of units). He critically analyzes the role of Pharmacy Benefit Managers (PBMs), advocating for a shift from traditional PBM models, which he argues are incentivized by higher drug spend, to transparent pass-through PBMs. Other strategies discussed include prior authorization requirements, specialty carve-out programs (which are noted as controversial), and practical advice like optimizing Ozempic prescribing to utilize the most cost-effective 8mg pens for maintenance doses. Key Takeaways: * **GLP-1 Agonists are a Major Market Force:** Ozempic (Semaglutide), Wegovy (Semaglutide), and Mounjaro (Tirzepatide) are rapidly growing pharmaceutical products with significant sales (e.g., Ozempic at $9 billion in 2022, Wegovy up 400% year-over-year), indicating a substantial and expanding market. * **Distinct FDA Approvals and Mechanisms:** While all three are GLP-1 agonists causing appetite suppression and weight loss, Ozempic and Mounjaro are currently FDA-approved for Type 2 Diabetes, with weight loss as a significant side effect. Wegovy, a higher dose of Semaglutide, is specifically FDA-approved for weight loss in adults with obesity and comorbidities, and recently for adolescents aged 12 and over. * **Significant Weight Loss Potential with Lifestyle Integration:** These medications can lead to substantial weight loss (e.g., 10-13 lbs for Ozempic, 35 lbs for Wegovy, 25-52 lbs for Mounjaro). However, studies were conducted in conjunction with a 500-calorie daily deficit and 150 minutes of weekly exercise, emphasizing that they are not standalone "magic pills." * **High Annual Treatment Costs:** The annual cost for these medications is substantial, with Ozempic costing approximately $6,478 per year (when optimized), Mounjaro around $13,044 per year, and Wegovy exceeding $17,184 per year, posing a significant financial burden. * **Escalating Employer Health Plan Costs:** A model for a 1,000-life employer plan projects a potential $1.9 million annual increase in pharmacy costs if 50% of eligible obese members adopt these medications, representing a 19% increase in total health plan spend. This cost can scale to tens of millions for larger employers. * **Traditional PBMs May Exacerbate Costs:** The traditional PBM model, which profits from rebates and administrative fees tied to drug spend, is financially incentivized to increase the utilization of high-cost medications like GLP-1s, potentially working against employer cost containment efforts. * **Transparent PBMs as a Cost Mitigation Strategy:** Moving from a traditional PBM to a transparent or pass-through PBM model is recommended to align incentives and potentially lower the unit cost of medications by eliminating hidden profits and rebate structures. * **Prior Authorization Limitations:** While prior authorization is a common strategy to limit the number of units, the speaker suggests that PBMs may not be genuinely motivated to restrict access due to their financial models, making its effectiveness questionable. * **Controversial Specialty Rx Carve-Outs:** Some self-funded plans are implementing specialty carve-out vendors to exclude these medications from coverage, directing patients to pharmaceutical company patient assistance programs. This is a highly controversial but potentially significant cost-saving measure. * **Optimize Ozempic Dosing for Cost Efficiency:** Employers can reduce costs by ensuring that plan members on a maintenance dose of 1mg Ozempic are prescribed the 8mg pen, which provides more medication for the same cost as smaller pens, maximizing the "unit" for the "cost per unit." * **Understanding the "Healthy Obese" Population:** The video notes that up to a third of people classified as obese may not experience adverse health consequences, a concept known as "healthy obese," which could influence eligibility criteria for weight-loss medications. Key Concepts: * **GLP-1 Agonists (Glucagon-like peptide-1 receptor agonists):** A class of drugs that mimic the effects of the natural hormone GLP-1, stimulating insulin secretion, suppressing glucagon, and slowing gastric emptying, leading to improved glycemic control and appetite suppression. * **Semaglutide:** The active ingredient in Ozempic (for diabetes) and Wegovy (for weight loss). * **Tirzepatide:** The active ingredient in Mounjaro, a dual GLP-1 and GIP (glucose-dependent insulinotropic polypeptide) receptor agonist, offering a potentially more powerful effect. * **Traditional PBM vs. Pass-through PBM:** Traditional PBMs profit from spread pricing and rebates, often incentivizing higher drug spend. Pass-through PBMs charge a transparent administrative fee and pass all discounts and rebates directly to the client. * **Prior Authorization:** A process requiring healthcare providers to obtain approval from a health plan before prescribing certain medications or services. * **Specialty Rx Carve-Out:** A strategy where an employer's health plan excludes coverage for specific high-cost specialty medications, often directing patients to manufacturer-sponsored patient assistance programs. Examples/Case Studies: * **Ozempic Sales:** $9 billion in 2022, representing 77% year-over-year growth. * **Wegovy Sales:** $913 million in 2022, with a 400% year-over-year growth rate. * **Mounjaro Sales:** $280 million in Q4 2022, rapidly ramping up due to its recent approval. * **Employer Group Cost Projection:** A self-funded company with 500 employees (1,000 covered lives) and an average $10 million annual health spend could see an increase of $95,000 (2.5% adoption), $603,000 (16% adoption), or $1.9 million (50% adoption) in annual pharmacy costs due to GLP-1 medications.

Why We Need to Expand Patient Choice in Clinical Trials
Veeva Systems Inc
@VeevaSystems
Apr 13, 2023
This video provides an in-depth exploration of the evolution and future of clinical trials, emphasizing the critical need to expand patient choice and streamline site operations through technology. Featuring Tim Davis, VP of Strategy for MyVeeva for Patients, and Richard Young, the discussion aims to cut through the industry buzzwords like "decentralized clinical trials," "patient centricity," and "site centricity" to focus on practical, impactful strategies. The conversation traces the journey from archaic paper-based data collection to the promise of integrated digital platforms, highlighting the challenges and opportunities in managing clinical data, engaging patients, and navigating regulatory landscapes. The speakers delve into their early experiences in clinical data management, recalling the days of red and green pens, paper CRFs, and the initial skepticism surrounding electronic patient-reported outcomes (e-PRO) on devices like Palm Pilots. This historical context sets the stage for understanding the persistent challenges in data integration, where e-PRO data was often an "afterthought" and disconnected from the main clinical data management systems. Tim Davis argues that while regulators have become more supportive of digital solutions and patient-owned devices, the industry's own hesitancy and legacy practices often hinder innovation. He redefines patient centricity as simply "choice" and site centricity as "convenience," advocating for flexible, mixed-model approaches to trials rather than rigid adherence to the "decentralized" label. The discussion progresses to envisioning the future of "digital trials," emphasizing the necessity of a consistent, underlying platform that can flex to accommodate diverse patient needs and participation models, regardless of location. The COVID-19 pandemic is cited as a catalyst that exposed the shortcomings of disparate technology "islands" but also demonstrated the industry's capacity for rapid digital adoption. The podcast concludes with a "magic wand" thought experiment, where Tim Davis expresses a desire to overcome the historical baggage of e-PRO/e-COA, enhance patient recognition and transparency by sharing study outcomes, and eliminate the costly and often unnecessary practice of provisioning devices to every patient. The overarching message is to embrace the learnings from recent years and bravely move forward with integrated, patient-focused technological solutions. Key Takeaways: * **Evolution of Clinical Data Management:** Early clinical trials were heavily reliant on manual, paper-based data collection, leading to significant delays (often 8-14 weeks) between data recording and its availability for analysis, hindering timely insights. * **E-PRO Data as an Afterthought:** Historically, e-PRO/e-COA data was frequently treated as secondary to EDC data, often falling outside the primary purview of clinical data management teams, leading to integration challenges and being perceived as an additional burden. * **Bridging Real-time Data Gaps:** While early electronic methods (e.g., pain scales on rudimentary touchscreens) offered real-time patient data, the critical challenge lay in seamlessly integrating this data into the broader study database for comprehensive analysis and regulatory submission. * **Regulators are More Supportive:** Regulators are generally open to and supportive of digital solutions and the use of patient-owned devices in clinical trials, provided fundamental requirements like audit trails and data security are met. Industry hesitancy often stems from internal regulatory interpretations and a reluctance to be "first." * **Patient Centricity is Choice:** True patient centricity should be understood as providing patients with genuine "choice" in their participation, including flexibility in how and where they engage (e.g., remote visits, local pharmacies) and access to digestible educational information about their disease and trial. * **Site Centricity is Convenience:** Site centricity focuses on offering convenience to clinical sites through integrated technology solutions that operate "under one roof" with a single login, intuitive interfaces, and reduced administrative burden, especially when balancing multiple stakeholder demands. * **Rethinking "Decentralized Clinical Trials":** The term "decentralized clinical trials" is viewed as potentially restrictive, advocating instead for "digital trials" that offer inherent flexibility—a mix of remote, in-person, and hybrid approaches—tailored to patient needs and study design, rather than a rigid, all-or-nothing model. * **Integrated Data Strategy:** Data managers should adopt an "end-to-beginning" approach, considering how e-PRO data will integrate into the final data warehouse and statistical tables from the initial design phase. Consistent patient identification across all systems (EDC, RTSM, e-PRO) is paramount to avoid transcription errors and ensure data integrity. * **Overcoming E-PRO Legacy:** The industry must move past outdated e-PRO/e-COA practices, such as the historical necessity of providing every patient with a company-issued device (e.g., Palm Pilots), which is now an expensive and often unnecessary barrier to innovation. * **Enhancing Patient Recognition:** A significant improvement would be to "switch on" greater patient recognition and transparency by providing participants with high-level summaries of study outcomes, information on drug publication, and ongoing engagement, fostering trust and encouraging future participation. * **Eliminate Mandatory Device Provisioning:** The practice of mandatorily provisioning devices to all patients is costly, logistically complex, often disliked by sites, and frequently unnecessary, as most patients possess their own, often superior, mobile devices. A choice-based model is preferred. * **Leveraging COVID-19 Learnings:** The pandemic demonstrated the industry's ability to rapidly adopt digital technologies and maintain trial continuity under extreme pressure. These learnings about technology's potential and the need for adaptable operating models should inform future trial design and not be abandoned. * **Platform-Based Approach:** Moving away from disparate "islands" of technology vendors towards a unified, integrated platform approach (like Veeva's ecosystem) can significantly reduce timelines, improve data flow, and streamline the management of diverse data sources. **Tools/Resources Mentioned:** * **Palm Pilots:** Mentioned as an early, rudimentary device used for e-PRO data collection. * **EDC (Electronic Data Capture):** A standard system for collecting clinical trial data. * **e-PRO (Electronic Patient-Reported Outcomes):** Electronic methods for patients to report their own health status. * **e-COA (Electronic Clinical Outcome Assessment):** A broader term encompassing e-PRO and other electronic assessments. * **MyVeeva for Patients:** A patient-facing technology platform from Veeva Systems. **Key Concepts:** * **Patient Centricity:** Redefined as providing patients with "choice" and options in their clinical trial participation, focusing on convenience and accessibility. * **Site Centricity:** Defined as providing "convenience" to clinical sites through integrated and intuitive technology solutions that simplify workflows and reduce burden. * **Digital Trials:** A preferred term over "decentralized clinical trials," emphasizing the use of technology to enable flexible, mixed-model patient participation (remote, in-person, hybrid) based on individual needs and study requirements. * **Data Islands:** Refers to the common problem of disparate, unintegrated technology systems used across different aspects of clinical trials, leading to inefficiencies and data management challenges. **Examples/Case Studies:** * **Early Osteoarthritis Studies:** Use of rudimentary touchscreen devices in the early 2000s to collect pain scales from osteoarthritis patients, highlighting early efforts in e-PRO. * **Photocopied CRF Pages:** An anecdote about monitors photocopying paper CRF pages for visual analog scales, which resulted in incorrect measurements (e.g., 9.7cm instead of 10cm), underscoring the critical importance of data integrity and the flaws of paper-based methods for primary endpoints. * **COVID-19 Pandemic Impact:** The pandemic forced clinical trials to rapidly adopt layered technologies and adapt operating models, exposing both the challenges of disparate systems and the potential for technology to maintain trial continuity and accelerate drug development.
![Smpc/SPC [summary product characteristics ]](https://i.ytimg.com/vi_webp/NuaEf4sCMx0/maxresdefault.webp)
Smpc/SPC [summary product characteristics ]
PHARMACOPEDIA
/@PHARMACOPEDIA-rt2cu
Apr 10, 2023
This video provides a foundational explanation of the Summary of Product Characteristics (SmPC), often abbreviated as SPC. The speaker begins by defining SmPC as a document exclusively intended for healthcare professionals, emphasizing its crucial role in ensuring the safe and effective use of medications. The core purpose of the SmPC is to provide comprehensive and accurate information about a medicinal product, serving as a vital resource for informed decision-making in prescribing and dispensing. The content of an SmPC document is detailed, encompassing essential information such as a medication's ingredients, recommended dosage, and potential side effects. The video highlights that this critical information is derived from robust data, primarily clinical trials, and other validated sources. A key characteristic of the SmPC, as explained, is its dynamic nature; it is not a static document but is continuously updated to incorporate new scientific information and reflect changes in regulatory requirements, ensuring its ongoing accuracy and relevance. Throughout the explanation, the speaker reiterates the importance of the SmPC in empowering healthcare professionals. By providing up-to-date and reliable data, the SmPC enables these professionals to confidently prescribe medications and make well-informed decisions that prioritize patient safety and treatment efficacy. The consistent availability of accurate product information through the SmPC is presented as a cornerstone for maintaining trust in prescribed medications and upholding high standards of patient care within the healthcare system. Key Takeaways: * **Definition and Audience:** The Summary of Product Characteristics (SmPC), also known as SPC, is a critical regulatory document specifically designed for healthcare professionals. Its primary function is to serve as a definitive source of information regarding medicinal products. * **Essential Information Provided:** SmPC documents contain vital details about a medication, including its active ingredients, recommended dosages, administration routes, indications, contraindications, warnings, precautions, and potential side effects. This comprehensive data is crucial for safe and effective use. * **Role in Medication Safety:** A core function of the SmPC is to ensure the safe and effective use of medications. By standardizing and centralizing essential product information, it helps healthcare professionals understand the full profile of a drug before prescribing or dispensing. * **Evidence-Based Foundation:** The information contained within an SmPC is rigorously based on data derived from clinical trials and other scientific sources. This ensures that the guidance provided is evidence-based and reflects the most current understanding of the medication's profile. * **Dynamic and Regulatory Nature:** SmPC documents are not static; they are continuously updated to reflect new scientific findings, post-market surveillance data, and changes in regulatory requirements. This dynamic aspect underscores the importance of robust version control and dissemination mechanisms within the pharmaceutical industry. * **Informed Decision-Making for HCPs:** The SmPC empowers healthcare professionals to make informed decisions regarding prescribing and dispensing medications. Access to accurate and up-to-date information is fundamental for tailoring treatments to individual patient needs and minimizing risks. * **Impact on Patient Confidence:** By providing healthcare professionals with reliable information, the SmPC indirectly contributes to patient confidence in the medications they are prescribed. This transparency and accuracy are vital for therapeutic adherence and positive health outcomes. * **Regulatory Compliance Cornerstone:** For pharmaceutical companies, the creation, maintenance, and dissemination of an accurate SmPC are fundamental aspects of regulatory compliance. It represents a commitment to providing complete product information as mandated by regulatory bodies like the FDA and EMA. * **Implications for Medical Affairs and Commercial Operations:** The SmPC is a cornerstone for medical affairs teams in responding to inquiries from healthcare professionals and for commercial teams in ensuring promotional materials align with approved product information. Any AI solutions for these departments would heavily rely on SmPC data. * **Data Management Challenge:** The constant updates and the sheer volume of information within SmPCs present a significant data management challenge for pharmaceutical companies, requiring sophisticated systems for data integration, version control, and accessibility. Key Concepts: * **SmPC (Summary of Product Characteristics) / SPC:** A comprehensive regulatory document outlining the essential information about a medicinal product, intended for healthcare professionals to ensure its safe and effective use. It includes details on ingredients, dosage, side effects, and is regularly updated based on clinical data and regulatory changes.

How Power Works in Healthcare
AHealthcareZ - Healthcare Finance Explained
@ahealthcarez
Apr 9, 2023
This video provides an in-depth exploration of how power structures operate within healthcare organizations, drawing parallels to political systems. The speaker, Dr. Bricker, leverages insights from Bruce Bueno De Mesquita's work, particularly "The Dictator's Handbook," to illustrate that all organizations, including hospitals, health insurance companies, physician groups, and pharmaceutical companies, are inherently political. He establishes that power distribution within these entities follows a predictable pattern, not just at the top leadership level but fractally throughout the entire hierarchy. The core of the discussion revolves around four fundamental rules leaders must follow to attain and maintain power. First, a leader cannot rule alone and must form a coalition of followers. Second, the leader must control the organization's financial resources and use this budgetary power to buy loyalty from their coalition. Third, it is crucial to keep the size of this inner circle or coalition relatively small to prevent internal squabbling and maintain control, as larger groups are harder to manage and require more resources to satisfy. Finally, leaders must ensure a large pool of potential candidates for the inner circle, making any current member easily replaceable if they become non-compliant, thereby removing their leverage and ensuring obedience. Dr. Bricker then extends this framework by explaining that these power relationships are fractal, meaning they repeat in smaller, self-similar patterns down the organizational chart. A department head, for instance, receives a budget from their superior and then, in turn, distributes portions of that budget to their own loyal supporters, forming their own mini-coalition and inner circle. This creates a pyramid of power where each layer replicates the dynamics of the layer above it. The video concludes by providing specific, real-world examples from healthcare to illustrate these abstract principles, offering concrete evidence of how these power dynamics play out in practice. Key Takeaways: * **Universal Political Dynamics:** All organizations, including those in healthcare (hospitals, pharmaceutical companies, health insurance carriers, medical schools), operate with inherent political power structures, not just formal hierarchies. * **The Four Rules of Power:** Leaders must (1) form a coalition of followers, (2) control financial resources to buy loyalty, (3) keep the inner circle/coalition small to minimize dissent, and (4) maintain a large pool of potential replacements to ensure compliance and leverage. * **Budgetary Control as a Loyalty Tool:** Access to and control over budgets (e.g., "slush funds" or discretionary spending) is a primary mechanism for leaders to secure and maintain loyalty from key personnel within their coalition. * **Fractal Nature of Power:** Power dynamics are not confined to the top; they are fractal, repeating at every level of an organization. Department heads, for example, manage their own budgets and form sub-coalitions among their teams. * **Siloed Information in Large Organizations:** Large healthcare organizations, particularly health insurance carriers, are often intentionally siloed and top-down. Information about strategic direction or overall operations is limited to a small leadership coalition, preventing broader understanding among employees. * **Intentional "Dumbing Down" of Workforce:** Some healthcare organizations may intentionally limit comprehensive training (e.g., the elimination of "group school" for health insurance sales reps) to reduce internal squabbling and ensure employees simply follow directives without questioning the broader strategy. * **Impact of Limited Employee Understanding:** This lack of holistic understanding among employees can lead to inefficiencies, misaligned efforts (e.g., sales reps unaware of utilization management practices), and a reliance on external resources for basic operational knowledge. * **Replaceability and Compliance:** The existence of a large pool of potential replacements for inner circle positions ensures that current members remain compliant and do not "rock the boat," as their leverage is minimal. This is exemplified by pre-tenured medical school faculty who must adhere to publishing goals to achieve tenure. * **Challenges for External Partners:** For consulting firms like IntuitionLabs.ai, understanding these internal political landscapes, budgetary controls, and information silos is crucial for successful engagement, identifying true decision-makers, and navigating resistance to change or new solutions. * **Opportunity for Value Proposition:** The observed lack of internal understanding within client organizations (e.g., health insurance employees watching external videos to understand their own industry) highlights an opportunity for external experts to provide clarity and strategic insights. Key Concepts: * **Political Power in Organizations:** The informal influence and control dynamics that exist within formal organizational structures. * **Coalition:** A group of followers or key individuals that a leader relies on to maintain power. * **Inner Circle:** The small, trusted group within a coalition that directly supports the leader and wields significant influence. * **Replaceability:** The ease with which a member of a coalition or inner circle can be substituted, which reduces their leverage and ensures compliance. * **Fractal Power:** The concept that power dynamics and structures repeat in similar patterns at different scales throughout an organization. * **Budgetary Power:** The control over financial resources used by leaders to reward loyalty and influence behavior. * **Siloed Organizations:** Organizational structures where different departments or teams operate in isolation, with limited information sharing or understanding of each other's functions. Examples/Case Studies: * **Hospital CEO Discretionary Budget:** A new hospital CEO provided a medical director with a special "slush fund" or discretionary budget outside the normal process to buy loyalty and encourage the pursuit of specific improvements in outpatient clinics. * **Health Insurance Carrier Siloing and "Group School" Elimination:** Major health insurance carriers are characterized by top-down, siloed structures where employees (e.g., sales reps) lack comprehensive training (e.g., the discontinued "group school") on overall operations like utilization management, leading to a disconnect between sales promises and actual member experience. * **Medical School Pre-Tenured Faculty:** Associate and assistant professors at medical schools are highly replaceable and must diligently pursue research and publishing goals to avoid being "gone" and to progress towards the scarce tenured full professor positions, demonstrating the principle of replaceability and compliance.

ISO 9001 - 2015 | QMS | Quality Management System | Global QMS | Summarized Video | DNG Academy
DNG Academy
/@dng-academy
Apr 8, 2023
This video provides a comprehensive overview of ISO 9001:2015, the international standard for Quality Management Systems (QMS). It delves into the definition of quality and QMS, outlining the standard's history, key revisions, and its 10 core clauses. The speaker highlights the numerous advantages of implementing ISO 9001, such as improved customer satisfaction, enhanced process efficiency, better risk management, and increased stakeholder confidence. Furthermore, the video offers practical guidance through 10 smart techniques for successful ISO 9001 implementation, alongside a discussion of common challenges organizations face during this process. Key Takeaways: * **Foundational QMS Framework:** ISO 9001:2015 provides a globally recognized, systematic approach to quality management, emphasizing continuous improvement, customer satisfaction, and the effective management of processes, which is critical for regulated industries. * **Strategic Focus Areas:** The standard places a strong emphasis on risk-based thinking, leadership commitment from top management, and understanding the organizational context, all of which are vital for robust quality and compliance strategies. * **Tangible Business Benefits:** Implementing ISO 9001 can lead to significant operational and reputational advantages, including streamlined processes, reduced waste, improved decision-making, enhanced supplier relationships, and a stronger market reputation. * **Structured Implementation Approach:** Successful adoption requires a structured approach involving top management buy-in, detailed project planning, gap analysis, comprehensive employee training, robust document control, and regular internal audits. * **Anticipating and Mitigating Challenges:** Organizations should be prepared for common implementation hurdles such as resistance to change, resource limitations, the complexity of the standard, and the need for effective communication and employee involvement to ensure sustained compliance and improvement.

Health Insurance Self-Funding Across America
AHealthcareZ - Healthcare Finance Explained
@ahealthcarez
Apr 2, 2023
This video provides an in-depth exploration of health insurance self-funding trends across the United States, highlighting significant geographic and employer-size variations. The speaker, Dr. Bricker from AHealthcareZ, begins by presenting a visual map illustrating areas with higher (dark green) and lower (light orange) concentrations of self-funded employers. He identifies a "self-funding alley" in the Midwest and South (e.g., North Carolina, Virginia, Kentucky, West Virginia, Ohio, Indiana) where self-funding rates are notably high, contrasting with lower rates in populous states like California, Arizona, Nevada, and the Northeast (e.g., Massachusetts, New York, New Jersey, Maryland). The analysis then delves into specific data, breaking down self-funding rates by employer size: companies with 100-1,000 employees (mid-market) and those with over 1,000 employees. While large employers consistently show high self-funding rates (around 77% nationally), the mid-market segment exhibits considerable variability across states, with a national average of 42%. This mid-market segment is identified as the key area where employers' cost-consciousness regarding health benefits is most evident. The speaker posits that states with higher mid-market self-funding rates are more focused on the financial performance and efficiency of their employee health plans, as self-funded plans are generally less expensive without compromising quality. A core theme explored is the "push and pull" dynamic influencing self-funding decisions, primarily driven by business margins and health insurance carriers. Low-margin businesses, such as grocery stores or manufacturing (e.g., auto parts in Ohio and Indiana, general manufacturing in Pennsylvania, Iowa, Georgia, Carolinas), are "pushed" towards self-funding due to their intense focus on cost-cutting. Conversely, high-margin businesses like software, technology, finance, and biotech (prevalent in California, New York, Massachusetts) are less likely to self-fund because their substantial profits reduce the urgency for aggressive cost-cutting in health benefits. The "pull" factor comes from health insurance carriers, who actively discourage self-funding, especially in the mid-market, as they generate more profit from fully insured plans. The video concludes by noting a "social proof" or "herd mentality" among employers, where local CFOs and HR heads influence each other's decisions regarding self-funding. Key Takeaways: * **Geographic Disparity in Self-Funding:** There are significant regional differences in health insurance self-funding rates across the U.S., with a "self-funding alley" in the Midwest/South showing high rates and populous coastal states often exhibiting lower rates. * **Mid-Market as a Key Indicator:** The self-funding rate for mid-market employers (100-1,000 employees) is the most variable and indicative of a state's overall focus on cost-effective health benefits, averaging 42% nationally but ranging widely. * **Large Employers Consistently Self-Fund:** Employers with over 1,000 employees show a consistently high rate of self-funding (around 77% nationally), indicating that for larger organizations, self-funding is a standard practice regardless of location. * **Business Margins Drive Self-Funding Decisions:** Low-margin industries (e.g., manufacturing, grocery) are strongly incentivized to self-fund to cut costs, while high-margin industries (e.g., software, finance, biotech) are less focused on health benefit cost-cutting and thus less likely to self-fund. * **Health Insurance Carriers Discourage Self-Funding:** Insurance carriers actively work to keep employers, particularly in the mid-market, on fully insured plans because these generate higher profits for them compared to self-funded arrangements. * **High-Margin States Have Lower Self-Funding:** States with a high concentration of high-margin businesses like California (tech, entertainment), New York (finance), and Massachusetts (software, biotech) exhibit significantly lower mid-market self-funding rates (e.g., CA 31%, NY 29%, MA 35% vs. national average 42%). * **Low-Margin States Have Higher Self-Funding:** Conversely, states with a strong manufacturing base and other lower-margin industries, such as Pennsylvania (55%), Indiana (67%), Ohio (56%), Iowa (58%), Georgia (59%), and the Carolinas (61%), show much higher mid-market self-funding rates. * **Self-Funding Offers Cost Savings:** Self-funded health plans are generally presented as a less expensive option for employers without necessarily compromising the quality of care provided to employees. * **Social Proof and Herd Mentality:** Employer decisions regarding self-funding are influenced by local peer groups; CFOs and HR heads often adopt practices common among similar companies in their geographic area. * **Specific State Examples:** The video provides concrete data points, such as Nebraska having a very high self-funding rate (79%) for mid-market employers, potentially due to its concentrated employer base and social proof dynamics. Key Concepts: * **Self-funding (health insurance):** An arrangement where an employer directly assumes the financial risk for providing healthcare benefits to its employees, paying claims out of its own assets rather than paying fixed premiums to an insurance carrier. * **Fully insured (health insurance):** An arrangement where an employer pays a fixed premium to an insurance carrier, and the carrier assumes the financial risk for paying employee healthcare claims. * **Mid-market employers:** Companies typically defined as having between 100 and 1,000 employees. * **Low-margin vs. High-margin businesses:** Refers to businesses with different profit margins, influencing their sensitivity to cost-cutting measures, including health benefits. * **Social proof/Herd mentality:** A psychological phenomenon where people assume the actions of others in an attempt to reflect correct behavior in a given situation, often seen in business decision-making.